SlideShare a Scribd company logo
1 of 29
Download to read offline
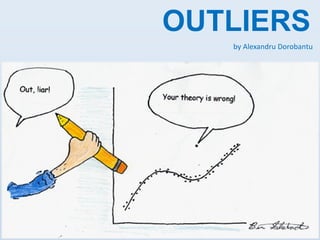
OUTLIERS
by Alexandru Dorobantu
Introduction
1. Who cares?
2. What is an Outlier?
3. How does it impact regression?
4. What causes Outliers?
5. How can we detect them?
6. What to do with Outliers?
7. Recap: Why/when do they matter?
Why Market Forecasts
Keep Missing the Mark
“Fish gotta swim, birds gotta fly and analysts
and market strategists gotta try predicting what
stocks will do every year. But you don't gotta
act on those predictions -- at least not before
you ask how likely they are to hit the bullseye.”
The Wall Street Journal(2009)1
http://www.wsj.com/news/articles/SB123275782424412007
Significant Outliers
If you take the daily returns of the Dow from
1900 to 2008 and you subtract the 10 best days,
you end up with about 60 percent less money
than if you had stayed invested the entire time
If you remove the worst 10 days from history,
you would have ended up with three times
more money.yed invested the entire time.
What is an Outlier?
data point that is far outside the norm for
a variable or population;
observation that “deviates so much from
other observations as to arouse suspicions
that it was generated by a different
mechanism”;
values that are “dubious in the eyes of the
researcher”.
How outliers impact ordinary regression
Even worse, with multiple regression, an outlier in x-space
may not look particularly unusual for any single x-variable. If
there's a possibility of such a point, it's potentially a very risky
thing to use least squares regression on.
WHAT CAUSES OUTLIERS?
Data errors
Outliers are often caused by human error, such
as errors in data collection, recording, or entry.
Intentional or motivated
mis-reporting.
• Social desirability and self-presentation
motives can be powerful
• This can also happen for obvious reasons
when data are sensitive (e.g., teenagers
under-reporting drug or alcohol use, mis-
reporting of sexual behavior).
http://www.livescience.com/7038-men-report-sex-partners-women.html
Sampling error
It is possible that a few members of a sample
were inadvertently drawn from a different
population than the rest of the sample.
Standardization failure
If something anomalous happened during a
particular subject’s experience it will influence
the study outcome.
Faulty distributional assumptions
Incorrect assumptions about the distribution of
the data can also lead to the presence of
suspected outliers
Legitimate cases sampled from the
correct population
It is possible that an outlier can come from the
population being sampled legitimately through
random chance.
It is important to note
that sample size plays a
role in the probability
of outlying values.
Outliers as potential focus of inquiry
We don't necessarily need to remove the
outliers  sometimes, finding the outliers is the
purpose of the study (e.g. fraud identification,
immunology advancements1)
http://www.medicalnewstoday.com/articles/241705.php
Identification of Outliers
Simple rules of thumb:
Data points three or more standard deviations
from the mean
Mahalanobis’ distance
Cook’s D
Cook’s D Mahalanobis’ distance
Mahalanobis’ distance
That doesn't really look like a circle, does it? That's because this picture is distorted (as
evidenced by the different spacings among the numbers on the two axes).
Mahalanobis’ distance
Let's redraw it with the axes in
their proper orientations--left to
right and bottom to top--and
with a unit aspect ratio so that
one unit horizontally really does
equal one unit vertically:
You measure the Mahalanobis distance as Euclidean
distance in this picture rather than in the original.
Dealing with Outliers
Removal
2,3,4,5,6,10,100  2,3,4,5,6,10,100
Transformations (e.g.: taking the log)
2,3,4,5,6,10,100 0.3, 0.47, 0.6, 0.69, 1 , 2
Trunchiation
2,3,4,5,6,10,100  2,3,4,5,6,10,10
Robust Methods – Trimmed mean
Is calculated by temporarily eliminating extreme
observations at both ends of the sample
(between 10%-25% of ends)
1, 6, 12, 14, 20, 24, 36, 100
Regular Mean: 26.62
1, 6, 12, 14, 20, 24, 36, 100
Trimmed Mean: 17.5
More Info
Robust Methods – Winsorized mean
Highest and lowest observations are temporarily
censored, and replaced with adjacent values
from the remaining data
1, 6, 12, 14, 20, 24, 36, 100
Regular Mean: 26.62
6, 6, 12, 14, 20, 24, 36, 36
Winsorized Mean: 19.25
More Info
Robust Methods – LTS
The Least Trimmed Squares (LTS) method
attempts to minimize the sum of squared
residuals over a subset, k, of those points.
The n-k points which are not used do not
influence the fit.
More Info
Robust Methods – LMS
The Least Median of Squares (LMS) replaces the
mean by the much less sensitive median, witch
generates a more robust estimator.
1, 6, 12, 14, 20, 24, 36, 100
Regular Mean: 26.62
Median = (20+14)/2 = 17
More info
Recap: Why do they matter?
Present false information (data errors, etc.)
Create new questions (new clusters, etc.)
Ruin predictions (increase error-proneness )
Offer insights (anomalies, examples, etc.)
Announce issues (fraud, etc.)
Recap: When do they matter?
Always!
It’s just that sometimes you NEED to have them
and sometimes you NEED NOT to have them.
Thank you for listening!
Hope I didn’t waste
your time!
References
1. The power of outliers (and why researchers should ALWAYS check for them) –
Jason W. Osborne and Amy Overbay, North Carolina State University
2. Best Practices in Quantitative Methods – edited by Jason Osborne
3. Outlier detection using regression – http://stats.stackexchange.com
4. Fast linear regression robust to outliers – http://stats.stackexchange.com
5. Explanation of the Mahalanobis distance – http://stats.stackexchange.com

More Related Content

What's hot

Inferential statistics
Inferential statisticsInferential statistics
Inferential statisticsAshok Kulkarni
 
Lecture 6. univariate and bivariate analysis
Lecture 6. univariate and bivariate analysisLecture 6. univariate and bivariate analysis
Lecture 6. univariate and bivariate analysisDr Rajeev Kumar
 
Analysis-of-data-with-missing-values.pptx
Analysis-of-data-with-missing-values.pptxAnalysis-of-data-with-missing-values.pptx
Analysis-of-data-with-missing-values.pptxAASTHAJAJOO
 
Ppt for 1.1 introduction to statistical inference
Ppt for 1.1 introduction to statistical inferencePpt for 1.1 introduction to statistical inference
Ppt for 1.1 introduction to statistical inferencevasu Chemistry
 
Logistic regression
Logistic regressionLogistic regression
Logistic regressionDrZahid Khan
 
Skewness and Kurtosis
Skewness and KurtosisSkewness and Kurtosis
Skewness and KurtosisRohan Nagpal
 
Exploratory data analysis with Python
Exploratory data analysis with PythonExploratory data analysis with Python
Exploratory data analysis with PythonDavis David
 
Exploratory data analysis
Exploratory data analysisExploratory data analysis
Exploratory data analysisGramener
 
Logistic regression with SPSS examples
Logistic regression with SPSS examplesLogistic regression with SPSS examples
Logistic regression with SPSS examplesGaurav Kamboj
 
Box and whisker plots
Box and whisker plotsBox and whisker plots
Box and whisker plotsGarima Gupta
 
Statistical analysis and interpretation
Statistical analysis and interpretationStatistical analysis and interpretation
Statistical analysis and interpretationDave Marcial
 
Skewness & Kurtosis
Skewness & KurtosisSkewness & Kurtosis
Skewness & KurtosisNavin Bafna
 

What's hot (20)

Normality tests
Normality testsNormality tests
Normality tests
 
Inferential statistics
Inferential statisticsInferential statistics
Inferential statistics
 
Lecture 6. univariate and bivariate analysis
Lecture 6. univariate and bivariate analysisLecture 6. univariate and bivariate analysis
Lecture 6. univariate and bivariate analysis
 
Analysis-of-data-with-missing-values.pptx
Analysis-of-data-with-missing-values.pptxAnalysis-of-data-with-missing-values.pptx
Analysis-of-data-with-missing-values.pptx
 
Data analysis
Data analysisData analysis
Data analysis
 
Ppt for 1.1 introduction to statistical inference
Ppt for 1.1 introduction to statistical inferencePpt for 1.1 introduction to statistical inference
Ppt for 1.1 introduction to statistical inference
 
Statistical Distributions
Statistical DistributionsStatistical Distributions
Statistical Distributions
 
Logistic regression
Logistic regressionLogistic regression
Logistic regression
 
Skewness and Kurtosis
Skewness and KurtosisSkewness and Kurtosis
Skewness and Kurtosis
 
Exploratory data analysis with Python
Exploratory data analysis with PythonExploratory data analysis with Python
Exploratory data analysis with Python
 
Exploratory data analysis
Exploratory data analysisExploratory data analysis
Exploratory data analysis
 
Logistic Regression Analysis
Logistic Regression AnalysisLogistic Regression Analysis
Logistic Regression Analysis
 
Logistic regression with SPSS examples
Logistic regression with SPSS examplesLogistic regression with SPSS examples
Logistic regression with SPSS examples
 
outliers
outliersoutliers
outliers
 
Box and whisker plots
Box and whisker plotsBox and whisker plots
Box and whisker plots
 
Normality
NormalityNormality
Normality
 
Statistics for data science
Statistics for data science Statistics for data science
Statistics for data science
 
Statistical analysis and interpretation
Statistical analysis and interpretationStatistical analysis and interpretation
Statistical analysis and interpretation
 
Testing Hypothesis
Testing HypothesisTesting Hypothesis
Testing Hypothesis
 
Skewness & Kurtosis
Skewness & KurtosisSkewness & Kurtosis
Skewness & Kurtosis
 

Viewers also liked

Local Outlier Factor
Local Outlier FactorLocal Outlier Factor
Local Outlier FactorAMR koura
 
Class Outlier Mining
Class Outlier MiningClass Outlier Mining
Class Outlier MiningMotaz Saad
 
Outliers -Story of Success by Malcolm Gladwell
 Outliers -Story of Success by Malcolm Gladwell Outliers -Story of Success by Malcolm Gladwell
Outliers -Story of Success by Malcolm GladwellMa . Josefa Magbanua
 
SAS Regression Certificate
SAS Regression CertificateSAS Regression Certificate
SAS Regression CertificateSameer Shaikh
 
Robust outlier detection
Robust outlier detection Robust outlier detection
Robust outlier detection vinnief
 
"Outliers" - Malcolm Gladwell Book Review
"Outliers" - Malcolm Gladwell Book Review"Outliers" - Malcolm Gladwell Book Review
"Outliers" - Malcolm Gladwell Book ReviewArchit Rathi
 
H2O World - Cancer Detection via the Lasso - Rob Tibshirani
H2O World - Cancer Detection via the Lasso - Rob TibshiraniH2O World - Cancer Detection via the Lasso - Rob Tibshirani
H2O World - Cancer Detection via the Lasso - Rob TibshiraniSri Ambati
 
The RuLIS approach to outliers (Marcello D'Orazio,FAO)
The RuLIS approach to outliers (Marcello D'Orazio,FAO)The RuLIS approach to outliers (Marcello D'Orazio,FAO)
The RuLIS approach to outliers (Marcello D'Orazio,FAO)FAO
 
Bayesian Robust Linear Regression with Outlier Detection
Bayesian Robust Linear Regression with Outlier DetectionBayesian Robust Linear Regression with Outlier Detection
Bayesian Robust Linear Regression with Outlier DetectionJonathan Sedar
 
Inferring networks from multiple samples with consensus LASSO
Inferring networks from multiple samples with consensus LASSOInferring networks from multiple samples with consensus LASSO
Inferring networks from multiple samples with consensus LASSOtuxette
 
Outlier detection for high dimensional data
Outlier detection for high dimensional dataOutlier detection for high dimensional data
Outlier detection for high dimensional dataParag Tamhane
 
Heteroscedasticity
HeteroscedasticityHeteroscedasticity
HeteroscedasticityMuhammad Ali
 
3.7 outlier analysis
3.7 outlier analysis3.7 outlier analysis
3.7 outlier analysisKrish_ver2
 
A LASSO for Linked Data
A LASSO for Linked DataA LASSO for Linked Data
A LASSO for Linked Datathosch
 
Anomaly detection Meetup Slides
Anomaly detection Meetup SlidesAnomaly detection Meetup Slides
Anomaly detection Meetup SlidesQuantUniversity
 

Viewers also liked (20)

Depth based app
Depth based appDepth based app
Depth based app
 
Local Outlier Factor
Local Outlier FactorLocal Outlier Factor
Local Outlier Factor
 
Outliers
OutliersOutliers
Outliers
 
Class Outlier Mining
Class Outlier MiningClass Outlier Mining
Class Outlier Mining
 
Outliers -Story of Success by Malcolm Gladwell
 Outliers -Story of Success by Malcolm Gladwell Outliers -Story of Success by Malcolm Gladwell
Outliers -Story of Success by Malcolm Gladwell
 
Outliers, the story of success
Outliers, the story of successOutliers, the story of success
Outliers, the story of success
 
SAS Regression Certificate
SAS Regression CertificateSAS Regression Certificate
SAS Regression Certificate
 
Robust outlier detection
Robust outlier detection Robust outlier detection
Robust outlier detection
 
"Outliers" - Malcolm Gladwell Book Review
"Outliers" - Malcolm Gladwell Book Review"Outliers" - Malcolm Gladwell Book Review
"Outliers" - Malcolm Gladwell Book Review
 
H2O World - Cancer Detection via the Lasso - Rob Tibshirani
H2O World - Cancer Detection via the Lasso - Rob TibshiraniH2O World - Cancer Detection via the Lasso - Rob Tibshirani
H2O World - Cancer Detection via the Lasso - Rob Tibshirani
 
The RuLIS approach to outliers (Marcello D'Orazio,FAO)
The RuLIS approach to outliers (Marcello D'Orazio,FAO)The RuLIS approach to outliers (Marcello D'Orazio,FAO)
The RuLIS approach to outliers (Marcello D'Orazio,FAO)
 
Bayesian Robust Linear Regression with Outlier Detection
Bayesian Robust Linear Regression with Outlier DetectionBayesian Robust Linear Regression with Outlier Detection
Bayesian Robust Linear Regression with Outlier Detection
 
Outliers
OutliersOutliers
Outliers
 
Inferring networks from multiple samples with consensus LASSO
Inferring networks from multiple samples with consensus LASSOInferring networks from multiple samples with consensus LASSO
Inferring networks from multiple samples with consensus LASSO
 
Outliers
OutliersOutliers
Outliers
 
Outlier detection for high dimensional data
Outlier detection for high dimensional dataOutlier detection for high dimensional data
Outlier detection for high dimensional data
 
Heteroscedasticity
HeteroscedasticityHeteroscedasticity
Heteroscedasticity
 
3.7 outlier analysis
3.7 outlier analysis3.7 outlier analysis
3.7 outlier analysis
 
A LASSO for Linked Data
A LASSO for Linked DataA LASSO for Linked Data
A LASSO for Linked Data
 
Anomaly detection Meetup Slides
Anomaly detection Meetup SlidesAnomaly detection Meetup Slides
Anomaly detection Meetup Slides
 

Similar to Outlier Detection and Impact

The%20 Minimum%20 Daily%20 Adult%20 %20 Ca Cmg
The%20 Minimum%20 Daily%20 Adult%20 %20 Ca CmgThe%20 Minimum%20 Daily%20 Adult%20 %20 Ca Cmg
The%20 Minimum%20 Daily%20 Adult%20 %20 Ca Cmgdahirf
 
Numbers Rule Your World: The Hidden Influence of Probabilities and Statistics...
Numbers Rule Your World: The Hidden Influence of Probabilities and Statistics...Numbers Rule Your World: The Hidden Influence of Probabilities and Statistics...
Numbers Rule Your World: The Hidden Influence of Probabilities and Statistics...McGraw-Hill Professional
 
Dealing with outliers in Clinical Research
Dealing with outliers in Clinical ResearchDealing with outliers in Clinical Research
Dealing with outliers in Clinical ResearchAdrian Olszewski
 
Fact, Figures and Statistics
Fact, Figures and StatisticsFact, Figures and Statistics
Fact, Figures and Statisticsmeducationdotnet
 
Non probability sampling
Non  probability samplingNon  probability sampling
Non probability samplingcorayu13
 
BASIC MATH PROBLEMS IN STATISCTICSS.pptx
BASIC MATH PROBLEMS IN STATISCTICSS.pptxBASIC MATH PROBLEMS IN STATISCTICSS.pptx
BASIC MATH PROBLEMS IN STATISCTICSS.pptxAngelFaithBactol
 
2010 smg training_cardiff_day2_session4_sterne
2010 smg training_cardiff_day2_session4_sterne2010 smg training_cardiff_day2_session4_sterne
2010 smg training_cardiff_day2_session4_sternergveroniki
 
The Statistical Mystique
The Statistical MystiqueThe Statistical Mystique
The Statistical Mystiquetpkcfa
 
Determining sample size
Determining sample sizeDetermining sample size
Determining sample sizeMARY MALASZEK
 
Chapter 3 part3-Toward Statistical Inference
Chapter 3 part3-Toward Statistical InferenceChapter 3 part3-Toward Statistical Inference
Chapter 3 part3-Toward Statistical Inferencenszakir
 
Chapter 3 part2- Sampling Design
Chapter 3 part2- Sampling DesignChapter 3 part2- Sampling Design
Chapter 3 part2- Sampling Designnszakir
 
Statistice Chapter 02[1]
Statistice  Chapter 02[1]Statistice  Chapter 02[1]
Statistice Chapter 02[1]plisasm
 
Investment Management. Y4. Alexis Finet
Investment Management. Y4. Alexis FinetInvestment Management. Y4. Alexis Finet
Investment Management. Y4. Alexis FinetAlexis Nicolas Finet
 
Sensitivity Analysis
Sensitivity AnalysisSensitivity Analysis
Sensitivity AnalysisBeth Johnson
 

Similar to Outlier Detection and Impact (20)

The%20 Minimum%20 Daily%20 Adult%20 %20 Ca Cmg
The%20 Minimum%20 Daily%20 Adult%20 %20 Ca CmgThe%20 Minimum%20 Daily%20 Adult%20 %20 Ca Cmg
The%20 Minimum%20 Daily%20 Adult%20 %20 Ca Cmg
 
Numbers Rule Your World: The Hidden Influence of Probabilities and Statistics...
Numbers Rule Your World: The Hidden Influence of Probabilities and Statistics...Numbers Rule Your World: The Hidden Influence of Probabilities and Statistics...
Numbers Rule Your World: The Hidden Influence of Probabilities and Statistics...
 
Dealing with outliers in Clinical Research
Dealing with outliers in Clinical ResearchDealing with outliers in Clinical Research
Dealing with outliers in Clinical Research
 
Fact, Figures and Statistics
Fact, Figures and StatisticsFact, Figures and Statistics
Fact, Figures and Statistics
 
1.1 statistical and critical thinking
1.1 statistical and critical thinking1.1 statistical and critical thinking
1.1 statistical and critical thinking
 
UNIT 5.pptx
UNIT 5.pptxUNIT 5.pptx
UNIT 5.pptx
 
Non probability sampling
Non  probability samplingNon  probability sampling
Non probability sampling
 
BASIC MATH PROBLEMS IN STATISCTICSS.pptx
BASIC MATH PROBLEMS IN STATISCTICSS.pptxBASIC MATH PROBLEMS IN STATISCTICSS.pptx
BASIC MATH PROBLEMS IN STATISCTICSS.pptx
 
2010 smg training_cardiff_day2_session4_sterne
2010 smg training_cardiff_day2_session4_sterne2010 smg training_cardiff_day2_session4_sterne
2010 smg training_cardiff_day2_session4_sterne
 
The Statistical Mystique
The Statistical MystiqueThe Statistical Mystique
The Statistical Mystique
 
Determining sample size
Determining sample sizeDetermining sample size
Determining sample size
 
Data visualization intro2
Data visualization intro2Data visualization intro2
Data visualization intro2
 
Sampling
SamplingSampling
Sampling
 
Sample size
Sample sizeSample size
Sample size
 
Sampling
SamplingSampling
Sampling
 
Chapter 3 part3-Toward Statistical Inference
Chapter 3 part3-Toward Statistical InferenceChapter 3 part3-Toward Statistical Inference
Chapter 3 part3-Toward Statistical Inference
 
Chapter 3 part2- Sampling Design
Chapter 3 part2- Sampling DesignChapter 3 part2- Sampling Design
Chapter 3 part2- Sampling Design
 
Statistice Chapter 02[1]
Statistice  Chapter 02[1]Statistice  Chapter 02[1]
Statistice Chapter 02[1]
 
Investment Management. Y4. Alexis Finet
Investment Management. Y4. Alexis FinetInvestment Management. Y4. Alexis Finet
Investment Management. Y4. Alexis Finet
 
Sensitivity Analysis
Sensitivity AnalysisSensitivity Analysis
Sensitivity Analysis
 

Recently uploaded

Contemporary philippine arts from the regions_PPT_Module_12 [Autosaved] (1).pptx
Contemporary philippine arts from the regions_PPT_Module_12 [Autosaved] (1).pptxContemporary philippine arts from the regions_PPT_Module_12 [Autosaved] (1).pptx
Contemporary philippine arts from the regions_PPT_Module_12 [Autosaved] (1).pptxRoyAbrique
 
microwave assisted reaction. General introduction
microwave assisted reaction. General introductionmicrowave assisted reaction. General introduction
microwave assisted reaction. General introductionMaksud Ahmed
 
SOCIAL AND HISTORICAL CONTEXT - LFTVD.pptx
SOCIAL AND HISTORICAL CONTEXT - LFTVD.pptxSOCIAL AND HISTORICAL CONTEXT - LFTVD.pptx
SOCIAL AND HISTORICAL CONTEXT - LFTVD.pptxiammrhaywood
 
How to Make a Pirate ship Primary Education.pptx
How to Make a Pirate ship Primary Education.pptxHow to Make a Pirate ship Primary Education.pptx
How to Make a Pirate ship Primary Education.pptxmanuelaromero2013
 
Grant Readiness 101 TechSoup and Remy Consulting
Grant Readiness 101 TechSoup and Remy ConsultingGrant Readiness 101 TechSoup and Remy Consulting
Grant Readiness 101 TechSoup and Remy ConsultingTechSoup
 
Nutritional Needs Presentation - HLTH 104
Nutritional Needs Presentation - HLTH 104Nutritional Needs Presentation - HLTH 104
Nutritional Needs Presentation - HLTH 104misteraugie
 
Organic Name Reactions for the students and aspirants of Chemistry12th.pptx
Organic Name Reactions  for the students and aspirants of Chemistry12th.pptxOrganic Name Reactions  for the students and aspirants of Chemistry12th.pptx
Organic Name Reactions for the students and aspirants of Chemistry12th.pptxVS Mahajan Coaching Centre
 
URLs and Routing in the Odoo 17 Website App
URLs and Routing in the Odoo 17 Website AppURLs and Routing in the Odoo 17 Website App
URLs and Routing in the Odoo 17 Website AppCeline George
 
Activity 01 - Artificial Culture (1).pdf
Activity 01 - Artificial Culture (1).pdfActivity 01 - Artificial Culture (1).pdf
Activity 01 - Artificial Culture (1).pdfciinovamais
 
Sanyam Choudhary Chemistry practical.pdf
Sanyam Choudhary Chemistry practical.pdfSanyam Choudhary Chemistry practical.pdf
Sanyam Choudhary Chemistry practical.pdfsanyamsingh5019
 
Employee wellbeing at the workplace.pptx
Employee wellbeing at the workplace.pptxEmployee wellbeing at the workplace.pptx
Employee wellbeing at the workplace.pptxNirmalaLoungPoorunde1
 
The Most Excellent Way | 1 Corinthians 13
The Most Excellent Way | 1 Corinthians 13The Most Excellent Way | 1 Corinthians 13
The Most Excellent Way | 1 Corinthians 13Steve Thomason
 
mini mental status format.docx
mini    mental       status     format.docxmini    mental       status     format.docx
mini mental status format.docxPoojaSen20
 
Industrial Policy - 1948, 1956, 1973, 1977, 1980, 1991
Industrial Policy - 1948, 1956, 1973, 1977, 1980, 1991Industrial Policy - 1948, 1956, 1973, 1977, 1980, 1991
Industrial Policy - 1948, 1956, 1973, 1977, 1980, 1991RKavithamani
 
A Critique of the Proposed National Education Policy Reform
A Critique of the Proposed National Education Policy ReformA Critique of the Proposed National Education Policy Reform
A Critique of the Proposed National Education Policy ReformChameera Dedduwage
 
Separation of Lanthanides/ Lanthanides and Actinides
Separation of Lanthanides/ Lanthanides and ActinidesSeparation of Lanthanides/ Lanthanides and Actinides
Separation of Lanthanides/ Lanthanides and ActinidesFatimaKhan178732
 
Interactive Powerpoint_How to Master effective communication
Interactive Powerpoint_How to Master effective communicationInteractive Powerpoint_How to Master effective communication
Interactive Powerpoint_How to Master effective communicationnomboosow
 
18-04-UA_REPORT_MEDIALITERAСY_INDEX-DM_23-1-final-eng.pdf
18-04-UA_REPORT_MEDIALITERAСY_INDEX-DM_23-1-final-eng.pdf18-04-UA_REPORT_MEDIALITERAСY_INDEX-DM_23-1-final-eng.pdf
18-04-UA_REPORT_MEDIALITERAСY_INDEX-DM_23-1-final-eng.pdfssuser54595a
 

Recently uploaded (20)

Contemporary philippine arts from the regions_PPT_Module_12 [Autosaved] (1).pptx
Contemporary philippine arts from the regions_PPT_Module_12 [Autosaved] (1).pptxContemporary philippine arts from the regions_PPT_Module_12 [Autosaved] (1).pptx
Contemporary philippine arts from the regions_PPT_Module_12 [Autosaved] (1).pptx
 
microwave assisted reaction. General introduction
microwave assisted reaction. General introductionmicrowave assisted reaction. General introduction
microwave assisted reaction. General introduction
 
SOCIAL AND HISTORICAL CONTEXT - LFTVD.pptx
SOCIAL AND HISTORICAL CONTEXT - LFTVD.pptxSOCIAL AND HISTORICAL CONTEXT - LFTVD.pptx
SOCIAL AND HISTORICAL CONTEXT - LFTVD.pptx
 
How to Make a Pirate ship Primary Education.pptx
How to Make a Pirate ship Primary Education.pptxHow to Make a Pirate ship Primary Education.pptx
How to Make a Pirate ship Primary Education.pptx
 
Grant Readiness 101 TechSoup and Remy Consulting
Grant Readiness 101 TechSoup and Remy ConsultingGrant Readiness 101 TechSoup and Remy Consulting
Grant Readiness 101 TechSoup and Remy Consulting
 
INDIA QUIZ 2024 RLAC DELHI UNIVERSITY.pptx
INDIA QUIZ 2024 RLAC DELHI UNIVERSITY.pptxINDIA QUIZ 2024 RLAC DELHI UNIVERSITY.pptx
INDIA QUIZ 2024 RLAC DELHI UNIVERSITY.pptx
 
Nutritional Needs Presentation - HLTH 104
Nutritional Needs Presentation - HLTH 104Nutritional Needs Presentation - HLTH 104
Nutritional Needs Presentation - HLTH 104
 
Organic Name Reactions for the students and aspirants of Chemistry12th.pptx
Organic Name Reactions  for the students and aspirants of Chemistry12th.pptxOrganic Name Reactions  for the students and aspirants of Chemistry12th.pptx
Organic Name Reactions for the students and aspirants of Chemistry12th.pptx
 
URLs and Routing in the Odoo 17 Website App
URLs and Routing in the Odoo 17 Website AppURLs and Routing in the Odoo 17 Website App
URLs and Routing in the Odoo 17 Website App
 
Activity 01 - Artificial Culture (1).pdf
Activity 01 - Artificial Culture (1).pdfActivity 01 - Artificial Culture (1).pdf
Activity 01 - Artificial Culture (1).pdf
 
Sanyam Choudhary Chemistry practical.pdf
Sanyam Choudhary Chemistry practical.pdfSanyam Choudhary Chemistry practical.pdf
Sanyam Choudhary Chemistry practical.pdf
 
Employee wellbeing at the workplace.pptx
Employee wellbeing at the workplace.pptxEmployee wellbeing at the workplace.pptx
Employee wellbeing at the workplace.pptx
 
The Most Excellent Way | 1 Corinthians 13
The Most Excellent Way | 1 Corinthians 13The Most Excellent Way | 1 Corinthians 13
The Most Excellent Way | 1 Corinthians 13
 
mini mental status format.docx
mini    mental       status     format.docxmini    mental       status     format.docx
mini mental status format.docx
 
Industrial Policy - 1948, 1956, 1973, 1977, 1980, 1991
Industrial Policy - 1948, 1956, 1973, 1977, 1980, 1991Industrial Policy - 1948, 1956, 1973, 1977, 1980, 1991
Industrial Policy - 1948, 1956, 1973, 1977, 1980, 1991
 
A Critique of the Proposed National Education Policy Reform
A Critique of the Proposed National Education Policy ReformA Critique of the Proposed National Education Policy Reform
A Critique of the Proposed National Education Policy Reform
 
Separation of Lanthanides/ Lanthanides and Actinides
Separation of Lanthanides/ Lanthanides and ActinidesSeparation of Lanthanides/ Lanthanides and Actinides
Separation of Lanthanides/ Lanthanides and Actinides
 
Interactive Powerpoint_How to Master effective communication
Interactive Powerpoint_How to Master effective communicationInteractive Powerpoint_How to Master effective communication
Interactive Powerpoint_How to Master effective communication
 
TataKelola dan KamSiber Kecerdasan Buatan v022.pdf
TataKelola dan KamSiber Kecerdasan Buatan v022.pdfTataKelola dan KamSiber Kecerdasan Buatan v022.pdf
TataKelola dan KamSiber Kecerdasan Buatan v022.pdf
 
18-04-UA_REPORT_MEDIALITERAСY_INDEX-DM_23-1-final-eng.pdf
18-04-UA_REPORT_MEDIALITERAСY_INDEX-DM_23-1-final-eng.pdf18-04-UA_REPORT_MEDIALITERAСY_INDEX-DM_23-1-final-eng.pdf
18-04-UA_REPORT_MEDIALITERAСY_INDEX-DM_23-1-final-eng.pdf
 

Outlier Detection and Impact

  • 2. Introduction 1. Who cares? 2. What is an Outlier? 3. How does it impact regression? 4. What causes Outliers? 5. How can we detect them? 6. What to do with Outliers? 7. Recap: Why/when do they matter?
  • 3. Why Market Forecasts Keep Missing the Mark “Fish gotta swim, birds gotta fly and analysts and market strategists gotta try predicting what stocks will do every year. But you don't gotta act on those predictions -- at least not before you ask how likely they are to hit the bullseye.” The Wall Street Journal(2009)1 http://www.wsj.com/news/articles/SB123275782424412007
  • 4. Significant Outliers If you take the daily returns of the Dow from 1900 to 2008 and you subtract the 10 best days, you end up with about 60 percent less money than if you had stayed invested the entire time If you remove the worst 10 days from history, you would have ended up with three times more money.yed invested the entire time.
  • 5. What is an Outlier? data point that is far outside the norm for a variable or population; observation that “deviates so much from other observations as to arouse suspicions that it was generated by a different mechanism”; values that are “dubious in the eyes of the researcher”.
  • 6. How outliers impact ordinary regression Even worse, with multiple regression, an outlier in x-space may not look particularly unusual for any single x-variable. If there's a possibility of such a point, it's potentially a very risky thing to use least squares regression on.
  • 8. Data errors Outliers are often caused by human error, such as errors in data collection, recording, or entry.
  • 9. Intentional or motivated mis-reporting. • Social desirability and self-presentation motives can be powerful • This can also happen for obvious reasons when data are sensitive (e.g., teenagers under-reporting drug or alcohol use, mis- reporting of sexual behavior). http://www.livescience.com/7038-men-report-sex-partners-women.html
  • 10. Sampling error It is possible that a few members of a sample were inadvertently drawn from a different population than the rest of the sample.
  • 11. Standardization failure If something anomalous happened during a particular subject’s experience it will influence the study outcome.
  • 12. Faulty distributional assumptions Incorrect assumptions about the distribution of the data can also lead to the presence of suspected outliers
  • 13. Legitimate cases sampled from the correct population It is possible that an outlier can come from the population being sampled legitimately through random chance. It is important to note that sample size plays a role in the probability of outlying values.
  • 14. Outliers as potential focus of inquiry We don't necessarily need to remove the outliers  sometimes, finding the outliers is the purpose of the study (e.g. fraud identification, immunology advancements1) http://www.medicalnewstoday.com/articles/241705.php
  • 15. Identification of Outliers Simple rules of thumb: Data points three or more standard deviations from the mean Mahalanobis’ distance Cook’s D Cook’s D Mahalanobis’ distance
  • 19. Mahalanobis’ distance That doesn't really look like a circle, does it? That's because this picture is distorted (as evidenced by the different spacings among the numbers on the two axes).
  • 20. Mahalanobis’ distance Let's redraw it with the axes in their proper orientations--left to right and bottom to top--and with a unit aspect ratio so that one unit horizontally really does equal one unit vertically: You measure the Mahalanobis distance as Euclidean distance in this picture rather than in the original.
  • 21. Dealing with Outliers Removal 2,3,4,5,6,10,100  2,3,4,5,6,10,100 Transformations (e.g.: taking the log) 2,3,4,5,6,10,100 0.3, 0.47, 0.6, 0.69, 1 , 2 Trunchiation 2,3,4,5,6,10,100  2,3,4,5,6,10,10
  • 22. Robust Methods – Trimmed mean Is calculated by temporarily eliminating extreme observations at both ends of the sample (between 10%-25% of ends) 1, 6, 12, 14, 20, 24, 36, 100 Regular Mean: 26.62 1, 6, 12, 14, 20, 24, 36, 100 Trimmed Mean: 17.5 More Info
  • 23. Robust Methods – Winsorized mean Highest and lowest observations are temporarily censored, and replaced with adjacent values from the remaining data 1, 6, 12, 14, 20, 24, 36, 100 Regular Mean: 26.62 6, 6, 12, 14, 20, 24, 36, 36 Winsorized Mean: 19.25 More Info
  • 24. Robust Methods – LTS The Least Trimmed Squares (LTS) method attempts to minimize the sum of squared residuals over a subset, k, of those points. The n-k points which are not used do not influence the fit. More Info
  • 25. Robust Methods – LMS The Least Median of Squares (LMS) replaces the mean by the much less sensitive median, witch generates a more robust estimator. 1, 6, 12, 14, 20, 24, 36, 100 Regular Mean: 26.62 Median = (20+14)/2 = 17 More info
  • 26. Recap: Why do they matter? Present false information (data errors, etc.) Create new questions (new clusters, etc.) Ruin predictions (increase error-proneness ) Offer insights (anomalies, examples, etc.) Announce issues (fraud, etc.)
  • 27. Recap: When do they matter? Always! It’s just that sometimes you NEED to have them and sometimes you NEED NOT to have them.
  • 28. Thank you for listening! Hope I didn’t waste your time!
  • 29. References 1. The power of outliers (and why researchers should ALWAYS check for them) – Jason W. Osborne and Amy Overbay, North Carolina State University 2. Best Practices in Quantitative Methods – edited by Jason Osborne 3. Outlier detection using regression – http://stats.stackexchange.com 4. Fast linear regression robust to outliers – http://stats.stackexchange.com 5. Explanation of the Mahalanobis distance – http://stats.stackexchange.com