SlideShare a Scribd company logo
1 of 5
Download to read offline
comScore Releases October 2011 U.S. Online Video Rankings

Record 20 Billion Content Videos Viewed on Google Sites

RESTON, VA, November 28, 2011 – comScore, Inc. (NASDAQ: SCOR), a leader in
measuring the digital world, today released data from the comScore Video Metrix service
showing that 184 million U.S. Internet users watched online video content in October for an
average of 21.1 hours per viewer. The total U.S. Internet audience viewed 42.6 billion videos,
representing an all-time high.

Top 10 Video Content Properties by Unique Viewers

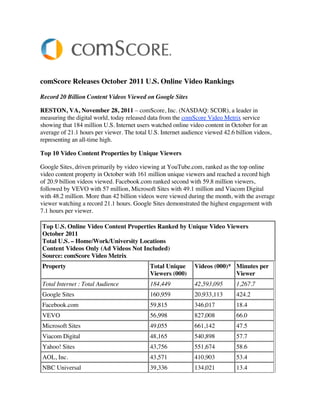
Google Sites, driven primarily by video viewing at YouTube.com, ranked as the top online
video content property in October with 161 million unique viewers and reached a record high
of 20.9 billion videos viewed. Facebook.com ranked second with 59.8 million viewers,
followed by VEVO with 57 million, Microsoft Sites with 49.1 million and Viacom Digital
with 48.2 million. More than 42 billion videos were viewed during the month, with the average
viewer watching a record 21.1 hours. Google Sites demonstrated the highest engagement with
7.1 hours per viewer.

Top U.S. Online Video Content Properties Ranked by Unique Video Viewers
October 2011
Total U.S. – Home/Work/University Locations
Content Videos Only (Ad Videos Not Included)
Source: comScore Video Metrix
Property                                    Total Unique      Videos (000)* Minutes per
                                            Viewers (000)                   Viewer
Total Internet : Total Audience             184,449           42,593,095       1,267.7
Google Sites                                160,959           20,933,113       424.2
Facebook.com                                59,815            346,017          18.4
VEVO                                        56,998            827,008          66.0
Microsoft Sites                             49,055            661,142          47.5
Viacom Digital                              48,165            540,898          57.7
Yahoo! Sites                                43,756            551,674          58.6
AOL, Inc.                                   43,571            410,903          53.4
NBC Universal                               39,336            134,021          13.4
Hulu                                        29,221            791,370          202.2
Turner Digital                              27,979            223,524          33.0
Viacom Digital                                48,165             540,898          57.7
Yahoo! Sites                                  43,756             551,674          58.6
AOL, Inc.                                     43,571             410,903          53.4
NBC Universal                                 39,336             134,021          13.4
Hulu                                          29,221             791,370          202.2
 Turner Digital                              27,979           223,524           33.0
*A video is defined as any streamed segment of audiovisual content, (both progressive
downloads and live streams).
For long-form, segmented content, (e.g. television episodes with ad pods in the middle) each
segment of the
content is counted as a distinct video stream.


This social chart is intended for public use. Click here to see how to include it in an online
article.

Top 10 Video Ad Properties by Video Ads Viewed

Americans viewed 7.5 billion video ads in October, with Hulu generating the highest number
of video ad impressions at more than 1.3 billion. Tremor Video ranked second overall (and
highest among video ad exchanges/networks) crossing the 1 billion mark for the first time.
BrightRoll Video Network ranked third with 756 million, followed by Specific Media with 512
million and CBS Interactive with 415 million. Time spent watching video ads totaled more than
3.2 billion minutes during the month, with Tremor Video delivering the highest duration of
video ads at 614 million minutes. Video ads reached 53 percent of the total U.S. population an
average of 47 times during the month. Hulu delivered the highest frequency of video ads to its
viewers with an average of 46.5.

Top U.S. Online Video Ad Properties Ranked by Video Ads* Viewed
October 2011
Total U.S. – Home/Work/University Locations
Ad Videos Only (Content Videos Not Included)
Source: comScore Video Metrix
Property                          Video Ads      Total Ad      Frequency      % Reach
                                  (000)          Minutes       (Ads per       Total U.S.
                                                 (MM)          Viewer)        Population
Total Internet : Total Audience   7,467,331      3,217         46.9           52.7
Hulu                              1,360,709      557           46.5           9.7
Tremor Video**                    1,095,003      614           17.1           21.2
BrightRoll Video Network**        756,390        466           8.8            28.4
Specific Media**                   512,152        250           6.5            26.1
CBS Interactive                   415,244        162           17.8           7.7
Microsoft Sites                   381,090        146           9.9            12.8
TubeMogul Video Ad                345,099        167           6.8            16.9
Platform**
TidalTV.com**                     325,580        187           6.0            17.9
SpotXchange Video Ad              316,463        190           9.2            11.4
Marketplace**
 Undertone**                      302,073         163           10.1            9.9
Note: Adap.tv has been excluded from this list due to a technological issue with its video
census tags,
affecting data for October 2011.
*Video ads include streaming-video advertising only and do not include other types of video
monetization,
such as overlays, branded players, matching banner ads, homepage ads, etc.
**Indicates video ad network

Top 10 YouTube Partner Channels by Unique Viewers

The October 2011 YouTube partner data revealed that video music channels VEVO (54.2
million viewers) and Warner Music (30.4 million viewers) maintained the top two positions.
Gaming channel Machinima ranked third with 17.7 million viewers, followed by Schmooru
with 9.9 million, Maker Studios with 9.4 million and Demand Media with 7.4 million. Within
the top 10 partners, Machinima demonstrated the highest engagement with 65.1 minutes per
viewer on average, while accounting for the second highest number of videos viewed (277
million) after VEVO.

Top YouTube Partner Channels* Ranked by Unique Video Viewers
October 2011
Total U.S. – Home/Work/University Locations
Content Videos Only (Ad Videos Not Included)
Source: comScore Video Metrix
Property                                    Total Unique      Videos (000)        Minutes
                                            Viewers (000)                         per
                                                                                  Viewer
VEVO @ YouTube                              54,170            799,443             66.1
Warner Music @ Youtube                      30,439            195,589             27.3
Machinima @ YouTube                         17,750            277,330             65.1
Schmooru @ YouTube                          9,860             30,863              14.1
Maker Studios @ YouTube                     9,379             81,229              33.8
Demand Media @ YouTube                      7,372             20,847              9.6
FullScreen @ YouTube                        7,219             27,313              14.8
Warner Bros (The Ellen Show) @              7,045             19,889              12.5
YouTube
IGN @ YouTube                               6,387             25,378              16.1
 BigFrame @ YouTube                      5,793             27,816              18.2
*YouTube Partner Reporting based on online video content viewing and does not include
claimed user-generated content

Other notable findings from October 2011 include:

  •     86.2 percent of the U.S. Internet audience viewed online video.
  •     The duration of the average online content video was 5.5 minutes, while the average
        online video ad was 0.4 minutes.
  •     Video ads accounted for 14.9 percent of all videos viewed and 1.4 percent of all
        minutes spent viewing video online.
About comScore
comScore, Inc. (NASDAQ: SCOR) is a global leader in measuring the digital world and
preferred source of digital business analytics. For more information, please visit
www.comscore.com/companyinfo.
Comscore Video October 2011

More Related Content

More from Alcance Media Group

Advertisers Media Kit - International
Advertisers Media Kit - InternationalAdvertisers Media Kit - International
Advertisers Media Kit - InternationalAlcance Media Group
 
Kit de Medios - Hispanos de EE.UU.
Kit de Medios - Hispanos de EE.UU.Kit de Medios - Hispanos de EE.UU.
Kit de Medios - Hispanos de EE.UU.Alcance Media Group
 
Cicom reporte2012 ordenfinal vahuerta (1)
Cicom reporte2012 ordenfinal vahuerta (1)Cicom reporte2012 ordenfinal vahuerta (1)
Cicom reporte2012 ordenfinal vahuerta (1)Alcance Media Group
 
Habitos de los Usuarios de Internet en México 2013
Habitos de los Usuarios de Internet en México 2013Habitos de los Usuarios de Internet en México 2013
Habitos de los Usuarios de Internet en México 2013Alcance Media Group
 
On the Rise: The Growing Influence of the Hispanic Shopper
On the Rise: The Growing Influence of the Hispanic ShopperOn the Rise: The Growing Influence of the Hispanic Shopper
On the Rise: The Growing Influence of the Hispanic ShopperAlcance Media Group
 
Advertisers Media Kit - Internacional
Advertisers Media Kit - InternacionalAdvertisers Media Kit - Internacional
Advertisers Media Kit - InternacionalAlcance Media Group
 
Onesheets Advertising Solutions 2011 espanol
Onesheets Advertising Solutions 2011 espanolOnesheets Advertising Solutions 2011 espanol
Onesheets Advertising Solutions 2011 espanolAlcance Media Group
 

More from Alcance Media Group (20)

Kit de Medio para Editores
Kit de Medio para EditoresKit de Medio para Editores
Kit de Medio para Editores
 
Media Kit for Publishers
Media Kit for PublishersMedia Kit for Publishers
Media Kit for Publishers
 
Advertisers Media Kit - International
Advertisers Media Kit - InternationalAdvertisers Media Kit - International
Advertisers Media Kit - International
 
Kit de Medios - Hispanos de EE.UU.
Kit de Medios - Hispanos de EE.UU.Kit de Medios - Hispanos de EE.UU.
Kit de Medios - Hispanos de EE.UU.
 
Hispanic 101- English
Hispanic 101- EnglishHispanic 101- English
Hispanic 101- English
 
IAB Interactive Outlook
IAB Interactive OutlookIAB Interactive Outlook
IAB Interactive Outlook
 
Cicom reporte2012 ordenfinal vahuerta (1)
Cicom reporte2012 ordenfinal vahuerta (1)Cicom reporte2012 ordenfinal vahuerta (1)
Cicom reporte2012 ordenfinal vahuerta (1)
 
El ABC de Online Video
El ABC de Online VideoEl ABC de Online Video
El ABC de Online Video
 
Habitos de los Usuarios de Internet en México 2013
Habitos de los Usuarios de Internet en México 2013Habitos de los Usuarios de Internet en México 2013
Habitos de los Usuarios de Internet en México 2013
 
Hispanic market-overview-2013
Hispanic market-overview-2013Hispanic market-overview-2013
Hispanic market-overview-2013
 
On the Rise: The Growing Influence of the Hispanic Shopper
On the Rise: The Growing Influence of the Hispanic ShopperOn the Rise: The Growing Influence of the Hispanic Shopper
On the Rise: The Growing Influence of the Hispanic Shopper
 
State of Spanish Language Media
State of Spanish Language MediaState of Spanish Language Media
State of Spanish Language Media
 
Adobe Marketing Cloud
Adobe Marketing CloudAdobe Marketing Cloud
Adobe Marketing Cloud
 
Facebook Ad Report 2012
Facebook Ad Report 2012Facebook Ad Report 2012
Facebook Ad Report 2012
 
Center for Hispanic Leadership
Center for Hispanic LeadershipCenter for Hispanic Leadership
Center for Hispanic Leadership
 
Engage Pinterest
Engage PinterestEngage Pinterest
Engage Pinterest
 
Advertisers Media Kit - Internacional
Advertisers Media Kit - InternacionalAdvertisers Media Kit - Internacional
Advertisers Media Kit - Internacional
 
Hispanic Market Overview 2012
Hispanic Market Overview 2012Hispanic Market Overview 2012
Hispanic Market Overview 2012
 
State of the internet 2012
State of the internet 2012State of the internet 2012
State of the internet 2012
 
Onesheets Advertising Solutions 2011 espanol
Onesheets Advertising Solutions 2011 espanolOnesheets Advertising Solutions 2011 espanol
Onesheets Advertising Solutions 2011 espanol
 

Recently uploaded

Powerful Google developer tools for immediate impact! (2023-24 C)
Powerful Google developer tools for immediate impact! (2023-24 C)Powerful Google developer tools for immediate impact! (2023-24 C)
Powerful Google developer tools for immediate impact! (2023-24 C)wesley chun
 
A Call to Action for Generative AI in 2024
A Call to Action for Generative AI in 2024A Call to Action for Generative AI in 2024
A Call to Action for Generative AI in 2024Results
 
Driving Behavioral Change for Information Management through Data-Driven Gree...
Driving Behavioral Change for Information Management through Data-Driven Gree...Driving Behavioral Change for Information Management through Data-Driven Gree...
Driving Behavioral Change for Information Management through Data-Driven Gree...Enterprise Knowledge
 
Raspberry Pi 5: Challenges and Solutions in Bringing up an OpenGL/Vulkan Driv...
Raspberry Pi 5: Challenges and Solutions in Bringing up an OpenGL/Vulkan Driv...Raspberry Pi 5: Challenges and Solutions in Bringing up an OpenGL/Vulkan Driv...
Raspberry Pi 5: Challenges and Solutions in Bringing up an OpenGL/Vulkan Driv...Igalia
 
EIS-Webinar-Prompt-Knowledge-Eng-2024-04-08.pptx
EIS-Webinar-Prompt-Knowledge-Eng-2024-04-08.pptxEIS-Webinar-Prompt-Knowledge-Eng-2024-04-08.pptx
EIS-Webinar-Prompt-Knowledge-Eng-2024-04-08.pptxEarley Information Science
 
Artificial Intelligence: Facts and Myths
Artificial Intelligence: Facts and MythsArtificial Intelligence: Facts and Myths
Artificial Intelligence: Facts and MythsJoaquim Jorge
 
How to convert PDF to text with Nanonets
How to convert PDF to text with NanonetsHow to convert PDF to text with Nanonets
How to convert PDF to text with Nanonetsnaman860154
 
Data Cloud, More than a CDP by Matt Robison
Data Cloud, More than a CDP by Matt RobisonData Cloud, More than a CDP by Matt Robison
Data Cloud, More than a CDP by Matt RobisonAnna Loughnan Colquhoun
 
What Are The Drone Anti-jamming Systems Technology?
What Are The Drone Anti-jamming Systems Technology?What Are The Drone Anti-jamming Systems Technology?
What Are The Drone Anti-jamming Systems Technology?Antenna Manufacturer Coco
 
The 7 Things I Know About Cyber Security After 25 Years | April 2024
The 7 Things I Know About Cyber Security After 25 Years | April 2024The 7 Things I Know About Cyber Security After 25 Years | April 2024
The 7 Things I Know About Cyber Security After 25 Years | April 2024Rafal Los
 
Bajaj Allianz Life Insurance Company - Insurer Innovation Award 2024
Bajaj Allianz Life Insurance Company - Insurer Innovation Award 2024Bajaj Allianz Life Insurance Company - Insurer Innovation Award 2024
Bajaj Allianz Life Insurance Company - Insurer Innovation Award 2024The Digital Insurer
 
The Role of Taxonomy and Ontology in Semantic Layers - Heather Hedden.pdf
The Role of Taxonomy and Ontology in Semantic Layers - Heather Hedden.pdfThe Role of Taxonomy and Ontology in Semantic Layers - Heather Hedden.pdf
The Role of Taxonomy and Ontology in Semantic Layers - Heather Hedden.pdfEnterprise Knowledge
 
Workshop - Best of Both Worlds_ Combine KG and Vector search for enhanced R...
Workshop - Best of Both Worlds_ Combine  KG and Vector search for  enhanced R...Workshop - Best of Both Worlds_ Combine  KG and Vector search for  enhanced R...
Workshop - Best of Both Worlds_ Combine KG and Vector search for enhanced R...Neo4j
 
How to Troubleshoot Apps for the Modern Connected Worker
How to Troubleshoot Apps for the Modern Connected WorkerHow to Troubleshoot Apps for the Modern Connected Worker
How to Troubleshoot Apps for the Modern Connected WorkerThousandEyes
 
Slack Application Development 101 Slides
Slack Application Development 101 SlidesSlack Application Development 101 Slides
Slack Application Development 101 Slidespraypatel2
 
Advantages of Hiring UIUX Design Service Providers for Your Business
Advantages of Hiring UIUX Design Service Providers for Your BusinessAdvantages of Hiring UIUX Design Service Providers for Your Business
Advantages of Hiring UIUX Design Service Providers for Your BusinessPixlogix Infotech
 
2024: Domino Containers - The Next Step. News from the Domino Container commu...
2024: Domino Containers - The Next Step. News from the Domino Container commu...2024: Domino Containers - The Next Step. News from the Domino Container commu...
2024: Domino Containers - The Next Step. News from the Domino Container commu...Martijn de Jong
 
🐬 The future of MySQL is Postgres 🐘
🐬  The future of MySQL is Postgres   🐘🐬  The future of MySQL is Postgres   🐘
🐬 The future of MySQL is Postgres 🐘RTylerCroy
 
Histor y of HAM Radio presentation slide
Histor y of HAM Radio presentation slideHistor y of HAM Radio presentation slide
Histor y of HAM Radio presentation slidevu2urc
 
CNv6 Instructor Chapter 6 Quality of Service
CNv6 Instructor Chapter 6 Quality of ServiceCNv6 Instructor Chapter 6 Quality of Service
CNv6 Instructor Chapter 6 Quality of Servicegiselly40
 

Recently uploaded (20)

Powerful Google developer tools for immediate impact! (2023-24 C)
Powerful Google developer tools for immediate impact! (2023-24 C)Powerful Google developer tools for immediate impact! (2023-24 C)
Powerful Google developer tools for immediate impact! (2023-24 C)
 
A Call to Action for Generative AI in 2024
A Call to Action for Generative AI in 2024A Call to Action for Generative AI in 2024
A Call to Action for Generative AI in 2024
 
Driving Behavioral Change for Information Management through Data-Driven Gree...
Driving Behavioral Change for Information Management through Data-Driven Gree...Driving Behavioral Change for Information Management through Data-Driven Gree...
Driving Behavioral Change for Information Management through Data-Driven Gree...
 
Raspberry Pi 5: Challenges and Solutions in Bringing up an OpenGL/Vulkan Driv...
Raspberry Pi 5: Challenges and Solutions in Bringing up an OpenGL/Vulkan Driv...Raspberry Pi 5: Challenges and Solutions in Bringing up an OpenGL/Vulkan Driv...
Raspberry Pi 5: Challenges and Solutions in Bringing up an OpenGL/Vulkan Driv...
 
EIS-Webinar-Prompt-Knowledge-Eng-2024-04-08.pptx
EIS-Webinar-Prompt-Knowledge-Eng-2024-04-08.pptxEIS-Webinar-Prompt-Knowledge-Eng-2024-04-08.pptx
EIS-Webinar-Prompt-Knowledge-Eng-2024-04-08.pptx
 
Artificial Intelligence: Facts and Myths
Artificial Intelligence: Facts and MythsArtificial Intelligence: Facts and Myths
Artificial Intelligence: Facts and Myths
 
How to convert PDF to text with Nanonets
How to convert PDF to text with NanonetsHow to convert PDF to text with Nanonets
How to convert PDF to text with Nanonets
 
Data Cloud, More than a CDP by Matt Robison
Data Cloud, More than a CDP by Matt RobisonData Cloud, More than a CDP by Matt Robison
Data Cloud, More than a CDP by Matt Robison
 
What Are The Drone Anti-jamming Systems Technology?
What Are The Drone Anti-jamming Systems Technology?What Are The Drone Anti-jamming Systems Technology?
What Are The Drone Anti-jamming Systems Technology?
 
The 7 Things I Know About Cyber Security After 25 Years | April 2024
The 7 Things I Know About Cyber Security After 25 Years | April 2024The 7 Things I Know About Cyber Security After 25 Years | April 2024
The 7 Things I Know About Cyber Security After 25 Years | April 2024
 
Bajaj Allianz Life Insurance Company - Insurer Innovation Award 2024
Bajaj Allianz Life Insurance Company - Insurer Innovation Award 2024Bajaj Allianz Life Insurance Company - Insurer Innovation Award 2024
Bajaj Allianz Life Insurance Company - Insurer Innovation Award 2024
 
The Role of Taxonomy and Ontology in Semantic Layers - Heather Hedden.pdf
The Role of Taxonomy and Ontology in Semantic Layers - Heather Hedden.pdfThe Role of Taxonomy and Ontology in Semantic Layers - Heather Hedden.pdf
The Role of Taxonomy and Ontology in Semantic Layers - Heather Hedden.pdf
 
Workshop - Best of Both Worlds_ Combine KG and Vector search for enhanced R...
Workshop - Best of Both Worlds_ Combine  KG and Vector search for  enhanced R...Workshop - Best of Both Worlds_ Combine  KG and Vector search for  enhanced R...
Workshop - Best of Both Worlds_ Combine KG and Vector search for enhanced R...
 
How to Troubleshoot Apps for the Modern Connected Worker
How to Troubleshoot Apps for the Modern Connected WorkerHow to Troubleshoot Apps for the Modern Connected Worker
How to Troubleshoot Apps for the Modern Connected Worker
 
Slack Application Development 101 Slides
Slack Application Development 101 SlidesSlack Application Development 101 Slides
Slack Application Development 101 Slides
 
Advantages of Hiring UIUX Design Service Providers for Your Business
Advantages of Hiring UIUX Design Service Providers for Your BusinessAdvantages of Hiring UIUX Design Service Providers for Your Business
Advantages of Hiring UIUX Design Service Providers for Your Business
 
2024: Domino Containers - The Next Step. News from the Domino Container commu...
2024: Domino Containers - The Next Step. News from the Domino Container commu...2024: Domino Containers - The Next Step. News from the Domino Container commu...
2024: Domino Containers - The Next Step. News from the Domino Container commu...
 
🐬 The future of MySQL is Postgres 🐘
🐬  The future of MySQL is Postgres   🐘🐬  The future of MySQL is Postgres   🐘
🐬 The future of MySQL is Postgres 🐘
 
Histor y of HAM Radio presentation slide
Histor y of HAM Radio presentation slideHistor y of HAM Radio presentation slide
Histor y of HAM Radio presentation slide
 
CNv6 Instructor Chapter 6 Quality of Service
CNv6 Instructor Chapter 6 Quality of ServiceCNv6 Instructor Chapter 6 Quality of Service
CNv6 Instructor Chapter 6 Quality of Service
 

Comscore Video October 2011

  • 1. comScore Releases October 2011 U.S. Online Video Rankings Record 20 Billion Content Videos Viewed on Google Sites RESTON, VA, November 28, 2011 – comScore, Inc. (NASDAQ: SCOR), a leader in measuring the digital world, today released data from the comScore Video Metrix service showing that 184 million U.S. Internet users watched online video content in October for an average of 21.1 hours per viewer. The total U.S. Internet audience viewed 42.6 billion videos, representing an all-time high. Top 10 Video Content Properties by Unique Viewers Google Sites, driven primarily by video viewing at YouTube.com, ranked as the top online video content property in October with 161 million unique viewers and reached a record high of 20.9 billion videos viewed. Facebook.com ranked second with 59.8 million viewers, followed by VEVO with 57 million, Microsoft Sites with 49.1 million and Viacom Digital with 48.2 million. More than 42 billion videos were viewed during the month, with the average viewer watching a record 21.1 hours. Google Sites demonstrated the highest engagement with 7.1 hours per viewer. Top U.S. Online Video Content Properties Ranked by Unique Video Viewers October 2011 Total U.S. – Home/Work/University Locations Content Videos Only (Ad Videos Not Included) Source: comScore Video Metrix Property Total Unique Videos (000)* Minutes per Viewers (000) Viewer Total Internet : Total Audience 184,449 42,593,095 1,267.7 Google Sites 160,959 20,933,113 424.2 Facebook.com 59,815 346,017 18.4 VEVO 56,998 827,008 66.0 Microsoft Sites 49,055 661,142 47.5 Viacom Digital 48,165 540,898 57.7 Yahoo! Sites 43,756 551,674 58.6 AOL, Inc. 43,571 410,903 53.4 NBC Universal 39,336 134,021 13.4 Hulu 29,221 791,370 202.2 Turner Digital 27,979 223,524 33.0
  • 2. Viacom Digital 48,165 540,898 57.7 Yahoo! Sites 43,756 551,674 58.6 AOL, Inc. 43,571 410,903 53.4 NBC Universal 39,336 134,021 13.4 Hulu 29,221 791,370 202.2 Turner Digital 27,979 223,524 33.0 *A video is defined as any streamed segment of audiovisual content, (both progressive downloads and live streams). For long-form, segmented content, (e.g. television episodes with ad pods in the middle) each segment of the content is counted as a distinct video stream. This social chart is intended for public use. Click here to see how to include it in an online article. Top 10 Video Ad Properties by Video Ads Viewed Americans viewed 7.5 billion video ads in October, with Hulu generating the highest number
  • 3. of video ad impressions at more than 1.3 billion. Tremor Video ranked second overall (and highest among video ad exchanges/networks) crossing the 1 billion mark for the first time. BrightRoll Video Network ranked third with 756 million, followed by Specific Media with 512 million and CBS Interactive with 415 million. Time spent watching video ads totaled more than 3.2 billion minutes during the month, with Tremor Video delivering the highest duration of video ads at 614 million minutes. Video ads reached 53 percent of the total U.S. population an average of 47 times during the month. Hulu delivered the highest frequency of video ads to its viewers with an average of 46.5. Top U.S. Online Video Ad Properties Ranked by Video Ads* Viewed October 2011 Total U.S. – Home/Work/University Locations Ad Videos Only (Content Videos Not Included) Source: comScore Video Metrix Property Video Ads Total Ad Frequency % Reach (000) Minutes (Ads per Total U.S. (MM) Viewer) Population Total Internet : Total Audience 7,467,331 3,217 46.9 52.7 Hulu 1,360,709 557 46.5 9.7 Tremor Video** 1,095,003 614 17.1 21.2 BrightRoll Video Network** 756,390 466 8.8 28.4 Specific Media** 512,152 250 6.5 26.1 CBS Interactive 415,244 162 17.8 7.7 Microsoft Sites 381,090 146 9.9 12.8 TubeMogul Video Ad 345,099 167 6.8 16.9 Platform** TidalTV.com** 325,580 187 6.0 17.9 SpotXchange Video Ad 316,463 190 9.2 11.4 Marketplace** Undertone** 302,073 163 10.1 9.9 Note: Adap.tv has been excluded from this list due to a technological issue with its video census tags, affecting data for October 2011. *Video ads include streaming-video advertising only and do not include other types of video monetization, such as overlays, branded players, matching banner ads, homepage ads, etc. **Indicates video ad network Top 10 YouTube Partner Channels by Unique Viewers The October 2011 YouTube partner data revealed that video music channels VEVO (54.2
  • 4. million viewers) and Warner Music (30.4 million viewers) maintained the top two positions. Gaming channel Machinima ranked third with 17.7 million viewers, followed by Schmooru with 9.9 million, Maker Studios with 9.4 million and Demand Media with 7.4 million. Within the top 10 partners, Machinima demonstrated the highest engagement with 65.1 minutes per viewer on average, while accounting for the second highest number of videos viewed (277 million) after VEVO. Top YouTube Partner Channels* Ranked by Unique Video Viewers October 2011 Total U.S. – Home/Work/University Locations Content Videos Only (Ad Videos Not Included) Source: comScore Video Metrix Property Total Unique Videos (000) Minutes Viewers (000) per Viewer VEVO @ YouTube 54,170 799,443 66.1 Warner Music @ Youtube 30,439 195,589 27.3 Machinima @ YouTube 17,750 277,330 65.1 Schmooru @ YouTube 9,860 30,863 14.1 Maker Studios @ YouTube 9,379 81,229 33.8 Demand Media @ YouTube 7,372 20,847 9.6 FullScreen @ YouTube 7,219 27,313 14.8 Warner Bros (The Ellen Show) @ 7,045 19,889 12.5 YouTube IGN @ YouTube 6,387 25,378 16.1 BigFrame @ YouTube 5,793 27,816 18.2 *YouTube Partner Reporting based on online video content viewing and does not include claimed user-generated content Other notable findings from October 2011 include: • 86.2 percent of the U.S. Internet audience viewed online video. • The duration of the average online content video was 5.5 minutes, while the average online video ad was 0.4 minutes. • Video ads accounted for 14.9 percent of all videos viewed and 1.4 percent of all minutes spent viewing video online. About comScore comScore, Inc. (NASDAQ: SCOR) is a global leader in measuring the digital world and preferred source of digital business analytics. For more information, please visit www.comscore.com/companyinfo.