Ireland – 2019 And 2020 Compared In Data
•
0 gostou•379 visualizações

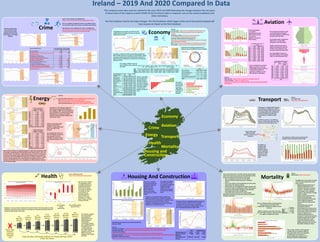
This analysis compares some data areas - Economy, Crime, Aviation, Energy, Transport, Health, Mortality. Housing and Construction - for Ireland for the years 2019 and 2020, illustrating the changes that have occurred between the two years. It shows some of the impacts of COVID-19 and of actions taken in response to it, such as the various lockdowns and other restrictions. The first lockdown clearly had major changes on many aspects of Irish society. The third lockdown which began at the end of the period analysed will have as great an impact as the first lockdown. The consequences of the events and actions that have causes these impacts could be felt for some time into the future.
Recomendados

Recomendados
Mais conteúdo relacionado
Mais procurados
Mais procurados (20)
Semelhante a Ireland – 2019 And 2020 Compared In Data
Semelhante a Ireland – 2019 And 2020 Compared In Data (20)
Mais de Alan McSweeney
Mais de Alan McSweeney (20)
Último
Último (20)
Ireland – 2019 And 2020 Compared In Data
- 1. Crime Crime Classification Group Percentage Change from 2019 to 2020 Number Change from 2019 to 2020 01 Homicide Offences 2.78% 2 02 Sexual Offences -7.55% -244 03 Attempts Or Threats To Murder, Assaults, Harassments And Related Offences -2.97% -609 04 Dangerous Or Negligent Acts -0.14% -12 05 Kidnapping And Related Offences 1.47% 2 06 Robbery, Extortion And Hijacking Offences -15.02% -363 07 Burglary And Related Offences -21.44% -3,595 08 Theft And Related Offences -15.92% -10,741 09 Fraud, Deception And Related Offences 14.49% 991 10 Controlled Drug Offences 17.63% 3,394 11 Weapons And Explosives Offences 21.84% 544 12 Damage To Property And To The Environment -7.21% -1,567 13 Public Order And Other Social Code Offences -6.84% -2,227 15 Offences Against Government, Justice Procedures And Organisation Of Crime -22.72% -3,532 Overall recorded crimes have reduced by 8.25% and increased recorded detection of crimes made more visible such as drugs offences. Crime Source: Crime statistics are available from https://www.cso.ie/en/statistics/crimeandjustice/archive/ They are available annualised by quarter up to 2020 Q3. There are reservations about the accuracy of recorded crime statistics. More details on the classification of crimes is available from https://www.cso.ie/en/media/csoie/releasespublications/docu ments/crimejustice/current/crimeclassification.pdf Aviation Aviation `` Economy Economy r Energy Transport Health Housing And Construction Mortality Energy Transport Health Housing and Construction Mortality Change In Fuel Imports Between 2019 and 2020 Diesel Petrol Jan -5.53% -0.42% Feb -1.40% 3.43% Mar -21.83% -10.05% Apr -72.31% -54.56% May -49.36% -39.42% Jun -33.26% -17.04% Jul -15.03% -5.58% Aug -15.22% -8.23% Sep -10.79% -2.69% Oct -29.26% -13.51% Nov -37.67% -16.75% Overall -22.10% -32.85% Fuel Data Not Available For Dec 2020 Change In Fuel Imports Between 2019 and 2020 Bio LPG Kerosene Jan 7.65% -5.64% Feb 3.49% 37.12% Mar 46.54% 85.33% Apr -42.69% 71.98% May -48.88% 142.23% Jun 51.04% 6.09% Jul 84.40% 41.26% Aug 68.06% -35.58% Sep 51.71% -36.02% Oct 79.55% -3.15% Nov 59.01% -14.36% Overall 19.61% 1.76% Fuel Data Not Available For Dec 2020 Diesel and petrol imports are significantly down in 2020 when compared to 2019. For example, comparing April 2019 and 2020, Diesel imports fell by 72.31% and Petrol by 54.56%. This indicates a significant decrease in all forms of private and commercial road vehicle usage. Imports of home heating fuels such as Bio LPG and Kerosene increased significantly indicating more people working or staying at home and heating their homes. Assuming that all imported fuels are used, emissions of CO2 from these sources dropped by 10.35% between the intervals Jan-Nov 2019 and 2020. The pattern of increasing gas usage from 2017 has been reversed. Gas utilisation is down slightly in 2020. This can be explained by any reduction in commercial office usage being offset by increased use of gas for domestic heating by people staying at and working from home. Patterns of electricity usage changed during the first lockdown. Usage peaked more than a hour later in the morning. This changed after the end of the first lockdown and has not been repeated. The third lockdown, not shown in here, may repeat the pattern of the first. Sources: Electricity System Demand: http://smartgriddashboard.eirgrid.com/ Gas: https://www.gasnetworks.ie/corporate/gas- regulation/transparency-and-publicat/dashboard-reporting/ Petrol and Diesel Imports: https://www.nora.ie/statistics.312.html Total Flights Across All Three Airports 2019 2019Change Jan 19,402 18,801 -3.10% Feb 17,996 18,026 0.17% Mar 20,752 14,479 -30.23% Apr 22,984 2,226 -90.32% May 25,162 2,399 -90.47% June 25,436 2,716 -89.32% July 26,602 7,455 -71.98% Aug 26,501 9,243 -65.12% Sept 25,196 7,664 -69.58% Oct 23,924 6,128 -74.39% Nov 19,084 3,919 -79.46% Dec 19,515 4,196 -78.50% Total 274,573 99,272 -63.84% Change Between 2019 and 2020 Flights People (Thousands) Average People Per Flights Jan -3.10% 1.48% 4.73% Feb 0.17% 2.28% 2.11% Mar -30.23% -57.52% -39.12% Apr -90.32% -99.23% -92.01% May -90.47% -98.71% -86.46% June -89.32% -97.52% -76.74% July -71.98% -89.39% -62.13% Aug -65.12% -85.33% -57.93% Sept -69.58% -87.86% -60.09% Oct -74.39% -91.34% -66.21% Nov -79.46% -93.19% -66.83% Dec No Tourism Data Available for Dec 2020 Sources: Flight Statistics - https://www.iaa.ie/who-we-are/flight-statistics Tourism Statistics - ASM01 Air and Sea Travel https://ws.cso.ie/public/api.restful/PxStat.Data.Cube_API.ReadDataset/ASM01/ XLSX/2007/en Inward and outward air travel fell dramatically from April 2020 onwards and has not seen any significant recovery to 2019 numbers. The movement of people into and out of Ireland almost stopped in April 2020, falling by over 99% when compared with April 2019. The average number of people per flight fell to 11 in April 2020, compared to 140 in April 2019. Despite a small increase in July, August and September 2020, the number of air travellers has not increased substantially April 2020. The average flight occupancy in November 2020 was 45 compared with over 130 in November 2019. Billions Debt Composition 2020 2019 Change Government Bonds 136.8 130.1 5.16% EU and UK Bilateral Loans 41.4 43.3 -4.40% State Savings Products 18.8 17.8 5.78% Short Term Paper 14.0 10.0 40.28% Other Medium and Long Term Debt 4.1 2.6 57.56% Borrowing from Ministerial Funds 4.3 3.0 44.20% TOTAL 219.5 206.8 6.13% Unemployment increased by over 66% since the middle of the first lockdown and has not reduced significantly since then. Government borrowing increased by €12.7 billion by the end of 2020 from the end of 2019. Credit and Debit Card Spending Category Jan-Nov 2019 Jan-Nov 2020 Change Transport 4,305,905 1,999,097 -53.57% Accommodation 2,452,974 1,318,723 -46.24% Outside Ireland 7,115,575 4,569,511 -35.78% ATM Withdrawals 17,888,583 12,026,606 -32.77% Restaurants/Dining 3,325,908 2,595,054 -21.97% Entertainment 1,723,707 1,541,634 -10.56% Clothing 2,642,842 2,528,263 -4.34% Health 1,219,494 1,265,970 3.81% Education 705,706 740,497 4.93% Professional Services 2,763,483 2,931,889 6.09% Other 8,269,395 9,576,719 15.81% E-Commerce 19,861,449 23,096,965 16.29% Hardware 3,198,365 3,832,080 19.81% Electrical Goods 1,246,613 1,581,136 26.83% Groceries/Perishables 9,748,272 12,601,003 29.26% Utilities 1,998,491 2,635,687 31.88% Total 88,466,762 84,840,834 -4.10% The pattern of debit and credit card spending changed from 2019 to 2020. Payments on transport, accommodation, dining and usage outside Ireland all fell substantially. Payments on utilities increased indicating the increased home working and heating of homes. The pattern of increasing GNP has been reversed in 2020. GNP in Q3 2020 is 4% lower than Q3 2019. Sources: Card Spending - https://www.centralbank.ie/statistics/data-and- analysis/credit-and-banking-statistics/credit-and-debit-card- statistics Composition of Debt - https://www.ntma.ie/business- areas/funding-and-debt-management/statistics Seasonally Adjusted Monthly Unemployment - https://ws.cso.ie/public/api.restful/PxStat.Data.Cube_API.ReadDa taset/MUM01/XLSX/2007/en GNP - https://www.cso.ie/en/statistics/nationalaccounts/archive/ Tax Receipts - http://databank.finance.gov.ie/FinDataBank.aspx 3-6 Months Queue 0-3 Months Queue 6-9 Months Queue 12-15 Months Queue 9-12 Months Queue 15-18 Months Queue 18+ Months Queue Source: Waiting List Data - https://data.ehealthireland.ie/group/ntpf Reductions in the size of lower waiting list time bands indicates that fewer people are being admitted to waiting lists because they are not being seen and people not being treated are moving to longer duration time bands. Fewer New Patients Entering Waiting Lists The total “queue months” – the aggregate number of months all patients on waiting lists (assuming those in the 0-3 queue are waiting an average of 1.5 months, etc.) has increased from an estimated 8,524,071 queue months to an estimated 11,172,681 queue months, an overall increase of 31.07%. This indicates a double – few newer patients being added and existing patients not being treated and waiting longer – accumulation of latent and, unfulfilled demand for health services, created by deferring non-COVID-related treatments, that may be difficult to process, leading to worse health outcomes. Residential property prices have not been significantly affected in 2020. There was a reduction in planning permissions granted for residential properties in the second quarter of 2020. In the third quarter, the number increased to pre-COVID levels. The number of building commencement notes for residential properties dropped during the period of the first lockdown and have not increased to pre-COVID levels. The total number of residential property transactions in 2020 was 47,750, 18.78% less than the 58,791 recorded in 2019. The total value of residential transactions in 2020 was €14,983,429,488, 17% less than the €18,052,264,585 recorded in 2019. Reduction in residential building and planning activity, combined with no reduction in property prices and a short and temporary reduction in sales transactions would tend to indicate a future shortage of residential properties with continuing demand and no reduction in prices. Sources: Property Price Register - https://propertypriceregister.ie/Website/NPSRA/pprweb.nsf/page/ppr-home-en Mortgage Approvals - https://bpfi.ie/publications/bpfi-mortgage-approvals-report-december-2020/ Commencement Notices - https://ws.cso.ie/public/api.restful/PxStat.Data.Cube_API.ReadDataset/HSM13/XLSX/2007/en Planning Permissions - https://ws.cso.ie/public/api.restful/PxStat.Data.Cube_API.ReadDataset/BHQ05/XLSX/2007/en Residential Property Price Index - https://ws.cso.ie/public/api.restful/PxStat.Data.Cube_API.ReadDataset/HPM09/XLSX/2007/en Ireland – 2019 And 2020 Compared In Data Customs Excise Duty Capital Gains Tax Capital Acquisitions Tax Stamp Duties Income Tax Corporation Tax Valued Added Tax Motor Vehicle Duties Total 2019 348.51 5,940.37 1,075.06 532.98 1,514.91 22,934.49 10,887.57 15,117.60 962.10 59,315.61 2020 275.65 5,447.81 951.32 493.82 2,089.94 22,710.83 11,832.77 12,423.56 939.23 57,166.94 Change -72.86 -492.56 -123.74 -39.17 575.03 -223.66 945.20 -2,694.05 -22.87 -2,148.68 Change % -20.91% -8.29% -11.51% -7.35% 37.96% -0.98% 8.68% -17.82% -2.38% -3.62% Tax receipts in 2020 are down by over two billion when compared with 2019. Sample Traffic Data Taken From M50 Between Junction 7 and Junction 9 The pattern of weekday traffic volumes if very different in 2020 than in 2019. In 2019, the weekday traffic volumes show a consistent pattern with well-defined morning and afternoon peaks and hourly volumes in 8,000 to 12,000 range. In 2020, the pattern in very different. There are many weeks when the traffic volumes are less than 5,00 per hour.. The pattern of weekday traffic during the first lockdown interval shows a significant reduction in traffic volumes over the similar interval in 2019. The reduction in traffic volumes during the first lockdown interval is between 35% and 70%. This uses data from RIP.ie. The RIP.ie web site contains death notices from which more recent and more detailed mortality data can be inferred. But the data has many issues: • There are duplicate notices for the same death. • There are notices for deaths that occur in Northern Ireland. • There are for deaths of Irish people that occurred outside Ireland other than Northern Ireland. • Death notices are not published for foreign nationals who have died in Ireland, including both visitors and temporary workers but whose deaths will appear in the CSO data. • Some deaths will not have a death notice. • Some death notices will not have a date of death. RIP.ie data is used because of the poor quality of published mortality information. Source: NTR Traffic Data: https://www.nratrafficdata.ie/ The differences in the number of deaths in the two years will be due to many factors such as: • Reduced expected deaths due to lockdown-related factors and associated reduction of economic activities – road traffic and other travel-related, crime, workplace accidents, reduced deaths of foreign visitors to Ireland • Deaths caused by COVID-19 that would not have happened. • Deaths attributed to COVID-19 but which would have happened anyway within the measurement interval. • Excess deaths due to but not attributed to COVID-19. • Excess deaths due to factors such as failure to seek medical attention for serious illness, failure of emergency services to respond to call sufficiently quickly because of perceived or actual excess workload, possible increased rate of suicide and Excess deaths due to Irish people who would have died on holidays abroad but who now have died while remaining in Ireland. There is a definite increase in deaths between 2019 and 2019 from 23 March 2019 16 May 2019. Thereafter the pattern is much less clear. 2020 is a Leap Year and so there is an extra day when deaths will occur. This will account for roughly an additional 85 deaths. Deaths 2019 31,173 2020 32,093 Difference 920 There is some variation in the proportion of deaths that are recorded on different days of the week. There is no real pattern or significance to the variations. In general, slightly fewer deaths occur on Saturdays, Sundays and Wednesdays. Source: Death Notices: https://www.rip.ie/ There is a double-hit to aviation: flights down by over 74% and average flight occupancy down by over 67% since the start of restrictions, leading to an over 90% reduction in passengers. 2019 2020 Difference Mortage Approvals 25,067 23,155 -7.63% Approval Amount (Millions) 5,789 5,617 -2.97% Average Approval Amount €230,576 €241,821 4.88% X Size of shorter waiting queues drop Size of longer waiting queues increase This compares some data areas for Ireland for the years 2019 and 2020 illustrating the changes between the two years. It shows some of the impacts on both COVID-19 and of actions taken in response, such as the various lockdowns and other restrictions. The first lockdown clearly had major changes. The third lockdown which began at the end of the period analysed will have as great an impact as the first lockdown. Patterns of spending have changed with significant drops in areas like transport and large increases in areas such as utilities, indicating a hidden increased cost of people working from home. Large Numbers Of Existing Patients Are Simply Moving Further Down The Queue