SlideShare uma empresa Scribd logo
1 de 16
Baixar para ler offline
Adobe 2013 Digital Marketing Optimization Survey Results
Adobe 2013 Digital Marketing Optimization
Survey Results
Key findings and strategic opportunities for the year ahead
The case for an optimization budget
The Adobe 2013 Digital Marketing Optimization Survey received global responses from more than 1,800
digital marketers across North America, Europe, and Asia. With a focus on business-to-consumer and business-
to-business commerce, the report explores the key areas in which digital marketers need to excel to ensure
success, including mobile, social, personalization, and customer experience.
A recent article from Econsultancy asked whether 2013 will be the year of conversion optimization.1
In a world
where a small uplift in conversion rates can translate into millions of dollars of extra revenue for businesses,
would this be the year that companies finally grasp how incremental improvements in digital performance can
pay significant dividends?
The survey data suggests that we still haven’t reached a tipping point, even though the evidence below points
to a competitive advantage for those companies making this investment.
Figure 1 below shows that the majority of companies surveyed spend 5% or less of their total marketing
budget on optimization activities, including agency fees, professional services, and technology. In fact, more
companies are now in the lowest tier of spending (5% or less), increasing to 53%, compared to 48% of
respondents from last year’s survey.
In total, 86% of companies surveyed allocate 15% or less of their marketing budget to optimization activities,
including the 53% who allocate less than 5%. At the other end of the scale, only 3% of respondents allocate
more than half of their marketing budget to optimization efforts.
Figure 1: What percentage of your total marketing budget is allocated to optimization
activities (including agency fees, professional services, technology)?
Respondents 2013: 1,858
Respondents 2012: 1686
13%
2012 2013
53%
22%
11%
9%
3% 3%
48%
22%
14%
9%
4% 3%
51% and
above
26% - 50%16% - 25%11% - 15%6% - 10%Less than
5%
1	
	Will 2013 be the year of conversion optimisation?, Econsultancy, December 2012, http://econsultancy.com/blog/11372-will-2013-be-the-year-of-
conversion-optimisation
Table of contents
1:	 The case for an
­optimization budget
3:	 Invest in the test—
marketers take
control
5:	 Unique audiences
deserve unique
content
7:	 The untapped
­opportunity in
testing site search
9:	 The power of
­automated
­recommendations
recognized, but
u­nderutilized
11:	The mobile laggard is
ripe for disruption
13:	Social at a ­standstill—
the analytics gap
16:	Summary
2Adobe 2013 Digital Marketing Optimization Survey Results
With the bias toward ploughing marketing budget into media-thirsty marketing activities higher up the funnel,
it is no wonder that conversion rates are so low for so many companies.
Figure 2 shows that the average site conversion rates are below 1% for 35% of the companies. But Table 1
shows that companies spending more on optimization are reaping the benefits, with those investing more than
25% of marketing budgets in this area being twice as likely to enjoy higher levels of conversion rates.
Figure 2: What is your average website conversion rate?
20%
15%
21%
26%
9% 9%
Less than
0.5%
0.5% - 0.9% 1% - 1.9% 2% - 4.9% 5% - 8.9% 9% and
above
Respondents: 1,858
In Table 1 below, we see that only 16% of those who allocate up to 25% of their marketing budget for
optimization enjoy average website conversion rates of 5% and above, compared to 39% of those who allocate
more than a quarter of marketing budget to this area.
Table 1: Average website conversion rates and
proportion of marketing budgets allocated to optimization.
Average website
conversion rate
% of total marketing budget allocated to optimization
Up to 25% More than 25%
Less than 0.5% 21% 7%
0.5% - 0.9% 16% 10%
1% - 1.9% 21% 16%
2% - 4.9% 26% 28%
5% - 8.9% 8% 18%
9% and above 8% 21%
Respondents: 1,858
More than half of North American companies allocate less than 5% of their marketing budgets to optimization,
while only a fifth allocate between 6% and 10%, compared to 27% of their European counterparts. Despite this,
North American respondents are more likely to indicate high levels of conversion rates, with 10% saying that
their conversion rates are 9% or above.
What is holding back investment in optimization activities?
As well as best-of-breed technology, the right processes need to be in place and, crucially, the right people with
the right skills within the business need to be incentivized to improve digital performance. Businesses need to
instill a culture of testing and robust analytics, with a microscopic focus on measuring incremental
improvements to justify further investment in resources and technology.
3Adobe 2013 Digital Marketing Optimization Survey Results
The good news is that the technology and tools to optimize digital marketing performance are becoming more
user-friendly, enabling quick wins from multivariate and A/B testing of different variations of creative, images,
layouts, videos, and calls to action.
Marketers are also getting better at using both real-time behavioral and existing customer data to segment
website visitors, targeting the right content at the right visitors at the right time.
Invest in the test—marketers take control
Optimizing conversion rates hasn’t always been easy: it’s detailed, can be repetitive, requires a lot of iterations,
and can even cause political battles. But what most don’t realize is that it’s one of the most rewarding efforts if
prioritized and done strategically.
Although testing is the core of any optimization program, Figure 3 demonstrates that for 49% of the survey
respondents, testing is not yet a priority at their company, with only 11% indicating that testing has been
adopted as a form of decision-making company-wide (up by only 1% since last year’s survey).
While it still looks like quite a bleak picture, it is worth noting that marketing is increasingly leading the charge,
with 16% of respondents saying that marketing departments have adopted testing as a form of decision-making.
Figure 3: How would you describe your organization’s current approach to testing?
Respondents 2013: 1,858
Respondents 2012: 1686
52%
49%
13%
16%
12% 12%
10% 11% 11%
14%
2012 2013
Testing is not a
priority in my
company yet
The marketing
department has
adopted testing
as a form of
decision-making
My team has
adopted testing
as a form of
decision-making
My organization
has adopted
testing as a form of
decision-making
company-wide
I have adopted
testing as a form
of decision-
making
More than half (53%) of survey respondents describe their testing process as manual, while 9% say they either
don’t test or haven’t implemented a testing process.
Only 32% of respondents in Asia Pacific suggest that testing is not a priority at their company, compared to
54% of their North American and 46% of their European counterparts. They are also almost twice as likely to
indicate that marketing departments have adopted testing as a form of decision-making. However, when
looking at primary testing processes, respondents in Asia Pacific are also least likely to say they either test or
implement a testing process.
When looking at the bigger picture, only 12% of those who don’t have a testing process or don’t run any tests
enjoy average website conversion rates of 5% and above. Table 2 shows that average conversion rates are below
1% for 59% of the companies who don’t invest in testing or don’t have a strategic, structured process in place.
4Adobe 2013 Digital Marketing Optimization Survey Results
Table 2: Average website conversion rates and testing processes (cross-tabulation)
Average website
conversion rate
How organizations describe their primary testing processes
No process or don't test Multiple departments have input in
testing process
Less than 1% 59% 20%
1% – 4.9% 29% 47%
More than 5% 12% 33%
Respondents: 1,858
What are the main barriers to adopting or improving testing processes? Survey results reveal that budget and
resource availability have remained the most challenging areas when it comes to testing, with just under half
(45% and 42%, respectively) of digital marketers saying that they are “very challenging.” Knowing how to test
effectively is the third most challenging area, with 82% of respondents saying that this poses a challenge for
their organizations.
European respondents are least likely to perceive testing processes that are not scalable or manageable as a
challenge, with a quarter saying that this is “not at all challenging,” compared to 19% of North American and
16% of APAC respondents.
Figure 4: How challenging are the following when it comes to testing?
Determining
significance
of test results
Testing process is not
scalable/managable
Knowing how to
test effectively
Resource availability
(creative, technical)
Budget 14%41%45%
13%45%42%
How challenging are the following
when it comes to testing?
Respondents: 1,858
Very
challenging
Somewhat
challenging
Not at all
challenging
37% 45% 17%
33% 47% 19%
31% 48% 20%
When looking specifically at organizations who haven’t made testing a priority yet, budget emerges as a major
challenge for 53% of the respondents. This is followed closely by knowing how to test effectively, with half of
those companies saying that this is very challenging.
At the other end of the spectrum, organizations who involve multiple departments in the testing process are
most likely to say that determining the significance of test results is not a challenge for them (29% compared to
around a fifth of those for which testing is confined to one team).
Companies should start with small wins and grow from there. It’s about optimizing every interaction and every
conversion event that move the customer to the end goal. In fact, failed tests are just as impactful in the
lessons learned.
5Adobe 2013 Digital Marketing Optimization Survey Results
The practice of optimization is not only about the small changes you can make to improve the way a user
experiences your website. It is also about how the company itself approaches it. If each department runs small
tests with different agendas and optimization goals—mainly to validate their own investment decisions instead
of making a real difference—the result will likely be an inefficient use of resources. Adopting a cross-
departmental approach to testing can improve the chances of higher levels of conversion rates. A third of the
companies in which multiple departments have input in testing processes say that their conversion rates are
5% or above, compared to 18% of all companies, as shown in Figure 2. Similarly, 28% of those who adopted
testing as a form of decision-making company-wide are enjoying conversion rates of 5% or above.
However, this doesn’t mean that you need to promote and facilitate testing in the whole organization from the
very beginning. This is no small feat, and most will resist change. But involving key people or groups and, most
importantly, explaining to the rest why and how you are doing this, is a great starting point.
Unique audiences deserve unique content
Content is the engine of inbound marketing. The techniques that attract attention instead of demanding it
are growing in importance as the efficiency of paid media erodes. The new emphasis on engagement means
that marketers should view how they target and deliver content as a strategic capability within their
optimization program.
Looking at the statistics below, it’s clear that most companies still largely rely on individuals to decide how,
when, and where content is delivered.
•	 In just over half (51%) of the companies surveyed, marketing executives (vice presidents or higher) typically
determine which promotional or marketing content is displayed on their sites and in their marketing
communications. Respondents in Asia Pacific are almost twice as likely than their North American counter-
parts to say that heads of online marketing determine how content is displayed (38% compared to 22%).
•	 According to the vast majority (87%) of digital marketers surveyed, less than half of their onsite visitors
receive targeted content, including 65% who say they receive less than 20%.
•	 Around a fifth (22%) of survey respondents automate the personalization of content to site visitors based on
their profile or behavior, up by 5% since last year’s survey.
•	 More than half (55%) of digital marketers say personalization is “very” or “somewhat” important to the
long-term goals of their organization, with North American respondents being more likely to say that this is
very important. Over half (53%) of APAC respondents say that this is not important.
Figure 5: Who or what determines which promotional/marketing
content is displayed on your site and in your marketing communications?
51%
27%
22%
16%
13%
13%
12%
10%
9%
8%Formal committee
Periodic (time or
calendar based)
Agency or consultants
Metrics or performance-based
Various departments
lobbying for online space
Informal group of stakeholders
No process
Creative department
Head of online marketing
Marketing executives
(VPs or higher)
Respondents: 1,858
Today, content is managed in very organic ways, but every other scaled digital tactic has eventually migrated
toward automation. Will content evolve in the same way? Technologies certainly exist, but is there a
requirement for most organizations?
6Adobe 2013 Digital Marketing Optimization Survey Results
The real question, at least for most consumer-facing organizations, isn’t if but when. The surge in user-
generated and inbound marketing content demands that marketers put rules in place to satisfy multiple
audiences and to justify the costs of content in the first place.
Figure 6: What percentage of onsite visitors receive targeted content?
66% and
above
51% - 65%36% - 50%21% - 35%Less than
20%
4%
9%10%
12%
65%
Respondents: 1,858
Even for organizations that don’t see themselves as heavy content marketers, it’s time to think ahead about
how customers and prospects will be consuming content and the implications for personalization and
optimization.
•	 Mobile—A theme throughout this year’s study is that mobile changes the personalization equation. A “nice
to have” on the desktop, personalization is essential for mobile where users’ attention and ability to navigate
is limited. Mobile also introduces location as a powerful variable for what content to deliver. For example, if a
consumer is in a building supply store, that’s a more powerful indicator of interest than any demographic or
third-party profile.
•	 Growth in content volume—As brands get drawn into becoming publishers, they face some of the same
issues. One of those is volume.
	 Consumer brands have been contending with the scale of their content efforts since day one, but going back
just a few years, a B2B company that focused on lead generation might have offered only a few white papers.
Today however, it’s likely that they’ve dramatically expanded their content assets, adding web events, videos
for owned and earned media, podcasts, searchable slide decks, blog content and, of course, social and
user-generated content.
	 As the options grow, it becomes increasingly difficult to manually determine what belongs where at the site
level, let alone for audience slices or individuals. Organizations have made dramatic leaps in the creation and
aggregation of content, but all too often they don’t enjoy a long-term benefit: Content is premiered and
featured for a short time and then left to sink into the depths of the CMS, where only highly specific searches
can find it.
•	 Batch and blast doesn’t work—Digital attention spans are short; competition for attention is fierce; and
expectations for easy relevance are high. That’s not an environment for one-size-fits-all. Fortunately, this
doesn’t always mean serving entirely different content for specific audiences. It may simply require different
packaging, descriptive language, or editing.
7Adobe 2013 Digital Marketing Optimization Survey Results
Two-thirds of respondents indicated that their customers had a “very” (15%) or “somewhat” (42%) positive
reaction to targeting and personalization efforts. Only 3% of marketers surveyed say that their customers have
reacted negatively to their targeting efforts.
Our analysis shows that companies that say their customers react “very positively” to their targeting efforts
have higher conversion rates and invest more as a percentage of their marketing budget than others. Contrary
to received wisdom in some quarters, targeting (done sensibly and appropriately) can improve customer
satisfaction and conversion rates rather than ticking customers off.
Figure 7: How have your customers reacted to your targeting or personalization efforts?
Very
negative
Somewhat
negative
No opinionSomewhat
positive
Very positive
3%
0%
39%
42%
15%
Respondents: 1,858
Two-thirds of the respondents who target content to more than 65% of their visitors report conversion rates of
2% or above, including a third who say their conversion rates are at least 5%. This compares to 36% of those
who say less than 20% of their onsite visitors receive targeted content. Only 13% of these report conversion
rates of 5% or above.
Most sites do not deliver targeted content to most visitors, failing to take advantage of a number of powerful
options for optimization. In fact, 65% of the digital marketers surveyed said that less than 20% of their
audiences are served targeted messaging, as seen in Figure 6. User profiles, stated preferences, behavior, social
graph data and, in some cases, location all provide meaningful foundations for business rules that help site
visitors engage with content that’s meaningful to them.
The metaphor of content as a magnet is common—and accurate. But magnets don’t have equal pull.
Optimizing content is the difference between a powerful pull on consumers’ attention and one that lets them
easily slip away.
The untapped opportunity in testing site search
Site search hasn’t been the topic of much discussion or research in recent years, but it’s a fundamental aspect
of findability and one that may well be getting more important. Conventional wisdom suggests that site visitors
will choose navigation over internal search to conduct most tasks. But conventional wisdom doesn’t always
reflect reality, and it can often miss changes in the marketplace.
A primary issue for marketers is ignorance. Over half are unaware of the impact of site search techniques
beyond the baseline functionality of keyword matching. When looking at the effectiveness of techniques by
region, European respondents emerged as least likely to say their onsite search is “very effective” based on
high-converting items (26%) and top-rated content or products (16%).
With modest traffic figures on most sites, site search isn’t a priority, but there are reasons to believe that
optimization of site search can have a significant impact today and a growing one over time.
8Adobe 2013 Digital Marketing Optimization Survey Results
Mobile is changing when we use navigation. Navigation works best when it offers specific routes to content.
It’s in the nature of mobile site design that menus get compressed and simplified to keep real estate
manageable on the small screen. With fewer menu options, users might be more likely to search for their
specific content.
For similar reasons, mobile means more home page visitors and fewer clicks to destination pages. Studies of
mobile searchers show that they’re more likely to click on only paid and top organic listings, probably because
there’s less room (and patience) for a full page of results. That means that they’re more likely to find
themselves on home and category levels instead of more deeply linked pages. The more general the page, the
more likely site search is used to narrow the focus.
Not all visitor segments are created equal. Most sectors find their buyers conforming to some variation of the
80/20 rule, with the majority of purchases associated with a minority of customers. Depending on how that
group behaves, site search could be less important than the gross traffic numbers indicate. Regular and returning
customers might be more likely to use site search to find products they already know or expect on a site with
which they’re familiar. The reverse might also be true. But without testing, it’s an open and important question.
Specific searches correlate with high conversion. Multiword (or long tail) searches tend to show higher
conversion rates than more general ones, for obvious reasons. The first order of business is to determine
whether that’s as true for site-search users as it is for deep-linked visitors arriving from external search engines.
If this proves to be the case, there are opportunities for optimization on the specific purchase as well as adding
to the overall value of the shopping cart. If it’s not the case, it’s worth finding out why before deciding on
whether to invest in optimization.
Figure 8: How effective is your onsite search based on the following?
Respondents: 1,858Very
effective
Somewhat
effective
Less
effective
15% 19% 17% 23% 21% 20%
28%
49%
49% 52% 49%
54% 57%
58%
35% 31% 31% 28% 25% 24%
14%
Keyword
matching
Top rated
content or
products
Product or
service
availability
PromotionsTargeted
results
based on
user profile
High
converting
items
Customizable
business
metrics
(KPIs)
Figure 8 demonstrates that there are a number of effective options for optimizing site search results. Marketers
who test these options may find that different audiences respond to different optimization techniques and that
different scenarios call for different rules. For example, a retailer might aim for revenue maximization at the
end of a quarter while seeking to move older inventory in the post-holiday period.
The first step for any type of site is to make a concerted effort to understand the current role of site search for
different segments and evaluate the role it might play in growth.
9Adobe 2013 Digital Marketing Optimization Survey Results
The power of automated recommendations recognized, but underutilized
Displaying recommendations is often thought of solely as a merchandising strategy most applicable to
e-commerce. While that is the typical application seen today, it certainly is not limited to digital commerce or
retail. Consumers embrace content and item recommendations because they deliver value that is meaningful
and practical. Organizations should embrace this power of suggestion; while helpful to the customer,
recommendations are a proven way of dramatically improving engagement and conversion goals. Figure 9
reveals that while e-commerce businesses continue to lead in recommendations adoption, other industries
such as media and financial services (with primary business goals excluding selling items online) are
recognizing the value of automated recommendations and planning to implement this year.
Figure 9: Do you currently use automated recommendations in your business?
20.4%
17.4 %
16.5 %
19.1 %
1.7 %
3.3%
Financial Services
(primary goal all
excluding e-commerce)
Media
(primary goal
excludes e-commerce)
E-commerce
(all responses across industries whose
primary business goal is selling items online)
Using automated
recommendations now
Intend to deploy
this year
E-commerce: 393 / Media: 172 / Financial services: 91Respondents:
Whether suggesting articles based on a visitor’s previous reading patterns, help resources based on recent
sign-ups, or presenting tempting cross-sell offers based on a shopper’s affinity for certain products, marketers
across industries can leverage recommendations as a way to engage and converse with a visitor through to
conversion. Despite this, 38% of digital marketers do not use any content or product recommendations, which
is flat from 2012. Automated recommendations engines often provide marketer-control and flexibility to
power delivery of relevant suggestions optimized for critical engagement areas of a website, as well as other
digital channels such as mobile applications, social networks, and email. Yet, the survey data shows
consistently year over year that for marketers deploying recommendations:
·	 Most are focusing on at top of funnel locations such as the home page, category pages, product pages, or
article pages.
Figure 10: Where are you displaying product/content recommendations?
49%
36%
32%
16%
9%
7%
5%
5%
45%
47%
38%
21%
10%
7%
6%
7%
User profile page
Confirmation page
Checkout page
Shopping cart
Search results page
Category page
Product or article page
Home page
20132012 Respondents 2013: 1,858
Respondents 2012: 1,686
10Adobe 2013 Digital Marketing Optimization Survey Results
·	 Primary recommendations featured are top-selling or most popular and new items or content
Figure 11: Upon which criteria are your product or content recommendations based?
38%
35%
35%
24%
19%
18%
18%
38%
33%
33%
25%
20%
16%
18%
Related product or content characteristics
Past behavior or individual visitor
Based on what other customers
have viewed or purchased
Promotional products or
company highlighted content
Newly available content
Top selling products or most popular content
No recommendation tool or process in place
20132012 Respondents 2013: 1,858
Respondents 2012: 1,686
·	 Nearly half do not optimize their recommendation strategies, and rely heavily on manual updates. Only 18%
are using an automated approach.
Figure 12: How do you optimize the relevance of your recommendations?
Respondents: 2013: 1,858
2012: 1,686
13%
2012 2013
48%
26%
19%
18% 18%
53%
26%
17%
19%
18%
Use automated
business rules
(e.g. seasonal inventory,
profit margins, top rated content)
Visitor profile
information
Behavioral
activity
Manually update
recommendations
No
optimization
Recommendations is a natural, yet underutilized personalization tactic. Combining marketer-defined and
automated approaches to optimize relevant recommendations across channels encourages consumers to engage
with a brand, builds confidence and loyalty, and removes barriers to initial and supplementary conversions.
11Adobe 2013 Digital Marketing Optimization Survey Results
The mobile laggard is ripe for disruption
A recent Adobe Digital Index report analyzing more than 100 billion visits to more than 1,000 websites
worldwide revealed that tablets now exceed smartphones in global web traffic. Because consumers spend more
time engaging with tablet devices, marketers should be prioritizing tablet-optimized experiences in 2013.2
During 2012, the Adobe Analytics business observed a doubling of traffic from mobile devices, and this trend is
reflective of many clients. However, almost half (45%) of digital marketers surveyed say their organizations
don’t have a mobile-optimized site or mobile application, relying on desktop sites only. Only 7% have built
mobile apps, and a fifth (21%) have implemented both a mobile-optimized site and a mobile app. By not
investing in mobile channels, organizations risk being left behind as mobile consumers choose a competitor’s
mobile-friendly experience.
Separate research exploring digital trends for 2013 showed that while mobile optimization is an exciting
opportunity for 43% of the companies surveyed, only 30% consider it a top priority in 2013.3
Figure 13: What type of mobile channel does your business have?
None of the above -
use desktop site
BothMobile applicationMobile optimized
website
45%
21%
27%
7%
Respondents: 1,858
Figure 14 shows that average mobile conversion rates are below 1% for more than half (57%) of companies,
including 41% who say they are below 0.5%. Further interrogation of the data showed that companies investing
in mobile-optimized sites are three times more likely to be enjoying mobile conversion rates of 5% or above
than those who rely on desktop sites. Not surprisingly, those who use both a mobile-optimized site and a
mobile app are experiencing even higher levels of conversion.
As Asia consumers come online, they do so most often via mobile devices, leapfrogging the fixed Internet
stage as seen in developed markets. It comes as no surprise then that APAC respondents indicate not only
higher usage of mobile-optimized websites, but also higher levels of mobile conversion rates. Half (49%) of
APAC marketers surveyed say that they enjoy mobile conversion rates of at least 1%, including 28% with
conversion rates of 2% or above.
2
		Tablets trump smartphones in global website traffic, Adobe Digital Marketing Blog, March 2013, http://blogs.adobe.com/digitalmarketing/digital-
index/tablets-trump-smartphones-in-global-website-traffic
3
		Quarterly Digital Intelligence Briefing: Digital Trends for 2013, Econsultancy and Adobe, January 2013, http://success.adobe.com/en/uk/programs/
products/digitalmarketing/1301-28808-econsultancy-digital-trends-for-2013.html
12Adobe 2013 Digital Marketing Optimization Survey Results
Figure 14: What is your average mobile conversion rate?
9% and
above
5% - 8.9%2% - 4.9%1% - 1.9%0.5% - 0.9%Less than
0.5%
16%
4% 5%
18%
16%
41%
Respondents: 1,858
As shown in Figure 15, despite the correlation between the use of certain mobile channels and higher levels of
mobile conversion rates, 30% of digital marketers consider mobile apps very effective at increasing conversion rates.
Survey data also suggest that advertising promotions, bar-coded coupons, and QR codes are most effective at
having a positive impact on conversion rates, with the vast majority saying they’re “somewhat’” (49%) or “very”
(34%) effective.
While large companies are already addressing the rapidly expanding mobile audience, most businesses are only
dipping their toe in the water. The reasons behind the slow progress are various, ranging from not knowing
where to start, to being bogged down in complex mobile initiatives that eat up a lot of time and budget.
If your organization has just started its foray into mobile, don’t start building a mobile site or app just because
your competitors have. Engage with your analytics team and evaluate the mobile device types (feature phones,
smartphones, tablets) that are visiting your desktop website and the trending of mobile traffic over the past year.
Bear in mind that low mobile-browser traffic might not necessarily indicate that your mobile audience is small.
It could be that your website just doesn’t perform well on smaller screens, and this is driving visitors away.
Don’t build an app just for the sake of it. Focus on the goal of your mobile initiatives, prioritize your company’s
needs, and choose a solution that can best address these needs now and into the future.
As the Digital Trends for 2013 report highlighted:
“To move forward in ‘mobile optimization’ means coming to grips with the reality that every experience we
offer through digital channels—every web page, shopping cart and piece of rich content—must work well on
any device in any location. The customer understands that concessions need to be made for the smaller screen,
touchscreen input and slower speed, but they won’t accept unnecessary hassle or delay. Apps are a part of
today’s approach to mobile, but they are not a broad answer to this challenge, as use of the mobile web
increases daily.”
13Adobe 2013 Digital Marketing Optimization Survey Results
Figure 15: How effective are these mobile tactics for increasing conversion rates?
20%
17%
19%
23%
23%
26%
24%
24%
26%
40%
49%
47%
46%
47%
47%
51%
52%
50%
40%
34%
34%
31%
30%
27%
25%
25%
24%Mobile optimized website
Customer ratings or reviews
Location-based marketing
Videos
Mobile app
Catalogs optimized for mobile
Social sharing (e.g. Facebook, Twitter,
Pinterest icons on pages)
Advertising promotions, bar-coded
coupons, and QR codes
Check-in rewards
Respondents: 1,858
Very
effective
Somewhat
effective
Less
effective
Many companies choose to focus on form over function, not realizing that a mobile site needs to address
customers’ needs and facilitate the key functional requirements of the main site. If your visitors are typically
looking for certain specs in product descriptions, make sure that you provide this information in a format that
is easily accessible on mobile devices. Simple design and flawless execution are paramount.
In a mobile market that is evolving quickly, there are no guarantees that the choice you make today will be the
right one for your organization in the future. But focusing on your overarching business objectives, user
experience, and customer expectations helps ensure that the odds are in your favor.
Social at a standstill—the analytics gap
Chances are that social at your company hasn’t been a complete success. One reason is that the term includes
a variety of internal and external activities on Facebook, Twitter, Pinterest, and YouTube as well as on owned
media. At some organizations, social even includes display ads on social networks, though it shouldn’t. It’s a
challenge to reconcile and understand the real impact of all those pieces.
The real problem is the gap between what marketers believe and what they know. Most companies still fly blind,
equating limited and flawed measures (volume of followers, for example)—or no measures at all—with success
or failure.
Figure 16: Which customer experience measurement
and optimization tactics do you currently use?
Other
Attribution modeling
Onsite survey
Mobile analytics
Testing
Social media analytics
Website analytics 83%
47%
31%
22%
20%
6%
5%
Respondents 2013: 1,858
Respondents 2012: 1,686
14Adobe 2013 Digital Marketing Optimization Survey Results
In study after study, marketers report that it’s challenging to measure the return on their social efforts, and it’s
not just a problem for smaller companies. Even at organizations with revenues over $150 million, 71% of
marketers agreed with the statement that “measuring the impact of social media marketing is very difficult.”4
This challenge breaks into two parts: the nature of social, and the tools we use (or don’t).
Social is becoming the defining channel of the inbound marketing age. It’s where customers meet the brand
and the closest thing to a true two-way relationship that exists online. It’s where companies measure
sentiment, deal with service issues, discover the problems and potential of products, and try to activate
word-of-mouth marketing from their more avid fans. But for all that activity, social interactions tend to happen
somewhere in the middle of the customer journey (or mid-funnel), not immediately before the conversion
event. Few companies (6% of this sample) are in a position to conduct the kind of attribution modeling to
understand the interactions between social and the other channels that are in the mix.
If companies are doing attribution at all, it’s most likely around the last click prior to purchase, and therefore,
undercounting the influence of helping tactics, like social and email. The more common approach to
measuring social is to apply analytics tools designed for the purpose. These range from free, limited
approaches to enterprise-ready platforms, but collectively they still represent only 47% of the market, virtually
unchanged since last year’s study, as Figure 16 shows.
On-site social activity, including tactics ranging from user reviews to social sharing buttons, does not garner as
much media attention, but this is an area which can have a more direct and measurable impact on the bottom
line than an off-site media presence. Of course, on-site and off-site social media activities are often inextricably
linked, with the atomization of the web blurring the boundaries between owned, earned and paid for media.
The power of social sharing functionality is evident from Figure 17 which shows that changes to the way this is
presented can have a bigger impact on conversion rates than a range of other elements that contribute to the
digital experience.
Social sharing (social sharing icons on pages) is deemed to be the most effective test variable for increasing
conversion rates, with two in five companies saying that this is very effective and a further 44% saying that it’s
somewhat effective.
Figure 17: How effective are each of the following at increasing conversion rates?
17%
16%
19%
24%
24%
25%
35%
31%
41%
40%
33%
44%
47%
48%
48%
48%
49%
48%
52%
44%
46%
56%
39%
37%
33%
28%
28%
26%
17%
17%
15%
14%
11%Page layouts
Photos or images
Offers or promotions
Page copy
CTAs
Navigation elements
Steps/pages in conversion process
Homepage hero image
Form fields
Third-party credibility indicators
(e.g. security seals)
Social sharing (e.g. social
sharing icons on pages)
Respondents: 940
Very
effective
Somewhat
effective
Less
effective
By synchronizing off-site and on-site social media activity, companies are increasingly using social data to
augment the implicit and explicit information they already have about website visitors. With a website visitor’s
permission, marketers can drill into a rich well of social intelligence enabling, for example, publishers to
recommend more relevant articles and retailers to showcase more appealing products.
4
	Quarterly Digital Intelligence Briefing: Managing and Measuring Social, Econsultancy and Adobe, September 2012, http://success.adobe.com/en/na/
programs/products/digitalmarketing/offers/1208_22970_econsultancy_social_dib.html
15Adobe 2013 Digital Marketing Optimization Survey Results
Separate research carried out by Econsultancy and Adobe5
last year showed that personalization of the web
experience using social data can be a very effective way of boosting ROI. According to that research, only 6%
use social graph (i.e. Facebook) data for personalization, though 88% say the impact on both ROI and
engagement is high.
Figure 18 below shows a range of social media strategies and tactics, and how effective they are at increasing
conversion rates. Again, social sharing can be seen to be worth its weight in gold when it comes to boosting
conversion rates. European respondents are most likely to find it effective, with 43% saying that it’s very
effective (compared to 37% of all companies).
Figure 18: How effective are these social media tactics on your site in increasing
conversion rates?
17%
19%
18%
20%
17%
18%
22%
46%
44%
45%
44%
50%
51%
49%
37%
37%
37%
36%
32%
31%
29%User comments, reviews, or ratings
Blogs and social community pages
Collaborative custom product design
(items, sets, outfits, etc.)
User-generated content
(images, video, audio)
User-created collections for
sharing and purchase
Live chat or instant messaging
Social sharing (e.g. Facebook, Twitter,
Pinterest icons on pages)
Respondents: 1,858
Very
effective
Somewhat
effective
Less
effective
Social-specific technologies address a variety of different functions, from workflow and asset management, to
sentiment analysis and full-blown customer relationship management (CRM) integration. But underneath all
these must be the ability to associate customers’ social interactions with meaningful business goals. Vague
definitions of engagement and follower growth are increasingly less likely to satisfy senior executives.
Marketers recognize a gap in their knowledge and seem poised to do something about it. Almost one-third of
the sample reported their organization’s intent to implement some type of social media analytics. Marketing
departments that don’t grapple with how to consistently evaluate what social means for them may soon find
themselves in the worst-case scenario of being judged by the flawed benchmarks they’re using for lack of
anything better.
5
		Quarterly Digital Intelligence Briefing: Personalization, Trust and Return on Investment, Econsultancy and Adobe, June 2012, http://econsultancy.com/
reports/quarterly-digital-intelligence-briefing-personalisation-trust-and-roi
Summary
Despite the need for and proven competitive advantages of digital marketing optimization, businesses still lag
in prioritizing investment in such a strategic program. With optimization technology and marketer skills
continuing to advance, it is becoming easier than ever to test, tailor, and deliver an enhanced experience
throughout the customer journey that is guaranteed to make an impact to top- and bottom-line revenues.
As you plan your strategic marketing initiatives for the year ahead, it is important to consider these key
takeaways:
• 	Testing is the core of any personalization and optimization program. Start with small wins, and expand efforts
from there; failed tests are just as impactful in lessons learned.
• 	Optimized targeting breeds customer satisfaction and conversion. Leveraging consumer data such as stated
preferences, past and current onsite behavior, social graphs, and location can assist in tailoring content that
resonates with visitors and pulls them to interact.
• 	Site search is an untapped opportunity for optimization; navigation works best when it offers specific routes
to content. By testing and tailoring site search tactics including keyword matching, promotion of high
converting items, and user profile targeted results , you can unveil the optimal experience to deliver a visitor
to maximize conversion and revenue.
• 	Automated recommendations is not just for digital commerce; all industries can realize the benefits of this
natural personalization strategy. Powering relevant suggestions across all digital channels is a proven way to
increase consumer engagement, confidence, and loyalty with a brand.
• 	Nearly every consumer is a mobile consumer—is your mobile presence optimized? Determine the goal of
your mobile initiatives; look at your analytics; and decide which mobile tactics best address your businesses
needs now and in the future.
·	 Don’t fly blind when it comes to social. Use moderation and measurement tools to guide conversations
toward a positive impact for your business.
Adobe Systems Incorporated
345 Park Avenue
San Jose, CA 95110-2704
USA
www.adobe.com
Adobe and the Adobe logo are either registered trademarks or trademarks of Adobe Systems Incorporated in the United States and/or other countries. Java is a trademark or
registered trademark of Oracle and/or its affiliates. All other trademarks are the property of their respective owners.
© 2013 Adobe Systems Incorporated. All rights reserved. Printed in the USA.
4/13

Mais conteúdo relacionado

Mais procurados

The cmo survey_highlights_and_insights_aug - 13-final
The cmo survey_highlights_and_insights_aug - 13-finalThe cmo survey_highlights_and_insights_aug - 13-final
The cmo survey_highlights_and_insights_aug - 13-finalchristinemoorman
 
Eloqua research: Defining the modern marketer (webinar slides 6-28-13)
Eloqua research: Defining the modern marketer (webinar slides 6-28-13) Eloqua research: Defining the modern marketer (webinar slides 6-28-13)
Eloqua research: Defining the modern marketer (webinar slides 6-28-13) B2B Marketing
 
Measuring cx roi with social media deck 787-f
Measuring cx roi with social media   deck 787-fMeasuring cx roi with social media   deck 787-f
Measuring cx roi with social media deck 787-fGideon Ale
 
digital-transformation-agenda-2016
digital-transformation-agenda-2016digital-transformation-agenda-2016
digital-transformation-agenda-2016Derk-Jan Brand
 
How advocate marketing boosts lead to-revenue management
How advocate marketing boosts lead to-revenue managementHow advocate marketing boosts lead to-revenue management
How advocate marketing boosts lead to-revenue managementInfluitive
 
Healthcare b2b Tech Content Marketing Survey 2017
Healthcare b2b Tech Content Marketing Survey 2017 Healthcare b2b Tech Content Marketing Survey 2017
Healthcare b2b Tech Content Marketing Survey 2017 Damo Consulting Inc.
 
Mercuri international sales excellence study
Mercuri international sales excellence studyMercuri international sales excellence study
Mercuri international sales excellence studyAleksander Brankov
 
Redefining pharmacovigilance-with-social-media
Redefining pharmacovigilance-with-social-mediaRedefining pharmacovigilance-with-social-media
Redefining pharmacovigilance-with-social-mediaDheeraj Girdhani
 
The Economics of Reputation
The Economics of ReputationThe Economics of Reputation
The Economics of ReputationMattcartmell
 
B2B Email Marketing Effectiveness Benchmarking Report
B2B Email Marketing Effectiveness Benchmarking ReportB2B Email Marketing Effectiveness Benchmarking Report
B2B Email Marketing Effectiveness Benchmarking ReportDemand Metric
 
The CMO Survey Highlights and Insights Feb 2016
The CMO Survey Highlights and Insights Feb 2016The CMO Survey Highlights and Insights Feb 2016
The CMO Survey Highlights and Insights Feb 2016christinemoorman
 
The CMO Survey Report: Highlight and Insights August 2014
The CMO Survey Report: Highlight and Insights August 2014The CMO Survey Report: Highlight and Insights August 2014
The CMO Survey Report: Highlight and Insights August 2014christinemoorman
 
The value of content
The value of contentThe value of content
The value of contentGenaro Bardy
 
2010 SMB marketing practices survey
2010 SMB marketing practices survey2010 SMB marketing practices survey
2010 SMB marketing practices surveycbucoy
 
2012 annual saas metrics survey results
2012 annual saas metrics survey results 2012 annual saas metrics survey results
2012 annual saas metrics survey results Totango
 
Margin Performance Report - Exploring how companies can beat market expectations
Margin Performance Report - Exploring how companies can beat market expectationsMargin Performance Report - Exploring how companies can beat market expectations
Margin Performance Report - Exploring how companies can beat market expectationsCaroline Burns
 
Scientific Conferences Survey Report
Scientific Conferences Survey ReportScientific Conferences Survey Report
Scientific Conferences Survey ReportCarlton Hoyt
 

Mais procurados (18)

The cmo survey_highlights_and_insights_aug - 13-final
The cmo survey_highlights_and_insights_aug - 13-finalThe cmo survey_highlights_and_insights_aug - 13-final
The cmo survey_highlights_and_insights_aug - 13-final
 
Eloqua research: Defining the modern marketer (webinar slides 6-28-13)
Eloqua research: Defining the modern marketer (webinar slides 6-28-13) Eloqua research: Defining the modern marketer (webinar slides 6-28-13)
Eloqua research: Defining the modern marketer (webinar slides 6-28-13)
 
Measuring cx roi with social media deck 787-f
Measuring cx roi with social media   deck 787-fMeasuring cx roi with social media   deck 787-f
Measuring cx roi with social media deck 787-f
 
digital-transformation-agenda-2016
digital-transformation-agenda-2016digital-transformation-agenda-2016
digital-transformation-agenda-2016
 
How advocate marketing boosts lead to-revenue management
How advocate marketing boosts lead to-revenue managementHow advocate marketing boosts lead to-revenue management
How advocate marketing boosts lead to-revenue management
 
Healthcare b2b Tech Content Marketing Survey 2017
Healthcare b2b Tech Content Marketing Survey 2017 Healthcare b2b Tech Content Marketing Survey 2017
Healthcare b2b Tech Content Marketing Survey 2017
 
Mercuri international sales excellence study
Mercuri international sales excellence studyMercuri international sales excellence study
Mercuri international sales excellence study
 
Redefining pharmacovigilance-with-social-media
Redefining pharmacovigilance-with-social-mediaRedefining pharmacovigilance-with-social-media
Redefining pharmacovigilance-with-social-media
 
The Economics of Reputation
The Economics of ReputationThe Economics of Reputation
The Economics of Reputation
 
B2B Email Marketing Effectiveness Benchmarking Report
B2B Email Marketing Effectiveness Benchmarking ReportB2B Email Marketing Effectiveness Benchmarking Report
B2B Email Marketing Effectiveness Benchmarking Report
 
The CMO Survey Highlights and Insights Feb 2016
The CMO Survey Highlights and Insights Feb 2016The CMO Survey Highlights and Insights Feb 2016
The CMO Survey Highlights and Insights Feb 2016
 
Analytics in the boardroom
Analytics in the boardroomAnalytics in the boardroom
Analytics in the boardroom
 
The CMO Survey Report: Highlight and Insights August 2014
The CMO Survey Report: Highlight and Insights August 2014The CMO Survey Report: Highlight and Insights August 2014
The CMO Survey Report: Highlight and Insights August 2014
 
The value of content
The value of contentThe value of content
The value of content
 
2010 SMB marketing practices survey
2010 SMB marketing practices survey2010 SMB marketing practices survey
2010 SMB marketing practices survey
 
2012 annual saas metrics survey results
2012 annual saas metrics survey results 2012 annual saas metrics survey results
2012 annual saas metrics survey results
 
Margin Performance Report - Exploring how companies can beat market expectations
Margin Performance Report - Exploring how companies can beat market expectationsMargin Performance Report - Exploring how companies can beat market expectations
Margin Performance Report - Exploring how companies can beat market expectations
 
Scientific Conferences Survey Report
Scientific Conferences Survey ReportScientific Conferences Survey Report
Scientific Conferences Survey Report
 

Semelhante a Digital Marketing Optimization Survey

The CMO Survey - Highlights and Insights Report - March 2023
The CMO Survey - Highlights and Insights Report - March 2023The CMO Survey - Highlights and Insights Report - March 2023
The CMO Survey - Highlights and Insights Report - March 2023christinemoorman
 
Pepper 2014 Marketing Automation Report
Pepper 2014 Marketing Automation ReportPepper 2014 Marketing Automation Report
Pepper 2014 Marketing Automation ReportPepper
 
Watson Marketing 2017 Research
Watson Marketing 2017 ResearchWatson Marketing 2017 Research
Watson Marketing 2017 ResearchJeremy Waite
 
Whitepaper: Ventana Research - Sales Compensation Management
Whitepaper: Ventana Research - Sales Compensation ManagementWhitepaper: Ventana Research - Sales Compensation Management
Whitepaper: Ventana Research - Sales Compensation ManagementIconixx
 
2015 Digital Marketing Benchmark Report
2015 Digital Marketing Benchmark Report2015 Digital Marketing Benchmark Report
2015 Digital Marketing Benchmark ReportDemandbase
 
CWT_ME_TMI_SMM_Executive Summary
CWT_ME_TMI_SMM_Executive SummaryCWT_ME_TMI_SMM_Executive Summary
CWT_ME_TMI_SMM_Executive SummaryAngela DiNatale
 
Alterian 8th Annual Survey Results
Alterian 8th Annual Survey ResultsAlterian 8th Annual Survey Results
Alterian 8th Annual Survey ResultsAlterian
 
Data driven marketing - forbes
Data driven marketing - forbesData driven marketing - forbes
Data driven marketing - forbesTuan Le
 
Marketing Analytics in 2013 Benchmarking Report
Marketing Analytics in 2013 Benchmarking ReportMarketing Analytics in 2013 Benchmarking Report
Marketing Analytics in 2013 Benchmarking ReportDemand Metric
 
2018 customer journey_mapping_research_myc
2018 customer journey_mapping_research_myc2018 customer journey_mapping_research_myc
2018 customer journey_mapping_research_mycSylke Will
 
Marketing Attribution: Valuing The Customer Journey
Marketing Attribution: Valuing The Customer JourneyMarketing Attribution: Valuing The Customer Journey
Marketing Attribution: Valuing The Customer JourneyDung Tri
 
2010 Nolan Life & Annuity Industry Survey Results
2010 Nolan Life & Annuity Industry Survey Results2010 Nolan Life & Annuity Industry Survey Results
2010 Nolan Life & Annuity Industry Survey ResultsSteven Callahan
 
Sales & Marketing Alignment Benchmarking Report Summary
Sales & Marketing Alignment Benchmarking Report SummarySales & Marketing Alignment Benchmarking Report Summary
Sales & Marketing Alignment Benchmarking Report SummaryDemand Metric
 
Landscape of digital marketers in vietnam Otc 2017
Landscape of digital marketers in vietnam Otc 2017Landscape of digital marketers in vietnam Otc 2017
Landscape of digital marketers in vietnam Otc 2017Duy, Vo Hoang
 
The State of Always-On Marketing Study
The State of Always-On Marketing StudyThe State of Always-On Marketing Study
The State of Always-On Marketing StudyIshraq Dhaly
 
Measuring What Matters
Measuring What MattersMeasuring What Matters
Measuring What MattersJim Nichols
 
The State of Business
The State of BusinessThe State of Business
The State of Businesstechweb08
 
The State of Business
The State of Business The State of Business
The State of Business techweb08
 
SST_2019_SalesTech_Benchmark_Survey-c.pdf
SST_2019_SalesTech_Benchmark_Survey-c.pdfSST_2019_SalesTech_Benchmark_Survey-c.pdf
SST_2019_SalesTech_Benchmark_Survey-c.pdfdiyabhardwaj2
 

Semelhante a Digital Marketing Optimization Survey (20)

The CMO Survey - Highlights and Insights Report - March 2023
The CMO Survey - Highlights and Insights Report - March 2023The CMO Survey - Highlights and Insights Report - March 2023
The CMO Survey - Highlights and Insights Report - March 2023
 
Pepper 2014 Marketing Automation Report
Pepper 2014 Marketing Automation ReportPepper 2014 Marketing Automation Report
Pepper 2014 Marketing Automation Report
 
Watson Marketing 2017 Research
Watson Marketing 2017 ResearchWatson Marketing 2017 Research
Watson Marketing 2017 Research
 
Whitepaper: Ventana Research - Sales Compensation Management
Whitepaper: Ventana Research - Sales Compensation ManagementWhitepaper: Ventana Research - Sales Compensation Management
Whitepaper: Ventana Research - Sales Compensation Management
 
2015 Digital Marketing Benchmark Report
2015 Digital Marketing Benchmark Report2015 Digital Marketing Benchmark Report
2015 Digital Marketing Benchmark Report
 
CWT_ME_TMI_SMM_Executive Summary
CWT_ME_TMI_SMM_Executive SummaryCWT_ME_TMI_SMM_Executive Summary
CWT_ME_TMI_SMM_Executive Summary
 
Alterian 8th Annual Survey Results
Alterian 8th Annual Survey ResultsAlterian 8th Annual Survey Results
Alterian 8th Annual Survey Results
 
Data driven marketing - forbes
Data driven marketing - forbesData driven marketing - forbes
Data driven marketing - forbes
 
Marketing Analytics in 2013 Benchmarking Report
Marketing Analytics in 2013 Benchmarking ReportMarketing Analytics in 2013 Benchmarking Report
Marketing Analytics in 2013 Benchmarking Report
 
2018 customer journey_mapping_research_myc
2018 customer journey_mapping_research_myc2018 customer journey_mapping_research_myc
2018 customer journey_mapping_research_myc
 
Marketing Attribution: Valuing The Customer Journey
Marketing Attribution: Valuing The Customer JourneyMarketing Attribution: Valuing The Customer Journey
Marketing Attribution: Valuing The Customer Journey
 
2010 Nolan Life & Annuity Industry Survey Results
2010 Nolan Life & Annuity Industry Survey Results2010 Nolan Life & Annuity Industry Survey Results
2010 Nolan Life & Annuity Industry Survey Results
 
Sales & Marketing Alignment Benchmarking Report Summary
Sales & Marketing Alignment Benchmarking Report SummarySales & Marketing Alignment Benchmarking Report Summary
Sales & Marketing Alignment Benchmarking Report Summary
 
Landscape of digital marketers in vietnam Otc 2017
Landscape of digital marketers in vietnam Otc 2017Landscape of digital marketers in vietnam Otc 2017
Landscape of digital marketers in vietnam Otc 2017
 
The State of Always-On Marketing Study
The State of Always-On Marketing StudyThe State of Always-On Marketing Study
The State of Always-On Marketing Study
 
Measuring What Matters
Measuring What MattersMeasuring What Matters
Measuring What Matters
 
The State of Business
The State of BusinessThe State of Business
The State of Business
 
The State of Business
The State of Business The State of Business
The State of Business
 
SST_2019_SalesTech_Benchmark_Survey-c.pdf
SST_2019_SalesTech_Benchmark_Survey-c.pdfSST_2019_SalesTech_Benchmark_Survey-c.pdf
SST_2019_SalesTech_Benchmark_Survey-c.pdf
 
B2B-Lead-Generation-Report
B2B-Lead-Generation-ReportB2B-Lead-Generation-Report
B2B-Lead-Generation-Report
 

Mais de Vaibhav Agarwal

Data management platform_market
Data management platform_marketData management platform_market
Data management platform_marketVaibhav Agarwal
 
Global and regional press freedom rankings
Global and regional press freedom rankingsGlobal and regional press freedom rankings
Global and regional press freedom rankingsVaibhav Agarwal
 
Internet Impact on Global GDP - Worldwide Statistics
Internet Impact on Global GDP - Worldwide StatisticsInternet Impact on Global GDP - Worldwide Statistics
Internet Impact on Global GDP - Worldwide StatisticsVaibhav Agarwal
 
E-Mail Marketing Best Practices for your business
E-Mail Marketing Best Practices for your businessE-Mail Marketing Best Practices for your business
E-Mail Marketing Best Practices for your businessVaibhav Agarwal
 
Internet users statistics & trends: Brazil, Russia, India, China, Indonesia
Internet users statistics & trends: Brazil, Russia, India, China, IndonesiaInternet users statistics & trends: Brazil, Russia, India, China, Indonesia
Internet users statistics & trends: Brazil, Russia, India, China, IndonesiaVaibhav Agarwal
 
Benchmark study of B2B lead management practices
Benchmark study of B2B lead management practicesBenchmark study of B2B lead management practices
Benchmark study of B2B lead management practicesVaibhav Agarwal
 

Mais de Vaibhav Agarwal (7)

Data management platform_market
Data management platform_marketData management platform_market
Data management platform_market
 
Global and regional press freedom rankings
Global and regional press freedom rankingsGlobal and regional press freedom rankings
Global and regional press freedom rankings
 
Internet Impact on Global GDP - Worldwide Statistics
Internet Impact on Global GDP - Worldwide StatisticsInternet Impact on Global GDP - Worldwide Statistics
Internet Impact on Global GDP - Worldwide Statistics
 
E-Mail Marketing Best Practices for your business
E-Mail Marketing Best Practices for your businessE-Mail Marketing Best Practices for your business
E-Mail Marketing Best Practices for your business
 
Internet users statistics & trends: Brazil, Russia, India, China, Indonesia
Internet users statistics & trends: Brazil, Russia, India, China, IndonesiaInternet users statistics & trends: Brazil, Russia, India, China, Indonesia
Internet users statistics & trends: Brazil, Russia, India, China, Indonesia
 
Benchmark study of B2B lead management practices
Benchmark study of B2B lead management practicesBenchmark study of B2B lead management practices
Benchmark study of B2B lead management practices
 
Internet Marketing Quiz
Internet Marketing QuizInternet Marketing Quiz
Internet Marketing Quiz
 

Último

Traction part 2 - EOS Model JAX Bridges.
Traction part 2 - EOS Model JAX Bridges.Traction part 2 - EOS Model JAX Bridges.
Traction part 2 - EOS Model JAX Bridges.Anamaria Contreras
 
Unlocking the Future: Explore Web 3.0 Workshop to Start Earning Today!
Unlocking the Future: Explore Web 3.0 Workshop to Start Earning Today!Unlocking the Future: Explore Web 3.0 Workshop to Start Earning Today!
Unlocking the Future: Explore Web 3.0 Workshop to Start Earning Today!Doge Mining Website
 
Chapter 9 PPT 4th edition.pdf internal audit
Chapter 9 PPT 4th edition.pdf internal auditChapter 9 PPT 4th edition.pdf internal audit
Chapter 9 PPT 4th edition.pdf internal auditNhtLNguyn9
 
Fordham -How effective decision-making is within the IT department - Analysis...
Fordham -How effective decision-making is within the IT department - Analysis...Fordham -How effective decision-making is within the IT department - Analysis...
Fordham -How effective decision-making is within the IT department - Analysis...Peter Ward
 
8447779800, Low rate Call girls in Tughlakabad Delhi NCR
8447779800, Low rate Call girls in Tughlakabad Delhi NCR8447779800, Low rate Call girls in Tughlakabad Delhi NCR
8447779800, Low rate Call girls in Tughlakabad Delhi NCRashishs7044
 
8447779800, Low rate Call girls in Kotla Mubarakpur Delhi NCR
8447779800, Low rate Call girls in Kotla Mubarakpur Delhi NCR8447779800, Low rate Call girls in Kotla Mubarakpur Delhi NCR
8447779800, Low rate Call girls in Kotla Mubarakpur Delhi NCRashishs7044
 
Pitch Deck Teardown: Geodesic.Life's $500k Pre-seed deck
Pitch Deck Teardown: Geodesic.Life's $500k Pre-seed deckPitch Deck Teardown: Geodesic.Life's $500k Pre-seed deck
Pitch Deck Teardown: Geodesic.Life's $500k Pre-seed deckHajeJanKamps
 
Cyber Security Training in Office Environment
Cyber Security Training in Office EnvironmentCyber Security Training in Office Environment
Cyber Security Training in Office Environmentelijahj01012
 
The-Ethical-issues-ghhhhhhhhjof-Byjus.pptx
The-Ethical-issues-ghhhhhhhhjof-Byjus.pptxThe-Ethical-issues-ghhhhhhhhjof-Byjus.pptx
The-Ethical-issues-ghhhhhhhhjof-Byjus.pptxmbikashkanyari
 
Annual General Meeting Presentation Slides
Annual General Meeting Presentation SlidesAnnual General Meeting Presentation Slides
Annual General Meeting Presentation SlidesKeppelCorporation
 
Ten Organizational Design Models to align structure and operations to busines...
Ten Organizational Design Models to align structure and operations to busines...Ten Organizational Design Models to align structure and operations to busines...
Ten Organizational Design Models to align structure and operations to busines...Seta Wicaksana
 
8447779800, Low rate Call girls in Uttam Nagar Delhi NCR
8447779800, Low rate Call girls in Uttam Nagar Delhi NCR8447779800, Low rate Call girls in Uttam Nagar Delhi NCR
8447779800, Low rate Call girls in Uttam Nagar Delhi NCRashishs7044
 
Call US-88OO1O2216 Call Girls In Mahipalpur Female Escort Service
Call US-88OO1O2216 Call Girls In Mahipalpur Female Escort ServiceCall US-88OO1O2216 Call Girls In Mahipalpur Female Escort Service
Call US-88OO1O2216 Call Girls In Mahipalpur Female Escort Servicecallgirls2057
 
Appkodes Tinder Clone Script with Customisable Solutions.pptx
Appkodes Tinder Clone Script with Customisable Solutions.pptxAppkodes Tinder Clone Script with Customisable Solutions.pptx
Appkodes Tinder Clone Script with Customisable Solutions.pptxappkodes
 
8447779800, Low rate Call girls in Dwarka mor Delhi NCR
8447779800, Low rate Call girls in Dwarka mor Delhi NCR8447779800, Low rate Call girls in Dwarka mor Delhi NCR
8447779800, Low rate Call girls in Dwarka mor Delhi NCRashishs7044
 
TriStar Gold Corporate Presentation - April 2024
TriStar Gold Corporate Presentation - April 2024TriStar Gold Corporate Presentation - April 2024
TriStar Gold Corporate Presentation - April 2024Adnet Communications
 
Market Sizes Sample Report - 2024 Edition
Market Sizes Sample Report - 2024 EditionMarket Sizes Sample Report - 2024 Edition
Market Sizes Sample Report - 2024 EditionMintel Group
 
Church Building Grants To Assist With New Construction, Additions, And Restor...
Church Building Grants To Assist With New Construction, Additions, And Restor...Church Building Grants To Assist With New Construction, Additions, And Restor...
Church Building Grants To Assist With New Construction, Additions, And Restor...Americas Got Grants
 

Último (20)

Corporate Profile 47Billion Information Technology
Corporate Profile 47Billion Information TechnologyCorporate Profile 47Billion Information Technology
Corporate Profile 47Billion Information Technology
 
Traction part 2 - EOS Model JAX Bridges.
Traction part 2 - EOS Model JAX Bridges.Traction part 2 - EOS Model JAX Bridges.
Traction part 2 - EOS Model JAX Bridges.
 
Unlocking the Future: Explore Web 3.0 Workshop to Start Earning Today!
Unlocking the Future: Explore Web 3.0 Workshop to Start Earning Today!Unlocking the Future: Explore Web 3.0 Workshop to Start Earning Today!
Unlocking the Future: Explore Web 3.0 Workshop to Start Earning Today!
 
Chapter 9 PPT 4th edition.pdf internal audit
Chapter 9 PPT 4th edition.pdf internal auditChapter 9 PPT 4th edition.pdf internal audit
Chapter 9 PPT 4th edition.pdf internal audit
 
Fordham -How effective decision-making is within the IT department - Analysis...
Fordham -How effective decision-making is within the IT department - Analysis...Fordham -How effective decision-making is within the IT department - Analysis...
Fordham -How effective decision-making is within the IT department - Analysis...
 
8447779800, Low rate Call girls in Tughlakabad Delhi NCR
8447779800, Low rate Call girls in Tughlakabad Delhi NCR8447779800, Low rate Call girls in Tughlakabad Delhi NCR
8447779800, Low rate Call girls in Tughlakabad Delhi NCR
 
8447779800, Low rate Call girls in Kotla Mubarakpur Delhi NCR
8447779800, Low rate Call girls in Kotla Mubarakpur Delhi NCR8447779800, Low rate Call girls in Kotla Mubarakpur Delhi NCR
8447779800, Low rate Call girls in Kotla Mubarakpur Delhi NCR
 
Pitch Deck Teardown: Geodesic.Life's $500k Pre-seed deck
Pitch Deck Teardown: Geodesic.Life's $500k Pre-seed deckPitch Deck Teardown: Geodesic.Life's $500k Pre-seed deck
Pitch Deck Teardown: Geodesic.Life's $500k Pre-seed deck
 
Cyber Security Training in Office Environment
Cyber Security Training in Office EnvironmentCyber Security Training in Office Environment
Cyber Security Training in Office Environment
 
The-Ethical-issues-ghhhhhhhhjof-Byjus.pptx
The-Ethical-issues-ghhhhhhhhjof-Byjus.pptxThe-Ethical-issues-ghhhhhhhhjof-Byjus.pptx
The-Ethical-issues-ghhhhhhhhjof-Byjus.pptx
 
Annual General Meeting Presentation Slides
Annual General Meeting Presentation SlidesAnnual General Meeting Presentation Slides
Annual General Meeting Presentation Slides
 
Ten Organizational Design Models to align structure and operations to busines...
Ten Organizational Design Models to align structure and operations to busines...Ten Organizational Design Models to align structure and operations to busines...
Ten Organizational Design Models to align structure and operations to busines...
 
8447779800, Low rate Call girls in Uttam Nagar Delhi NCR
8447779800, Low rate Call girls in Uttam Nagar Delhi NCR8447779800, Low rate Call girls in Uttam Nagar Delhi NCR
8447779800, Low rate Call girls in Uttam Nagar Delhi NCR
 
Call US-88OO1O2216 Call Girls In Mahipalpur Female Escort Service
Call US-88OO1O2216 Call Girls In Mahipalpur Female Escort ServiceCall US-88OO1O2216 Call Girls In Mahipalpur Female Escort Service
Call US-88OO1O2216 Call Girls In Mahipalpur Female Escort Service
 
Appkodes Tinder Clone Script with Customisable Solutions.pptx
Appkodes Tinder Clone Script with Customisable Solutions.pptxAppkodes Tinder Clone Script with Customisable Solutions.pptx
Appkodes Tinder Clone Script with Customisable Solutions.pptx
 
8447779800, Low rate Call girls in Dwarka mor Delhi NCR
8447779800, Low rate Call girls in Dwarka mor Delhi NCR8447779800, Low rate Call girls in Dwarka mor Delhi NCR
8447779800, Low rate Call girls in Dwarka mor Delhi NCR
 
TriStar Gold Corporate Presentation - April 2024
TriStar Gold Corporate Presentation - April 2024TriStar Gold Corporate Presentation - April 2024
TriStar Gold Corporate Presentation - April 2024
 
Call Us ➥9319373153▻Call Girls In North Goa
Call Us ➥9319373153▻Call Girls In North GoaCall Us ➥9319373153▻Call Girls In North Goa
Call Us ➥9319373153▻Call Girls In North Goa
 
Market Sizes Sample Report - 2024 Edition
Market Sizes Sample Report - 2024 EditionMarket Sizes Sample Report - 2024 Edition
Market Sizes Sample Report - 2024 Edition
 
Church Building Grants To Assist With New Construction, Additions, And Restor...
Church Building Grants To Assist With New Construction, Additions, And Restor...Church Building Grants To Assist With New Construction, Additions, And Restor...
Church Building Grants To Assist With New Construction, Additions, And Restor...
 

Digital Marketing Optimization Survey

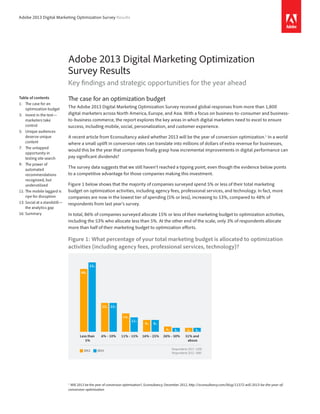
  • 1. Adobe 2013 Digital Marketing Optimization Survey Results Adobe 2013 Digital Marketing Optimization Survey Results Key findings and strategic opportunities for the year ahead The case for an optimization budget The Adobe 2013 Digital Marketing Optimization Survey received global responses from more than 1,800 digital marketers across North America, Europe, and Asia. With a focus on business-to-consumer and business- to-business commerce, the report explores the key areas in which digital marketers need to excel to ensure success, including mobile, social, personalization, and customer experience. A recent article from Econsultancy asked whether 2013 will be the year of conversion optimization.1 In a world where a small uplift in conversion rates can translate into millions of dollars of extra revenue for businesses, would this be the year that companies finally grasp how incremental improvements in digital performance can pay significant dividends? The survey data suggests that we still haven’t reached a tipping point, even though the evidence below points to a competitive advantage for those companies making this investment. Figure 1 below shows that the majority of companies surveyed spend 5% or less of their total marketing budget on optimization activities, including agency fees, professional services, and technology. In fact, more companies are now in the lowest tier of spending (5% or less), increasing to 53%, compared to 48% of respondents from last year’s survey. In total, 86% of companies surveyed allocate 15% or less of their marketing budget to optimization activities, including the 53% who allocate less than 5%. At the other end of the scale, only 3% of respondents allocate more than half of their marketing budget to optimization efforts. Figure 1: What percentage of your total marketing budget is allocated to optimization activities (including agency fees, professional services, technology)? Respondents 2013: 1,858 Respondents 2012: 1686 13% 2012 2013 53% 22% 11% 9% 3% 3% 48% 22% 14% 9% 4% 3% 51% and above 26% - 50%16% - 25%11% - 15%6% - 10%Less than 5% 1 Will 2013 be the year of conversion optimisation?, Econsultancy, December 2012, http://econsultancy.com/blog/11372-will-2013-be-the-year-of- conversion-optimisation Table of contents 1: The case for an ­optimization budget 3: Invest in the test— marketers take control 5: Unique audiences deserve unique content 7: The untapped ­opportunity in testing site search 9: The power of ­automated ­recommendations recognized, but u­nderutilized 11: The mobile laggard is ripe for disruption 13: Social at a ­standstill— the analytics gap 16: Summary
  • 2. 2Adobe 2013 Digital Marketing Optimization Survey Results With the bias toward ploughing marketing budget into media-thirsty marketing activities higher up the funnel, it is no wonder that conversion rates are so low for so many companies. Figure 2 shows that the average site conversion rates are below 1% for 35% of the companies. But Table 1 shows that companies spending more on optimization are reaping the benefits, with those investing more than 25% of marketing budgets in this area being twice as likely to enjoy higher levels of conversion rates. Figure 2: What is your average website conversion rate? 20% 15% 21% 26% 9% 9% Less than 0.5% 0.5% - 0.9% 1% - 1.9% 2% - 4.9% 5% - 8.9% 9% and above Respondents: 1,858 In Table 1 below, we see that only 16% of those who allocate up to 25% of their marketing budget for optimization enjoy average website conversion rates of 5% and above, compared to 39% of those who allocate more than a quarter of marketing budget to this area. Table 1: Average website conversion rates and proportion of marketing budgets allocated to optimization. Average website conversion rate % of total marketing budget allocated to optimization Up to 25% More than 25% Less than 0.5% 21% 7% 0.5% - 0.9% 16% 10% 1% - 1.9% 21% 16% 2% - 4.9% 26% 28% 5% - 8.9% 8% 18% 9% and above 8% 21% Respondents: 1,858 More than half of North American companies allocate less than 5% of their marketing budgets to optimization, while only a fifth allocate between 6% and 10%, compared to 27% of their European counterparts. Despite this, North American respondents are more likely to indicate high levels of conversion rates, with 10% saying that their conversion rates are 9% or above. What is holding back investment in optimization activities? As well as best-of-breed technology, the right processes need to be in place and, crucially, the right people with the right skills within the business need to be incentivized to improve digital performance. Businesses need to instill a culture of testing and robust analytics, with a microscopic focus on measuring incremental improvements to justify further investment in resources and technology.
  • 3. 3Adobe 2013 Digital Marketing Optimization Survey Results The good news is that the technology and tools to optimize digital marketing performance are becoming more user-friendly, enabling quick wins from multivariate and A/B testing of different variations of creative, images, layouts, videos, and calls to action. Marketers are also getting better at using both real-time behavioral and existing customer data to segment website visitors, targeting the right content at the right visitors at the right time. Invest in the test—marketers take control Optimizing conversion rates hasn’t always been easy: it’s detailed, can be repetitive, requires a lot of iterations, and can even cause political battles. But what most don’t realize is that it’s one of the most rewarding efforts if prioritized and done strategically. Although testing is the core of any optimization program, Figure 3 demonstrates that for 49% of the survey respondents, testing is not yet a priority at their company, with only 11% indicating that testing has been adopted as a form of decision-making company-wide (up by only 1% since last year’s survey). While it still looks like quite a bleak picture, it is worth noting that marketing is increasingly leading the charge, with 16% of respondents saying that marketing departments have adopted testing as a form of decision-making. Figure 3: How would you describe your organization’s current approach to testing? Respondents 2013: 1,858 Respondents 2012: 1686 52% 49% 13% 16% 12% 12% 10% 11% 11% 14% 2012 2013 Testing is not a priority in my company yet The marketing department has adopted testing as a form of decision-making My team has adopted testing as a form of decision-making My organization has adopted testing as a form of decision-making company-wide I have adopted testing as a form of decision- making More than half (53%) of survey respondents describe their testing process as manual, while 9% say they either don’t test or haven’t implemented a testing process. Only 32% of respondents in Asia Pacific suggest that testing is not a priority at their company, compared to 54% of their North American and 46% of their European counterparts. They are also almost twice as likely to indicate that marketing departments have adopted testing as a form of decision-making. However, when looking at primary testing processes, respondents in Asia Pacific are also least likely to say they either test or implement a testing process. When looking at the bigger picture, only 12% of those who don’t have a testing process or don’t run any tests enjoy average website conversion rates of 5% and above. Table 2 shows that average conversion rates are below 1% for 59% of the companies who don’t invest in testing or don’t have a strategic, structured process in place.
  • 4. 4Adobe 2013 Digital Marketing Optimization Survey Results Table 2: Average website conversion rates and testing processes (cross-tabulation) Average website conversion rate How organizations describe their primary testing processes No process or don't test Multiple departments have input in testing process Less than 1% 59% 20% 1% – 4.9% 29% 47% More than 5% 12% 33% Respondents: 1,858 What are the main barriers to adopting or improving testing processes? Survey results reveal that budget and resource availability have remained the most challenging areas when it comes to testing, with just under half (45% and 42%, respectively) of digital marketers saying that they are “very challenging.” Knowing how to test effectively is the third most challenging area, with 82% of respondents saying that this poses a challenge for their organizations. European respondents are least likely to perceive testing processes that are not scalable or manageable as a challenge, with a quarter saying that this is “not at all challenging,” compared to 19% of North American and 16% of APAC respondents. Figure 4: How challenging are the following when it comes to testing? Determining significance of test results Testing process is not scalable/managable Knowing how to test effectively Resource availability (creative, technical) Budget 14%41%45% 13%45%42% How challenging are the following when it comes to testing? Respondents: 1,858 Very challenging Somewhat challenging Not at all challenging 37% 45% 17% 33% 47% 19% 31% 48% 20% When looking specifically at organizations who haven’t made testing a priority yet, budget emerges as a major challenge for 53% of the respondents. This is followed closely by knowing how to test effectively, with half of those companies saying that this is very challenging. At the other end of the spectrum, organizations who involve multiple departments in the testing process are most likely to say that determining the significance of test results is not a challenge for them (29% compared to around a fifth of those for which testing is confined to one team). Companies should start with small wins and grow from there. It’s about optimizing every interaction and every conversion event that move the customer to the end goal. In fact, failed tests are just as impactful in the lessons learned.
  • 5. 5Adobe 2013 Digital Marketing Optimization Survey Results The practice of optimization is not only about the small changes you can make to improve the way a user experiences your website. It is also about how the company itself approaches it. If each department runs small tests with different agendas and optimization goals—mainly to validate their own investment decisions instead of making a real difference—the result will likely be an inefficient use of resources. Adopting a cross- departmental approach to testing can improve the chances of higher levels of conversion rates. A third of the companies in which multiple departments have input in testing processes say that their conversion rates are 5% or above, compared to 18% of all companies, as shown in Figure 2. Similarly, 28% of those who adopted testing as a form of decision-making company-wide are enjoying conversion rates of 5% or above. However, this doesn’t mean that you need to promote and facilitate testing in the whole organization from the very beginning. This is no small feat, and most will resist change. But involving key people or groups and, most importantly, explaining to the rest why and how you are doing this, is a great starting point. Unique audiences deserve unique content Content is the engine of inbound marketing. The techniques that attract attention instead of demanding it are growing in importance as the efficiency of paid media erodes. The new emphasis on engagement means that marketers should view how they target and deliver content as a strategic capability within their optimization program. Looking at the statistics below, it’s clear that most companies still largely rely on individuals to decide how, when, and where content is delivered. • In just over half (51%) of the companies surveyed, marketing executives (vice presidents or higher) typically determine which promotional or marketing content is displayed on their sites and in their marketing communications. Respondents in Asia Pacific are almost twice as likely than their North American counter- parts to say that heads of online marketing determine how content is displayed (38% compared to 22%). • According to the vast majority (87%) of digital marketers surveyed, less than half of their onsite visitors receive targeted content, including 65% who say they receive less than 20%. • Around a fifth (22%) of survey respondents automate the personalization of content to site visitors based on their profile or behavior, up by 5% since last year’s survey. • More than half (55%) of digital marketers say personalization is “very” or “somewhat” important to the long-term goals of their organization, with North American respondents being more likely to say that this is very important. Over half (53%) of APAC respondents say that this is not important. Figure 5: Who or what determines which promotional/marketing content is displayed on your site and in your marketing communications? 51% 27% 22% 16% 13% 13% 12% 10% 9% 8%Formal committee Periodic (time or calendar based) Agency or consultants Metrics or performance-based Various departments lobbying for online space Informal group of stakeholders No process Creative department Head of online marketing Marketing executives (VPs or higher) Respondents: 1,858 Today, content is managed in very organic ways, but every other scaled digital tactic has eventually migrated toward automation. Will content evolve in the same way? Technologies certainly exist, but is there a requirement for most organizations?
  • 6. 6Adobe 2013 Digital Marketing Optimization Survey Results The real question, at least for most consumer-facing organizations, isn’t if but when. The surge in user- generated and inbound marketing content demands that marketers put rules in place to satisfy multiple audiences and to justify the costs of content in the first place. Figure 6: What percentage of onsite visitors receive targeted content? 66% and above 51% - 65%36% - 50%21% - 35%Less than 20% 4% 9%10% 12% 65% Respondents: 1,858 Even for organizations that don’t see themselves as heavy content marketers, it’s time to think ahead about how customers and prospects will be consuming content and the implications for personalization and optimization. • Mobile—A theme throughout this year’s study is that mobile changes the personalization equation. A “nice to have” on the desktop, personalization is essential for mobile where users’ attention and ability to navigate is limited. Mobile also introduces location as a powerful variable for what content to deliver. For example, if a consumer is in a building supply store, that’s a more powerful indicator of interest than any demographic or third-party profile. • Growth in content volume—As brands get drawn into becoming publishers, they face some of the same issues. One of those is volume. Consumer brands have been contending with the scale of their content efforts since day one, but going back just a few years, a B2B company that focused on lead generation might have offered only a few white papers. Today however, it’s likely that they’ve dramatically expanded their content assets, adding web events, videos for owned and earned media, podcasts, searchable slide decks, blog content and, of course, social and user-generated content. As the options grow, it becomes increasingly difficult to manually determine what belongs where at the site level, let alone for audience slices or individuals. Organizations have made dramatic leaps in the creation and aggregation of content, but all too often they don’t enjoy a long-term benefit: Content is premiered and featured for a short time and then left to sink into the depths of the CMS, where only highly specific searches can find it. • Batch and blast doesn’t work—Digital attention spans are short; competition for attention is fierce; and expectations for easy relevance are high. That’s not an environment for one-size-fits-all. Fortunately, this doesn’t always mean serving entirely different content for specific audiences. It may simply require different packaging, descriptive language, or editing.
  • 7. 7Adobe 2013 Digital Marketing Optimization Survey Results Two-thirds of respondents indicated that their customers had a “very” (15%) or “somewhat” (42%) positive reaction to targeting and personalization efforts. Only 3% of marketers surveyed say that their customers have reacted negatively to their targeting efforts. Our analysis shows that companies that say their customers react “very positively” to their targeting efforts have higher conversion rates and invest more as a percentage of their marketing budget than others. Contrary to received wisdom in some quarters, targeting (done sensibly and appropriately) can improve customer satisfaction and conversion rates rather than ticking customers off. Figure 7: How have your customers reacted to your targeting or personalization efforts? Very negative Somewhat negative No opinionSomewhat positive Very positive 3% 0% 39% 42% 15% Respondents: 1,858 Two-thirds of the respondents who target content to more than 65% of their visitors report conversion rates of 2% or above, including a third who say their conversion rates are at least 5%. This compares to 36% of those who say less than 20% of their onsite visitors receive targeted content. Only 13% of these report conversion rates of 5% or above. Most sites do not deliver targeted content to most visitors, failing to take advantage of a number of powerful options for optimization. In fact, 65% of the digital marketers surveyed said that less than 20% of their audiences are served targeted messaging, as seen in Figure 6. User profiles, stated preferences, behavior, social graph data and, in some cases, location all provide meaningful foundations for business rules that help site visitors engage with content that’s meaningful to them. The metaphor of content as a magnet is common—and accurate. But magnets don’t have equal pull. Optimizing content is the difference between a powerful pull on consumers’ attention and one that lets them easily slip away. The untapped opportunity in testing site search Site search hasn’t been the topic of much discussion or research in recent years, but it’s a fundamental aspect of findability and one that may well be getting more important. Conventional wisdom suggests that site visitors will choose navigation over internal search to conduct most tasks. But conventional wisdom doesn’t always reflect reality, and it can often miss changes in the marketplace. A primary issue for marketers is ignorance. Over half are unaware of the impact of site search techniques beyond the baseline functionality of keyword matching. When looking at the effectiveness of techniques by region, European respondents emerged as least likely to say their onsite search is “very effective” based on high-converting items (26%) and top-rated content or products (16%). With modest traffic figures on most sites, site search isn’t a priority, but there are reasons to believe that optimization of site search can have a significant impact today and a growing one over time.
  • 8. 8Adobe 2013 Digital Marketing Optimization Survey Results Mobile is changing when we use navigation. Navigation works best when it offers specific routes to content. It’s in the nature of mobile site design that menus get compressed and simplified to keep real estate manageable on the small screen. With fewer menu options, users might be more likely to search for their specific content. For similar reasons, mobile means more home page visitors and fewer clicks to destination pages. Studies of mobile searchers show that they’re more likely to click on only paid and top organic listings, probably because there’s less room (and patience) for a full page of results. That means that they’re more likely to find themselves on home and category levels instead of more deeply linked pages. The more general the page, the more likely site search is used to narrow the focus. Not all visitor segments are created equal. Most sectors find their buyers conforming to some variation of the 80/20 rule, with the majority of purchases associated with a minority of customers. Depending on how that group behaves, site search could be less important than the gross traffic numbers indicate. Regular and returning customers might be more likely to use site search to find products they already know or expect on a site with which they’re familiar. The reverse might also be true. But without testing, it’s an open and important question. Specific searches correlate with high conversion. Multiword (or long tail) searches tend to show higher conversion rates than more general ones, for obvious reasons. The first order of business is to determine whether that’s as true for site-search users as it is for deep-linked visitors arriving from external search engines. If this proves to be the case, there are opportunities for optimization on the specific purchase as well as adding to the overall value of the shopping cart. If it’s not the case, it’s worth finding out why before deciding on whether to invest in optimization. Figure 8: How effective is your onsite search based on the following? Respondents: 1,858Very effective Somewhat effective Less effective 15% 19% 17% 23% 21% 20% 28% 49% 49% 52% 49% 54% 57% 58% 35% 31% 31% 28% 25% 24% 14% Keyword matching Top rated content or products Product or service availability PromotionsTargeted results based on user profile High converting items Customizable business metrics (KPIs) Figure 8 demonstrates that there are a number of effective options for optimizing site search results. Marketers who test these options may find that different audiences respond to different optimization techniques and that different scenarios call for different rules. For example, a retailer might aim for revenue maximization at the end of a quarter while seeking to move older inventory in the post-holiday period. The first step for any type of site is to make a concerted effort to understand the current role of site search for different segments and evaluate the role it might play in growth.
  • 9. 9Adobe 2013 Digital Marketing Optimization Survey Results The power of automated recommendations recognized, but underutilized Displaying recommendations is often thought of solely as a merchandising strategy most applicable to e-commerce. While that is the typical application seen today, it certainly is not limited to digital commerce or retail. Consumers embrace content and item recommendations because they deliver value that is meaningful and practical. Organizations should embrace this power of suggestion; while helpful to the customer, recommendations are a proven way of dramatically improving engagement and conversion goals. Figure 9 reveals that while e-commerce businesses continue to lead in recommendations adoption, other industries such as media and financial services (with primary business goals excluding selling items online) are recognizing the value of automated recommendations and planning to implement this year. Figure 9: Do you currently use automated recommendations in your business? 20.4% 17.4 % 16.5 % 19.1 % 1.7 % 3.3% Financial Services (primary goal all excluding e-commerce) Media (primary goal excludes e-commerce) E-commerce (all responses across industries whose primary business goal is selling items online) Using automated recommendations now Intend to deploy this year E-commerce: 393 / Media: 172 / Financial services: 91Respondents: Whether suggesting articles based on a visitor’s previous reading patterns, help resources based on recent sign-ups, or presenting tempting cross-sell offers based on a shopper’s affinity for certain products, marketers across industries can leverage recommendations as a way to engage and converse with a visitor through to conversion. Despite this, 38% of digital marketers do not use any content or product recommendations, which is flat from 2012. Automated recommendations engines often provide marketer-control and flexibility to power delivery of relevant suggestions optimized for critical engagement areas of a website, as well as other digital channels such as mobile applications, social networks, and email. Yet, the survey data shows consistently year over year that for marketers deploying recommendations: · Most are focusing on at top of funnel locations such as the home page, category pages, product pages, or article pages. Figure 10: Where are you displaying product/content recommendations? 49% 36% 32% 16% 9% 7% 5% 5% 45% 47% 38% 21% 10% 7% 6% 7% User profile page Confirmation page Checkout page Shopping cart Search results page Category page Product or article page Home page 20132012 Respondents 2013: 1,858 Respondents 2012: 1,686
  • 10. 10Adobe 2013 Digital Marketing Optimization Survey Results · Primary recommendations featured are top-selling or most popular and new items or content Figure 11: Upon which criteria are your product or content recommendations based? 38% 35% 35% 24% 19% 18% 18% 38% 33% 33% 25% 20% 16% 18% Related product or content characteristics Past behavior or individual visitor Based on what other customers have viewed or purchased Promotional products or company highlighted content Newly available content Top selling products or most popular content No recommendation tool or process in place 20132012 Respondents 2013: 1,858 Respondents 2012: 1,686 · Nearly half do not optimize their recommendation strategies, and rely heavily on manual updates. Only 18% are using an automated approach. Figure 12: How do you optimize the relevance of your recommendations? Respondents: 2013: 1,858 2012: 1,686 13% 2012 2013 48% 26% 19% 18% 18% 53% 26% 17% 19% 18% Use automated business rules (e.g. seasonal inventory, profit margins, top rated content) Visitor profile information Behavioral activity Manually update recommendations No optimization Recommendations is a natural, yet underutilized personalization tactic. Combining marketer-defined and automated approaches to optimize relevant recommendations across channels encourages consumers to engage with a brand, builds confidence and loyalty, and removes barriers to initial and supplementary conversions.
  • 11. 11Adobe 2013 Digital Marketing Optimization Survey Results The mobile laggard is ripe for disruption A recent Adobe Digital Index report analyzing more than 100 billion visits to more than 1,000 websites worldwide revealed that tablets now exceed smartphones in global web traffic. Because consumers spend more time engaging with tablet devices, marketers should be prioritizing tablet-optimized experiences in 2013.2 During 2012, the Adobe Analytics business observed a doubling of traffic from mobile devices, and this trend is reflective of many clients. However, almost half (45%) of digital marketers surveyed say their organizations don’t have a mobile-optimized site or mobile application, relying on desktop sites only. Only 7% have built mobile apps, and a fifth (21%) have implemented both a mobile-optimized site and a mobile app. By not investing in mobile channels, organizations risk being left behind as mobile consumers choose a competitor’s mobile-friendly experience. Separate research exploring digital trends for 2013 showed that while mobile optimization is an exciting opportunity for 43% of the companies surveyed, only 30% consider it a top priority in 2013.3 Figure 13: What type of mobile channel does your business have? None of the above - use desktop site BothMobile applicationMobile optimized website 45% 21% 27% 7% Respondents: 1,858 Figure 14 shows that average mobile conversion rates are below 1% for more than half (57%) of companies, including 41% who say they are below 0.5%. Further interrogation of the data showed that companies investing in mobile-optimized sites are three times more likely to be enjoying mobile conversion rates of 5% or above than those who rely on desktop sites. Not surprisingly, those who use both a mobile-optimized site and a mobile app are experiencing even higher levels of conversion. As Asia consumers come online, they do so most often via mobile devices, leapfrogging the fixed Internet stage as seen in developed markets. It comes as no surprise then that APAC respondents indicate not only higher usage of mobile-optimized websites, but also higher levels of mobile conversion rates. Half (49%) of APAC marketers surveyed say that they enjoy mobile conversion rates of at least 1%, including 28% with conversion rates of 2% or above. 2 Tablets trump smartphones in global website traffic, Adobe Digital Marketing Blog, March 2013, http://blogs.adobe.com/digitalmarketing/digital- index/tablets-trump-smartphones-in-global-website-traffic 3 Quarterly Digital Intelligence Briefing: Digital Trends for 2013, Econsultancy and Adobe, January 2013, http://success.adobe.com/en/uk/programs/ products/digitalmarketing/1301-28808-econsultancy-digital-trends-for-2013.html
  • 12. 12Adobe 2013 Digital Marketing Optimization Survey Results Figure 14: What is your average mobile conversion rate? 9% and above 5% - 8.9%2% - 4.9%1% - 1.9%0.5% - 0.9%Less than 0.5% 16% 4% 5% 18% 16% 41% Respondents: 1,858 As shown in Figure 15, despite the correlation between the use of certain mobile channels and higher levels of mobile conversion rates, 30% of digital marketers consider mobile apps very effective at increasing conversion rates. Survey data also suggest that advertising promotions, bar-coded coupons, and QR codes are most effective at having a positive impact on conversion rates, with the vast majority saying they’re “somewhat’” (49%) or “very” (34%) effective. While large companies are already addressing the rapidly expanding mobile audience, most businesses are only dipping their toe in the water. The reasons behind the slow progress are various, ranging from not knowing where to start, to being bogged down in complex mobile initiatives that eat up a lot of time and budget. If your organization has just started its foray into mobile, don’t start building a mobile site or app just because your competitors have. Engage with your analytics team and evaluate the mobile device types (feature phones, smartphones, tablets) that are visiting your desktop website and the trending of mobile traffic over the past year. Bear in mind that low mobile-browser traffic might not necessarily indicate that your mobile audience is small. It could be that your website just doesn’t perform well on smaller screens, and this is driving visitors away. Don’t build an app just for the sake of it. Focus on the goal of your mobile initiatives, prioritize your company’s needs, and choose a solution that can best address these needs now and into the future. As the Digital Trends for 2013 report highlighted: “To move forward in ‘mobile optimization’ means coming to grips with the reality that every experience we offer through digital channels—every web page, shopping cart and piece of rich content—must work well on any device in any location. The customer understands that concessions need to be made for the smaller screen, touchscreen input and slower speed, but they won’t accept unnecessary hassle or delay. Apps are a part of today’s approach to mobile, but they are not a broad answer to this challenge, as use of the mobile web increases daily.”
  • 13. 13Adobe 2013 Digital Marketing Optimization Survey Results Figure 15: How effective are these mobile tactics for increasing conversion rates? 20% 17% 19% 23% 23% 26% 24% 24% 26% 40% 49% 47% 46% 47% 47% 51% 52% 50% 40% 34% 34% 31% 30% 27% 25% 25% 24%Mobile optimized website Customer ratings or reviews Location-based marketing Videos Mobile app Catalogs optimized for mobile Social sharing (e.g. Facebook, Twitter, Pinterest icons on pages) Advertising promotions, bar-coded coupons, and QR codes Check-in rewards Respondents: 1,858 Very effective Somewhat effective Less effective Many companies choose to focus on form over function, not realizing that a mobile site needs to address customers’ needs and facilitate the key functional requirements of the main site. If your visitors are typically looking for certain specs in product descriptions, make sure that you provide this information in a format that is easily accessible on mobile devices. Simple design and flawless execution are paramount. In a mobile market that is evolving quickly, there are no guarantees that the choice you make today will be the right one for your organization in the future. But focusing on your overarching business objectives, user experience, and customer expectations helps ensure that the odds are in your favor. Social at a standstill—the analytics gap Chances are that social at your company hasn’t been a complete success. One reason is that the term includes a variety of internal and external activities on Facebook, Twitter, Pinterest, and YouTube as well as on owned media. At some organizations, social even includes display ads on social networks, though it shouldn’t. It’s a challenge to reconcile and understand the real impact of all those pieces. The real problem is the gap between what marketers believe and what they know. Most companies still fly blind, equating limited and flawed measures (volume of followers, for example)—or no measures at all—with success or failure. Figure 16: Which customer experience measurement and optimization tactics do you currently use? Other Attribution modeling Onsite survey Mobile analytics Testing Social media analytics Website analytics 83% 47% 31% 22% 20% 6% 5% Respondents 2013: 1,858 Respondents 2012: 1,686
  • 14. 14Adobe 2013 Digital Marketing Optimization Survey Results In study after study, marketers report that it’s challenging to measure the return on their social efforts, and it’s not just a problem for smaller companies. Even at organizations with revenues over $150 million, 71% of marketers agreed with the statement that “measuring the impact of social media marketing is very difficult.”4 This challenge breaks into two parts: the nature of social, and the tools we use (or don’t). Social is becoming the defining channel of the inbound marketing age. It’s where customers meet the brand and the closest thing to a true two-way relationship that exists online. It’s where companies measure sentiment, deal with service issues, discover the problems and potential of products, and try to activate word-of-mouth marketing from their more avid fans. But for all that activity, social interactions tend to happen somewhere in the middle of the customer journey (or mid-funnel), not immediately before the conversion event. Few companies (6% of this sample) are in a position to conduct the kind of attribution modeling to understand the interactions between social and the other channels that are in the mix. If companies are doing attribution at all, it’s most likely around the last click prior to purchase, and therefore, undercounting the influence of helping tactics, like social and email. The more common approach to measuring social is to apply analytics tools designed for the purpose. These range from free, limited approaches to enterprise-ready platforms, but collectively they still represent only 47% of the market, virtually unchanged since last year’s study, as Figure 16 shows. On-site social activity, including tactics ranging from user reviews to social sharing buttons, does not garner as much media attention, but this is an area which can have a more direct and measurable impact on the bottom line than an off-site media presence. Of course, on-site and off-site social media activities are often inextricably linked, with the atomization of the web blurring the boundaries between owned, earned and paid for media. The power of social sharing functionality is evident from Figure 17 which shows that changes to the way this is presented can have a bigger impact on conversion rates than a range of other elements that contribute to the digital experience. Social sharing (social sharing icons on pages) is deemed to be the most effective test variable for increasing conversion rates, with two in five companies saying that this is very effective and a further 44% saying that it’s somewhat effective. Figure 17: How effective are each of the following at increasing conversion rates? 17% 16% 19% 24% 24% 25% 35% 31% 41% 40% 33% 44% 47% 48% 48% 48% 49% 48% 52% 44% 46% 56% 39% 37% 33% 28% 28% 26% 17% 17% 15% 14% 11%Page layouts Photos or images Offers or promotions Page copy CTAs Navigation elements Steps/pages in conversion process Homepage hero image Form fields Third-party credibility indicators (e.g. security seals) Social sharing (e.g. social sharing icons on pages) Respondents: 940 Very effective Somewhat effective Less effective By synchronizing off-site and on-site social media activity, companies are increasingly using social data to augment the implicit and explicit information they already have about website visitors. With a website visitor’s permission, marketers can drill into a rich well of social intelligence enabling, for example, publishers to recommend more relevant articles and retailers to showcase more appealing products. 4 Quarterly Digital Intelligence Briefing: Managing and Measuring Social, Econsultancy and Adobe, September 2012, http://success.adobe.com/en/na/ programs/products/digitalmarketing/offers/1208_22970_econsultancy_social_dib.html
  • 15. 15Adobe 2013 Digital Marketing Optimization Survey Results Separate research carried out by Econsultancy and Adobe5 last year showed that personalization of the web experience using social data can be a very effective way of boosting ROI. According to that research, only 6% use social graph (i.e. Facebook) data for personalization, though 88% say the impact on both ROI and engagement is high. Figure 18 below shows a range of social media strategies and tactics, and how effective they are at increasing conversion rates. Again, social sharing can be seen to be worth its weight in gold when it comes to boosting conversion rates. European respondents are most likely to find it effective, with 43% saying that it’s very effective (compared to 37% of all companies). Figure 18: How effective are these social media tactics on your site in increasing conversion rates? 17% 19% 18% 20% 17% 18% 22% 46% 44% 45% 44% 50% 51% 49% 37% 37% 37% 36% 32% 31% 29%User comments, reviews, or ratings Blogs and social community pages Collaborative custom product design (items, sets, outfits, etc.) User-generated content (images, video, audio) User-created collections for sharing and purchase Live chat or instant messaging Social sharing (e.g. Facebook, Twitter, Pinterest icons on pages) Respondents: 1,858 Very effective Somewhat effective Less effective Social-specific technologies address a variety of different functions, from workflow and asset management, to sentiment analysis and full-blown customer relationship management (CRM) integration. But underneath all these must be the ability to associate customers’ social interactions with meaningful business goals. Vague definitions of engagement and follower growth are increasingly less likely to satisfy senior executives. Marketers recognize a gap in their knowledge and seem poised to do something about it. Almost one-third of the sample reported their organization’s intent to implement some type of social media analytics. Marketing departments that don’t grapple with how to consistently evaluate what social means for them may soon find themselves in the worst-case scenario of being judged by the flawed benchmarks they’re using for lack of anything better. 5 Quarterly Digital Intelligence Briefing: Personalization, Trust and Return on Investment, Econsultancy and Adobe, June 2012, http://econsultancy.com/ reports/quarterly-digital-intelligence-briefing-personalisation-trust-and-roi
  • 16. Summary Despite the need for and proven competitive advantages of digital marketing optimization, businesses still lag in prioritizing investment in such a strategic program. With optimization technology and marketer skills continuing to advance, it is becoming easier than ever to test, tailor, and deliver an enhanced experience throughout the customer journey that is guaranteed to make an impact to top- and bottom-line revenues. As you plan your strategic marketing initiatives for the year ahead, it is important to consider these key takeaways: • Testing is the core of any personalization and optimization program. Start with small wins, and expand efforts from there; failed tests are just as impactful in lessons learned. • Optimized targeting breeds customer satisfaction and conversion. Leveraging consumer data such as stated preferences, past and current onsite behavior, social graphs, and location can assist in tailoring content that resonates with visitors and pulls them to interact. • Site search is an untapped opportunity for optimization; navigation works best when it offers specific routes to content. By testing and tailoring site search tactics including keyword matching, promotion of high converting items, and user profile targeted results , you can unveil the optimal experience to deliver a visitor to maximize conversion and revenue. • Automated recommendations is not just for digital commerce; all industries can realize the benefits of this natural personalization strategy. Powering relevant suggestions across all digital channels is a proven way to increase consumer engagement, confidence, and loyalty with a brand. • Nearly every consumer is a mobile consumer—is your mobile presence optimized? Determine the goal of your mobile initiatives; look at your analytics; and decide which mobile tactics best address your businesses needs now and in the future. · Don’t fly blind when it comes to social. Use moderation and measurement tools to guide conversations toward a positive impact for your business. Adobe Systems Incorporated 345 Park Avenue San Jose, CA 95110-2704 USA www.adobe.com Adobe and the Adobe logo are either registered trademarks or trademarks of Adobe Systems Incorporated in the United States and/or other countries. Java is a trademark or registered trademark of Oracle and/or its affiliates. All other trademarks are the property of their respective owners. © 2013 Adobe Systems Incorporated. All rights reserved. Printed in the USA. 4/13