SlideShare a Scribd company logo
1 of 18
REPORT PERIOD:
Average Facebook
page fan growth
rates for seven
industries
REPORT PERIOD: OCTOBER, 2016
ZuumSocial.com
65 Facebook pages across 7 industries.
Industries covered in this report are soft drinks,
consumer electronics, hospitals, luxury fashion,
snack foods, pet foods and tourism.
16 November, 2016
About
What’s in this report may surprise a few people.
Especially if you’ve been reading the headlines about
Facebook is still growing users globally.
But what you’ll see here is of the 65 pages in 7
industries we analyzed in this report, a significant
number of them are showing negative fan growth for
October of 2016.
The next page is a summary of report, followed by the
industry rankings, and then each of the industries
broken out page by page.
Charts for each industry show the brands, fan counts,
growth rate, and net change in fans.
We wrap up with a detailed view of some of the key
Facebook pages in the report, assessing their fan loss
curves and considerations for why that might be
happening.
Average Facebook page fan growth rates for 7 industries
Sections
❖ Summary
❖ Industry rankings
❖ Consumer Electronics
❖ Luxury Fashion
❖ Pet Foods
❖ Snack Foods
❖ Soft Drinks
❖ Hospitals
❖ Tourism
❖ Detailed views of pages dropping fans
Summary
❖ 19 of 65 Facebook pages in this report lost fans in October. That’s 29% of the
pages.
❖ Our previous report on social media fan growth in February 2016 showed earlier
indication of this drop in fan count trend.
❖ Our February 2015 report on social network fan growth shows a much more
positive fan growth rate for Facebook for virtually all industries.
❖ Facebook is still experiencing user growth. So it’s not like the network is falling
off the face of the earth.
❖ The number of brand pages with dropping fan counts could be something
Facebook noticed, and sensing fans were seeing too much of brands and their
content, scaled back the Facebook brand page impressions fans will see, as they
recently announced.
❖ Only 2 of the 7 industries we analyzed had negative average fan growth.
Average Facebook page fan growth rates for 7 industries
Industry Analysis
Industry overview and industry by industry breakout
Average Facebook page fan growth rates for 7 industries
Industry Rankings
Average Facebook page fan growth rates for 7 industries
Overall growth is positive --
about ⅓ of a percent.
Two industries, however, are
in the red. Snack Foods and
Soft Drinks. Pet Foods is just
about flat.
Does this indicate a declining
interest in Facebook, or is
there some other factor.
We’ll look at each industry,
and then take a closer look at
some of the individual
brands.
Industry Avg Fans Avg Growth Rate Avg Change in Fans
Hospitals 361,464 1.53% 5,530
Luxury Fashion 11,037,260 0.58% 64,016
Consumer Electronics 3,349,772 0.47% 15,744
Average 5,645,305 0.34% 8,924
Tourism 862,866 0.07% 4,228
Pet Foods 670,634 0.01% 67
Snack Foods 15,478,891 -0.09% -13,931
Soft Drinks 7,756,251 -0.17% -13,186
Consumer Electronics
Average Facebook page fan growth rates for 7 industries
Only one account is losing
fans -- Nokia -- but it happens
to be the page with the
largest fan count, by a wide
margin.
Page Fans Fan Growth Rate Change in Fans
Pioneer Electronics (North America) 102,580 1.14% 1,169
HP 4,018,431 0.98% 39,381
Bose 1,660,983 0.80% 13,288
Average 3,349,772 0.47% 15,744
Vizio 245,179 0.45% 1,103
Canon 1,194,562 0.38% 4,539
Sony 7,430,730 0.32% 23,778
Panasonic 339,990 0.31% 1,054
Philips 416,473 0.26% 1,083
GoPro 4,864,302 0.15% 7,296
Nokia 13,224,494 -0.11% -14,547
Luxury Fashion
Average Facebook page fan growth rates for 7 industries
This industry is looking more
robust. No brands in the red,
and an average growth rate of
over ½ percent.
CHANEL leads the pack with
both the highest growth rate
and biggest increase in fans.
Page Fans Fan Growth Rate Change in Fans
CHANEL 14,567,617 1.68% 244,736
Versace 4,444,033 0.82% 36,441
Calvin Klein 8,690,142 0.72% 62,569
Marc Jacobs 1,835,632 0.71% 13,033
Average 11,037,260 0.58% 64,016
Dior 15,501,658 0.49% 75,958
Armani 6,800,393 0.46% 31,282
Dolce & Gabbana 10,777,817 0.33% 35,567
Louis Vuitton 18,798,911 0.26% 48,877
Gucci 13,366,906 0.25% 33,417
Burberry 15,589,491 0.04% 6,236
Pet Foods
Average Facebook page fan growth rates for 7 industries
Five of eight brands in the red
in growth.
This is an odd trend for an
industry that seems well-
suited to social media, as well
as fan counts that don’t feel
large enough to have hit their
max yet.
This industry group has the
second smallest average
page size.
Page Fans Fan Growth Rate Change in Fans
Purina ONE 779,492 0.23% 1,793
Wellness Natural Pet Food for Dogs and Cats 508,554 0.08% 407
Natural Balance Pet Foods 451,862 0.03% 136
Average 670,634 0.01% 67
ALPO 290,353 -0.01% -29
Eukanuba 288,428 -0.02% -58
IAMS 725,253 -0.04% -290
Pedigree 1,307,302 -0.05% -654
Beggin' 1,013,828 -0.11% -1,115
Snack Foods
Average Facebook page fan growth rates for 7 industries
The first industry with
negative overall fan growth.
These are very large pages,
and a large overall industry.
In additional exploration on
this later, we’ll see what these
lowering fan counts look like
on a line chart.
Skittles, in losing over 45
thousand fans, is the largest
single page drop of all pages
in this report.
Page Fans Fan Growth Rate Change in Fans
Oreo 42,480,492 0.04% 16,992
Butterfinger 1,980,374 0.03% 594
Snickers 10,605,860 -0.03% -3,182
Average 15,478,891 -0.09% -13,931
Reese's 10,733,609 -0.11% -11,807
Twix 7,630,848 -0.16% -12,209
Skittles 23,824,820 -0.19% -45,267
Starburst 11,096,231 -0.23% -25,521
Soft Drinks
Average Facebook page fan growth rates for 7 industries
Every page in this industry set
is in the red. And the highest
average negative fan growth
in this report.
The two bottom pages are the
largest percentage loss in fan
counts of all pages in this
report.
Page Fans Fan Growth Rate Change in Fans
Mountain Dew 8,505,488 -0.08% -6,804
Fanta 767,239 -0.14% -1,074
Dr Pepper 14,377,160 -0.17% -24,441
Pepsi (PepsiUS) 6,442,827 -0.17% -10,953
Average 7,756,251 -0.17% -13,186
Coca-Cola (CocaColaUnitedStates) 12,530,987 -0.24% -30,074
Sprite (spriteus) 3,913,803 -0.24% -9,393
Children’s Hospitals
Average Facebook page fan growth rates for 7 industries
This is more like what we’ve
been seeing in Facebook fan
page growth rates in the past.
A strong overall 1.5% growth
for the month.
The Fans column shows that
these pages are not anywhere
near as large as the other
industries. However, these
are also more local
businesses, which would
seemingly have a lower
ceiling on total fan counts.
It could be that this industry is
later to social media than the
others, and is still in a higher
growth phase.
Page Fans Fan Growth Rate Change in Fans
Akron Children's Hospital 37,234 4.91% 1,828
UH Rainbow Babies & Children's 24,045 2.98% 717
Cook Children's 51,341 1.60% 821
Average 361,464 1.53% 5,530
Nationwide Children's Hospital 197,936 1.36% 2,692
Children's Hospital of Pittsburgh of UPMC 57,500 1.31% 753
Children's Hospital of Philadelphia 112,514 1.00% 1,125
St. Jude Children's Research Hospital 1,975,225 0.29% 5,728
Dayton Children's Hospital 40,393 0.20% 81
Boston Children's Hospital 756,986 0.15% 1,135
Tourism
Average Facebook page fan growth rates for 7 industries
Another industry in which all
sample pages are moving in
an upward direction.
Average page size is still well
under a million, and while
these aren’t local pages,
because they’re state tourism
pages, they’re likely to have a
regional appeal.
Page Fans Fan Growth Rate Change in Fans
Pure Michigan 1,084,643 1.32% 14,317
VISIT FLORIDA 708,619 0.61% 4,323
Explore Georgia 372,577 0.59% 2,198
Visit Colorado 641,022 0.51% 3,269
I LOVE NEW YORK 1,367,283 0.49% 6,700
Average 862,866 0.49% 4,228
Texas Tourism 120,196 0.18% 216
Visit California 770,600 0.11% 848
Hawaii – gohawaii.com 1,837,989 0.07% 1,287
Page Details
A closer look at some of the key pages losing fans in this report.
Average Facebook page fan growth rates for 7 industries
Coca-Cola’s and Sprite’s drop for October
Average Facebook page fan growth rates for 7 industries
Below you can see each of these brands followed a similar long, gradual decline. If this was more of a sudden drop, it
might be attributed to new regional pages being carved off a larger global page, or perhaps Facebook purging obsolete
fan accounts.
Starburst. A history of dropping fan count.
Average Facebook page fan growth rates for 7 industries
Starburst was another relatively big drop in October 2016, of .23%. A loss of over 25,000 fans. The October fan trending
is in the top chart. The second chart shows Starburst since January 1, 2016. The fan drop trend line has been going on
for quite a while.
Skittles. Dropping trend except for the Super Bowl.
Average Facebook page fan growth rates for 7 industries
This is Skittles since January 1, 2016. Another long, dropping fan count curve. The slight uptick in fans is right around
the Super Bowl. They had a spot featuring Steven Tyler of Aerosmith. It ranked 25 out of 63 of all the Super Bowl spots.
Beggin’ Pet Food. Long decline after a bumpy 2015.
Average Facebook page fan growth rates for 7 industries
Beggin’ pet food seem to have started their long decline after the beginning of the year. However, the bottom chart
shows the brand’s 2015 daily fan count line. Clearly they must have had some strong campaigns going that year,
although overall fan count was still down quite a bit at the end of the year.
REPORT PERIOD:
Average Facebook
page fan growth
rates for seven
industries
ZuumSocial.com
This Google Slide is downloadable in either PDF or PPT.
Zuum is a powerful social media analysis and reporting
tool that will help you maximize the value of your social
media properties.
We have a free demo you should check out. It’s a free
Facebook page performance report -- available instantly
after you login with Facebook. Just visit:
zuumsocial.com/free-facebook-report/

More Related Content

Viewers also liked

耶穌基督贏過死亡
耶穌基督贏過死亡耶穌基督贏過死亡
耶穌基督贏過死亡gaanchurch
 
Báo cáo gđ 9 11-2015
Báo cáo gđ 9 11-2015Báo cáo gđ 9 11-2015
Báo cáo gđ 9 11-2015Hoang Vu
 
A Jornada diante do Cristianismo 1.0
A Jornada diante do Cristianismo 1.0A Jornada diante do Cristianismo 1.0
A Jornada diante do Cristianismo 1.0Daniel Faria Jr.
 
Open stax economics_ch03_imageslideshow_revised
Open stax economics_ch03_imageslideshow_revisedOpen stax economics_ch03_imageslideshow_revised
Open stax economics_ch03_imageslideshow_revisedCheryl Thomas Knight
 
涯歡喜因為涯屬耶穌
涯歡喜因為涯屬耶穌涯歡喜因為涯屬耶穌
涯歡喜因為涯屬耶穌gaanchurch
 
OmegaT "Team Project" feature: a case study
OmegaT "Team Project" feature: a case studyOmegaT "Team Project" feature: a case study
OmegaT "Team Project" feature: a case studyQabiria
 
Obstruccion intestinal
Obstruccion intestinalObstruccion intestinal
Obstruccion intestinalRenzo Geldres
 

Viewers also liked (13)

耶穌基督贏過死亡
耶穌基督贏過死亡耶穌基督贏過死亡
耶穌基督贏過死亡
 
Báo cáo gđ 9 11-2015
Báo cáo gđ 9 11-2015Báo cáo gđ 9 11-2015
Báo cáo gđ 9 11-2015
 
Ensayo
EnsayoEnsayo
Ensayo
 
Mapa mental. tarea 6
Mapa mental. tarea 6Mapa mental. tarea 6
Mapa mental. tarea 6
 
A Jornada diante do Cristianismo 1.0
A Jornada diante do Cristianismo 1.0A Jornada diante do Cristianismo 1.0
A Jornada diante do Cristianismo 1.0
 
Rd 04-31-2006
Rd 04-31-2006Rd 04-31-2006
Rd 04-31-2006
 
Open stax economics_ch03_imageslideshow_revised
Open stax economics_ch03_imageslideshow_revisedOpen stax economics_ch03_imageslideshow_revised
Open stax economics_ch03_imageslideshow_revised
 
涯歡喜因為涯屬耶穌
涯歡喜因為涯屬耶穌涯歡喜因為涯屬耶穌
涯歡喜因為涯屬耶穌
 
Sistema endocrino
Sistema endocrinoSistema endocrino
Sistema endocrino
 
OmegaT "Team Project" feature: a case study
OmegaT "Team Project" feature: a case studyOmegaT "Team Project" feature: a case study
OmegaT "Team Project" feature: a case study
 
Flow cytometry
Flow cytometryFlow cytometry
Flow cytometry
 
Oclusión intestinal
Oclusión intestinalOclusión intestinal
Oclusión intestinal
 
Obstruccion intestinal
Obstruccion intestinalObstruccion intestinal
Obstruccion intestinal
 

Similar to Average Facebook page fan growth rates for seven industries

Snack Foods Facebook Page Analysis
Snack Foods Facebook Page AnalysisSnack Foods Facebook Page Analysis
Snack Foods Facebook Page AnalysisZuum
 
2015 in Review: A Social Media Benchmark & Content Summary for the Snack Food...
2015 in Review: A Social Media Benchmark & Content Summary for the Snack Food...2015 in Review: A Social Media Benchmark & Content Summary for the Snack Food...
2015 in Review: A Social Media Benchmark & Content Summary for the Snack Food...Zuum
 
Social media benchmark and content trends for the fruit juice industry
Social media benchmark and content trends for the fruit juice industrySocial media benchmark and content trends for the fruit juice industry
Social media benchmark and content trends for the fruit juice industryDoug Schumacher
 
Facebook Page Data Averages
Facebook Page Data AveragesFacebook Page Data Averages
Facebook Page Data AveragesDoug Schumacher
 
DESIGN:RETAIL FORUM: In-Store Technology As Retailtainment: Bright Shiny Obje...
DESIGN:RETAIL FORUM: In-Store Technology As Retailtainment: Bright Shiny Obje...DESIGN:RETAIL FORUM: In-Store Technology As Retailtainment: Bright Shiny Obje...
DESIGN:RETAIL FORUM: In-Store Technology As Retailtainment: Bright Shiny Obje...Deborah Weinswig
 
The State of Social Media in South Africa
The State of Social Media in South AfricaThe State of Social Media in South Africa
The State of Social Media in South AfricaAndrew Felbert
 
Social media community plan
Social media   community planSocial media   community plan
Social media community planAdCMO
 
Social media community plan 2
Social media   community plan 2Social media   community plan 2
Social media community plan 2AdCMO
 
Social Media Shakedown of Top Brands in June 2013
Social Media Shakedown of Top Brands in June 2013Social Media Shakedown of Top Brands in June 2013
Social Media Shakedown of Top Brands in June 2013Unmetric
 
The Downward Giants and Upward New Brands—the volatile food industry
The Downward Giants and Upward New Brands—the volatile food industryThe Downward Giants and Upward New Brands—the volatile food industry
The Downward Giants and Upward New Brands—the volatile food industry东明 马
 
Magazine trends
Magazine trendsMagazine trends
Magazine trendsESPayne
 
2015 in Review: A Social Media Benchmark & Content Summary for the Energy Dri...
2015 in Review: A Social Media Benchmark & Content Summary for the Energy Dri...2015 in Review: A Social Media Benchmark & Content Summary for the Energy Dri...
2015 in Review: A Social Media Benchmark & Content Summary for the Energy Dri...Zuum
 
Facebook Stats - beyond
Facebook Stats - beyondFacebook Stats - beyond
Facebook Stats - beyondEd Lee
 
Febuary 2016 Social Media Evaluation
Febuary 2016 Social Media EvaluationFebuary 2016 Social Media Evaluation
Febuary 2016 Social Media EvaluationBenjamin Ladrillono
 
Report :: Where The Fans Are In Social Media
Report :: Where The Fans Are In Social MediaReport :: Where The Fans Are In Social Media
Report :: Where The Fans Are In Social MediaZuum
 
Q3 2014 Facebook Study
Q3 2014 Facebook StudyQ3 2014 Facebook Study
Q3 2014 Facebook StudyMohamed Mahdy
 
Top Australian Brands on Social Media- January 2014
Top Australian Brands on Social Media- January 2014Top Australian Brands on Social Media- January 2014
Top Australian Brands on Social Media- January 2014Unmetric
 
Emerging Consumer Survey Databook 2014
Emerging Consumer Survey Databook 2014Emerging Consumer Survey Databook 2014
Emerging Consumer Survey Databook 2014Credit Suisse
 

Similar to Average Facebook page fan growth rates for seven industries (20)

How to grow your social audience simply measured
How to grow your social audience simply measuredHow to grow your social audience simply measured
How to grow your social audience simply measured
 
Snack Foods Facebook Page Analysis
Snack Foods Facebook Page AnalysisSnack Foods Facebook Page Analysis
Snack Foods Facebook Page Analysis
 
2015 in Review: A Social Media Benchmark & Content Summary for the Snack Food...
2015 in Review: A Social Media Benchmark & Content Summary for the Snack Food...2015 in Review: A Social Media Benchmark & Content Summary for the Snack Food...
2015 in Review: A Social Media Benchmark & Content Summary for the Snack Food...
 
Social media benchmark and content trends for the fruit juice industry
Social media benchmark and content trends for the fruit juice industrySocial media benchmark and content trends for the fruit juice industry
Social media benchmark and content trends for the fruit juice industry
 
Facebook Page Data Averages
Facebook Page Data AveragesFacebook Page Data Averages
Facebook Page Data Averages
 
DESIGN:RETAIL FORUM: In-Store Technology As Retailtainment: Bright Shiny Obje...
DESIGN:RETAIL FORUM: In-Store Technology As Retailtainment: Bright Shiny Obje...DESIGN:RETAIL FORUM: In-Store Technology As Retailtainment: Bright Shiny Obje...
DESIGN:RETAIL FORUM: In-Store Technology As Retailtainment: Bright Shiny Obje...
 
The State of Social Media in South Africa
The State of Social Media in South AfricaThe State of Social Media in South Africa
The State of Social Media in South Africa
 
Social media community plan
Social media   community planSocial media   community plan
Social media community plan
 
Social media community plan 2
Social media   community plan 2Social media   community plan 2
Social media community plan 2
 
Social Media Shakedown of Top Brands in June 2013
Social Media Shakedown of Top Brands in June 2013Social Media Shakedown of Top Brands in June 2013
Social Media Shakedown of Top Brands in June 2013
 
The Downward Giants and Upward New Brands—the volatile food industry
The Downward Giants and Upward New Brands—the volatile food industryThe Downward Giants and Upward New Brands—the volatile food industry
The Downward Giants and Upward New Brands—the volatile food industry
 
Magazine trends
Magazine trendsMagazine trends
Magazine trends
 
2015 in Review: A Social Media Benchmark & Content Summary for the Energy Dri...
2015 in Review: A Social Media Benchmark & Content Summary for the Energy Dri...2015 in Review: A Social Media Benchmark & Content Summary for the Energy Dri...
2015 in Review: A Social Media Benchmark & Content Summary for the Energy Dri...
 
Facebook Stats - beyond
Facebook Stats - beyondFacebook Stats - beyond
Facebook Stats - beyond
 
Febuary 2016 Social Media Evaluation
Febuary 2016 Social Media EvaluationFebuary 2016 Social Media Evaluation
Febuary 2016 Social Media Evaluation
 
Report :: Where The Fans Are In Social Media
Report :: Where The Fans Are In Social MediaReport :: Where The Fans Are In Social Media
Report :: Where The Fans Are In Social Media
 
Q3 2014 Facebook Study
Q3 2014 Facebook StudyQ3 2014 Facebook Study
Q3 2014 Facebook Study
 
Top Australian Brands on Social Media- January 2014
Top Australian Brands on Social Media- January 2014Top Australian Brands on Social Media- January 2014
Top Australian Brands on Social Media- January 2014
 
Social Shopping 3 0
Social Shopping 3 0Social Shopping 3 0
Social Shopping 3 0
 
Emerging Consumer Survey Databook 2014
Emerging Consumer Survey Databook 2014Emerging Consumer Survey Databook 2014
Emerging Consumer Survey Databook 2014
 

More from Zuum

How2: Reading the Facebook Benchmark Report’s Brand Benchmark Charts
How2: Reading the Facebook Benchmark Report’s Brand Benchmark ChartsHow2: Reading the Facebook Benchmark Report’s Brand Benchmark Charts
How2: Reading the Facebook Benchmark Report’s Brand Benchmark ChartsZuum
 
How2 Measure your Facebook page performance
How2 Measure your Facebook page performanceHow2 Measure your Facebook page performance
How2 Measure your Facebook page performanceZuum
 
Social Media Community Size and Growth Benchmarks – February 2016
Social Media Community Size and Growth Benchmarks – February 2016Social Media Community Size and Growth Benchmarks – February 2016
Social Media Community Size and Growth Benchmarks – February 2016Zuum
 
Social media benchmark and content trends for the snack food industry
Social media benchmark and content trends for the snack food industrySocial media benchmark and content trends for the snack food industry
Social media benchmark and content trends for the snack food industryZuum
 
Report: Social Media Community Size and Growth Benchmarks
Report: Social Media Community Size and Growth BenchmarksReport: Social Media Community Size and Growth Benchmarks
Report: Social Media Community Size and Growth BenchmarksZuum
 
Social Media Case Study :: USC's Graduation Campaign
Social Media Case Study :: USC's Graduation CampaignSocial Media Case Study :: USC's Graduation Campaign
Social Media Case Study :: USC's Graduation CampaignZuum
 
Social Media Analysis for the CPG Energy Drink Industry
Social Media Analysis for the CPG Energy Drink IndustrySocial Media Analysis for the CPG Energy Drink Industry
Social Media Analysis for the CPG Energy Drink IndustryZuum
 
Report: Instagram vs Facebook vs Twitter
Report: Instagram vs Facebook vs TwitterReport: Instagram vs Facebook vs Twitter
Report: Instagram vs Facebook vs TwitterZuum
 
Report: Social Media Benchmarks for 5 Industries
Report: Social Media Benchmarks for 5 IndustriesReport: Social Media Benchmarks for 5 Industries
Report: Social Media Benchmarks for 5 IndustriesZuum
 
Report - Luxury Fashion: 3 Social Media Campaigns in September
Report - Luxury Fashion: 3 Social Media Campaigns in SeptemberReport - Luxury Fashion: 3 Social Media Campaigns in September
Report - Luxury Fashion: 3 Social Media Campaigns in SeptemberZuum
 
Tourism DMOs - A Social Media Analysis
Tourism DMOs - A Social Media AnalysisTourism DMOs - A Social Media Analysis
Tourism DMOs - A Social Media AnalysisZuum
 
CPG Snack Foods :: A Social Media Analysis
CPG Snack Foods :: A Social Media AnalysisCPG Snack Foods :: A Social Media Analysis
CPG Snack Foods :: A Social Media AnalysisZuum
 
Social Media Analysis - Luxury Autos
Social Media Analysis - Luxury AutosSocial Media Analysis - Luxury Autos
Social Media Analysis - Luxury AutosZuum
 
Report: Social Media Analysis - QSR Restaurants
Report: Social Media Analysis - QSR RestaurantsReport: Social Media Analysis - QSR Restaurants
Report: Social Media Analysis - QSR RestaurantsZuum
 
Report :: 7 Brands Generating More Engagement on Instagram than on Facebook
Report :: 7 Brands Generating More Engagement on Instagram than on FacebookReport :: 7 Brands Generating More Engagement on Instagram than on Facebook
Report :: 7 Brands Generating More Engagement on Instagram than on FacebookZuum
 
Facebook Page Data Averages - Sep 2013
Facebook Page Data Averages - Sep 2013Facebook Page Data Averages - Sep 2013
Facebook Page Data Averages - Sep 2013Zuum
 
Facebook Page Data Averages for May 2013
Facebook Page Data Averages for May 2013Facebook Page Data Averages for May 2013
Facebook Page Data Averages for May 2013Zuum
 
Social Content Analysis :: The Luxury Fashion Industry
Social Content Analysis :: The Luxury Fashion IndustrySocial Content Analysis :: The Luxury Fashion Industry
Social Content Analysis :: The Luxury Fashion IndustryZuum
 
Coke v Pepsi Facebook Page Analysis
Coke v Pepsi Facebook Page AnalysisCoke v Pepsi Facebook Page Analysis
Coke v Pepsi Facebook Page AnalysisZuum
 
Hospitals Facebook Page Analysis
Hospitals Facebook Page AnalysisHospitals Facebook Page Analysis
Hospitals Facebook Page AnalysisZuum
 

More from Zuum (20)

How2: Reading the Facebook Benchmark Report’s Brand Benchmark Charts
How2: Reading the Facebook Benchmark Report’s Brand Benchmark ChartsHow2: Reading the Facebook Benchmark Report’s Brand Benchmark Charts
How2: Reading the Facebook Benchmark Report’s Brand Benchmark Charts
 
How2 Measure your Facebook page performance
How2 Measure your Facebook page performanceHow2 Measure your Facebook page performance
How2 Measure your Facebook page performance
 
Social Media Community Size and Growth Benchmarks – February 2016
Social Media Community Size and Growth Benchmarks – February 2016Social Media Community Size and Growth Benchmarks – February 2016
Social Media Community Size and Growth Benchmarks – February 2016
 
Social media benchmark and content trends for the snack food industry
Social media benchmark and content trends for the snack food industrySocial media benchmark and content trends for the snack food industry
Social media benchmark and content trends for the snack food industry
 
Report: Social Media Community Size and Growth Benchmarks
Report: Social Media Community Size and Growth BenchmarksReport: Social Media Community Size and Growth Benchmarks
Report: Social Media Community Size and Growth Benchmarks
 
Social Media Case Study :: USC's Graduation Campaign
Social Media Case Study :: USC's Graduation CampaignSocial Media Case Study :: USC's Graduation Campaign
Social Media Case Study :: USC's Graduation Campaign
 
Social Media Analysis for the CPG Energy Drink Industry
Social Media Analysis for the CPG Energy Drink IndustrySocial Media Analysis for the CPG Energy Drink Industry
Social Media Analysis for the CPG Energy Drink Industry
 
Report: Instagram vs Facebook vs Twitter
Report: Instagram vs Facebook vs TwitterReport: Instagram vs Facebook vs Twitter
Report: Instagram vs Facebook vs Twitter
 
Report: Social Media Benchmarks for 5 Industries
Report: Social Media Benchmarks for 5 IndustriesReport: Social Media Benchmarks for 5 Industries
Report: Social Media Benchmarks for 5 Industries
 
Report - Luxury Fashion: 3 Social Media Campaigns in September
Report - Luxury Fashion: 3 Social Media Campaigns in SeptemberReport - Luxury Fashion: 3 Social Media Campaigns in September
Report - Luxury Fashion: 3 Social Media Campaigns in September
 
Tourism DMOs - A Social Media Analysis
Tourism DMOs - A Social Media AnalysisTourism DMOs - A Social Media Analysis
Tourism DMOs - A Social Media Analysis
 
CPG Snack Foods :: A Social Media Analysis
CPG Snack Foods :: A Social Media AnalysisCPG Snack Foods :: A Social Media Analysis
CPG Snack Foods :: A Social Media Analysis
 
Social Media Analysis - Luxury Autos
Social Media Analysis - Luxury AutosSocial Media Analysis - Luxury Autos
Social Media Analysis - Luxury Autos
 
Report: Social Media Analysis - QSR Restaurants
Report: Social Media Analysis - QSR RestaurantsReport: Social Media Analysis - QSR Restaurants
Report: Social Media Analysis - QSR Restaurants
 
Report :: 7 Brands Generating More Engagement on Instagram than on Facebook
Report :: 7 Brands Generating More Engagement on Instagram than on FacebookReport :: 7 Brands Generating More Engagement on Instagram than on Facebook
Report :: 7 Brands Generating More Engagement on Instagram than on Facebook
 
Facebook Page Data Averages - Sep 2013
Facebook Page Data Averages - Sep 2013Facebook Page Data Averages - Sep 2013
Facebook Page Data Averages - Sep 2013
 
Facebook Page Data Averages for May 2013
Facebook Page Data Averages for May 2013Facebook Page Data Averages for May 2013
Facebook Page Data Averages for May 2013
 
Social Content Analysis :: The Luxury Fashion Industry
Social Content Analysis :: The Luxury Fashion IndustrySocial Content Analysis :: The Luxury Fashion Industry
Social Content Analysis :: The Luxury Fashion Industry
 
Coke v Pepsi Facebook Page Analysis
Coke v Pepsi Facebook Page AnalysisCoke v Pepsi Facebook Page Analysis
Coke v Pepsi Facebook Page Analysis
 
Hospitals Facebook Page Analysis
Hospitals Facebook Page AnalysisHospitals Facebook Page Analysis
Hospitals Facebook Page Analysis
 

Recently uploaded

100-Concepts-of-AI by Anupama Kate .pptx
100-Concepts-of-AI by Anupama Kate .pptx100-Concepts-of-AI by Anupama Kate .pptx
100-Concepts-of-AI by Anupama Kate .pptxAnupama Kate
 
Ravak dropshipping via API with DroFx.pptx
Ravak dropshipping via API with DroFx.pptxRavak dropshipping via API with DroFx.pptx
Ravak dropshipping via API with DroFx.pptxolyaivanovalion
 
Carero dropshipping via API with DroFx.pptx
Carero dropshipping via API with DroFx.pptxCarero dropshipping via API with DroFx.pptx
Carero dropshipping via API with DroFx.pptxolyaivanovalion
 
Best VIP Call Girls Noida Sector 39 Call Me: 8448380779
Best VIP Call Girls Noida Sector 39 Call Me: 8448380779Best VIP Call Girls Noida Sector 39 Call Me: 8448380779
Best VIP Call Girls Noida Sector 39 Call Me: 8448380779Delhi Call girls
 
VIP Call Girls Service Miyapur Hyderabad Call +91-8250192130
VIP Call Girls Service Miyapur Hyderabad Call +91-8250192130VIP Call Girls Service Miyapur Hyderabad Call +91-8250192130
VIP Call Girls Service Miyapur Hyderabad Call +91-8250192130Suhani Kapoor
 
Call Girls 🫤 Dwarka ➡️ 9711199171 ➡️ Delhi 🫦 Two shot with one girl
Call Girls 🫤 Dwarka ➡️ 9711199171 ➡️ Delhi 🫦 Two shot with one girlCall Girls 🫤 Dwarka ➡️ 9711199171 ➡️ Delhi 🫦 Two shot with one girl
Call Girls 🫤 Dwarka ➡️ 9711199171 ➡️ Delhi 🫦 Two shot with one girlkumarajju5765
 
Invezz.com - Grow your wealth with trading signals
Invezz.com - Grow your wealth with trading signalsInvezz.com - Grow your wealth with trading signals
Invezz.com - Grow your wealth with trading signalsInvezz1
 
Vip Model Call Girls (Delhi) Karol Bagh 9711199171✔️Body to body massage wit...
Vip Model  Call Girls (Delhi) Karol Bagh 9711199171✔️Body to body massage wit...Vip Model  Call Girls (Delhi) Karol Bagh 9711199171✔️Body to body massage wit...
Vip Model Call Girls (Delhi) Karol Bagh 9711199171✔️Body to body massage wit...shivangimorya083
 
Accredited-Transport-Cooperatives-Jan-2021-Web.pdf
Accredited-Transport-Cooperatives-Jan-2021-Web.pdfAccredited-Transport-Cooperatives-Jan-2021-Web.pdf
Accredited-Transport-Cooperatives-Jan-2021-Web.pdfadriantubila
 
Junnasandra Call Girls: 🍓 7737669865 🍓 High Profile Model Escorts | Bangalore...
Junnasandra Call Girls: 🍓 7737669865 🍓 High Profile Model Escorts | Bangalore...Junnasandra Call Girls: 🍓 7737669865 🍓 High Profile Model Escorts | Bangalore...
Junnasandra Call Girls: 🍓 7737669865 🍓 High Profile Model Escorts | Bangalore...amitlee9823
 
Call Girls in Sarai Kale Khan Delhi 💯 Call Us 🔝9205541914 🔝( Delhi) Escorts S...
Call Girls in Sarai Kale Khan Delhi 💯 Call Us 🔝9205541914 🔝( Delhi) Escorts S...Call Girls in Sarai Kale Khan Delhi 💯 Call Us 🔝9205541914 🔝( Delhi) Escorts S...
Call Girls in Sarai Kale Khan Delhi 💯 Call Us 🔝9205541914 🔝( Delhi) Escorts S...Delhi Call girls
 
Delhi Call Girls Punjabi Bagh 9711199171 ☎✔👌✔ Whatsapp Hard And Sexy Vip Call
Delhi Call Girls Punjabi Bagh 9711199171 ☎✔👌✔ Whatsapp Hard And Sexy Vip CallDelhi Call Girls Punjabi Bagh 9711199171 ☎✔👌✔ Whatsapp Hard And Sexy Vip Call
Delhi Call Girls Punjabi Bagh 9711199171 ☎✔👌✔ Whatsapp Hard And Sexy Vip Callshivangimorya083
 
BPAC WITH UFSBI GENERAL PRESENTATION 18_05_2017-1.pptx
BPAC WITH UFSBI GENERAL PRESENTATION 18_05_2017-1.pptxBPAC WITH UFSBI GENERAL PRESENTATION 18_05_2017-1.pptx
BPAC WITH UFSBI GENERAL PRESENTATION 18_05_2017-1.pptxMohammedJunaid861692
 
Halmar dropshipping via API with DroFx
Halmar  dropshipping  via API with DroFxHalmar  dropshipping  via API with DroFx
Halmar dropshipping via API with DroFxolyaivanovalion
 
BigBuy dropshipping via API with DroFx.pptx
BigBuy dropshipping via API with DroFx.pptxBigBuy dropshipping via API with DroFx.pptx
BigBuy dropshipping via API with DroFx.pptxolyaivanovalion
 
Call me @ 9892124323 Cheap Rate Call Girls in Vashi with Real Photo 100% Secure
Call me @ 9892124323  Cheap Rate Call Girls in Vashi with Real Photo 100% SecureCall me @ 9892124323  Cheap Rate Call Girls in Vashi with Real Photo 100% Secure
Call me @ 9892124323 Cheap Rate Call Girls in Vashi with Real Photo 100% SecurePooja Nehwal
 
CALL ON ➥8923113531 🔝Call Girls Chinhat Lucknow best sexual service Online
CALL ON ➥8923113531 🔝Call Girls Chinhat Lucknow best sexual service OnlineCALL ON ➥8923113531 🔝Call Girls Chinhat Lucknow best sexual service Online
CALL ON ➥8923113531 🔝Call Girls Chinhat Lucknow best sexual service Onlineanilsa9823
 
Mature dropshipping via API with DroFx.pptx
Mature dropshipping via API with DroFx.pptxMature dropshipping via API with DroFx.pptx
Mature dropshipping via API with DroFx.pptxolyaivanovalion
 

Recently uploaded (20)

100-Concepts-of-AI by Anupama Kate .pptx
100-Concepts-of-AI by Anupama Kate .pptx100-Concepts-of-AI by Anupama Kate .pptx
100-Concepts-of-AI by Anupama Kate .pptx
 
Ravak dropshipping via API with DroFx.pptx
Ravak dropshipping via API with DroFx.pptxRavak dropshipping via API with DroFx.pptx
Ravak dropshipping via API with DroFx.pptx
 
Carero dropshipping via API with DroFx.pptx
Carero dropshipping via API with DroFx.pptxCarero dropshipping via API with DroFx.pptx
Carero dropshipping via API with DroFx.pptx
 
Best VIP Call Girls Noida Sector 39 Call Me: 8448380779
Best VIP Call Girls Noida Sector 39 Call Me: 8448380779Best VIP Call Girls Noida Sector 39 Call Me: 8448380779
Best VIP Call Girls Noida Sector 39 Call Me: 8448380779
 
VIP Call Girls Service Miyapur Hyderabad Call +91-8250192130
VIP Call Girls Service Miyapur Hyderabad Call +91-8250192130VIP Call Girls Service Miyapur Hyderabad Call +91-8250192130
VIP Call Girls Service Miyapur Hyderabad Call +91-8250192130
 
Call Girls 🫤 Dwarka ➡️ 9711199171 ➡️ Delhi 🫦 Two shot with one girl
Call Girls 🫤 Dwarka ➡️ 9711199171 ➡️ Delhi 🫦 Two shot with one girlCall Girls 🫤 Dwarka ➡️ 9711199171 ➡️ Delhi 🫦 Two shot with one girl
Call Girls 🫤 Dwarka ➡️ 9711199171 ➡️ Delhi 🫦 Two shot with one girl
 
Invezz.com - Grow your wealth with trading signals
Invezz.com - Grow your wealth with trading signalsInvezz.com - Grow your wealth with trading signals
Invezz.com - Grow your wealth with trading signals
 
Vip Model Call Girls (Delhi) Karol Bagh 9711199171✔️Body to body massage wit...
Vip Model  Call Girls (Delhi) Karol Bagh 9711199171✔️Body to body massage wit...Vip Model  Call Girls (Delhi) Karol Bagh 9711199171✔️Body to body massage wit...
Vip Model Call Girls (Delhi) Karol Bagh 9711199171✔️Body to body massage wit...
 
Accredited-Transport-Cooperatives-Jan-2021-Web.pdf
Accredited-Transport-Cooperatives-Jan-2021-Web.pdfAccredited-Transport-Cooperatives-Jan-2021-Web.pdf
Accredited-Transport-Cooperatives-Jan-2021-Web.pdf
 
Junnasandra Call Girls: 🍓 7737669865 🍓 High Profile Model Escorts | Bangalore...
Junnasandra Call Girls: 🍓 7737669865 🍓 High Profile Model Escorts | Bangalore...Junnasandra Call Girls: 🍓 7737669865 🍓 High Profile Model Escorts | Bangalore...
Junnasandra Call Girls: 🍓 7737669865 🍓 High Profile Model Escorts | Bangalore...
 
Call Girls in Sarai Kale Khan Delhi 💯 Call Us 🔝9205541914 🔝( Delhi) Escorts S...
Call Girls in Sarai Kale Khan Delhi 💯 Call Us 🔝9205541914 🔝( Delhi) Escorts S...Call Girls in Sarai Kale Khan Delhi 💯 Call Us 🔝9205541914 🔝( Delhi) Escorts S...
Call Girls in Sarai Kale Khan Delhi 💯 Call Us 🔝9205541914 🔝( Delhi) Escorts S...
 
Sampling (random) method and Non random.ppt
Sampling (random) method and Non random.pptSampling (random) method and Non random.ppt
Sampling (random) method and Non random.ppt
 
Delhi Call Girls Punjabi Bagh 9711199171 ☎✔👌✔ Whatsapp Hard And Sexy Vip Call
Delhi Call Girls Punjabi Bagh 9711199171 ☎✔👌✔ Whatsapp Hard And Sexy Vip CallDelhi Call Girls Punjabi Bagh 9711199171 ☎✔👌✔ Whatsapp Hard And Sexy Vip Call
Delhi Call Girls Punjabi Bagh 9711199171 ☎✔👌✔ Whatsapp Hard And Sexy Vip Call
 
BPAC WITH UFSBI GENERAL PRESENTATION 18_05_2017-1.pptx
BPAC WITH UFSBI GENERAL PRESENTATION 18_05_2017-1.pptxBPAC WITH UFSBI GENERAL PRESENTATION 18_05_2017-1.pptx
BPAC WITH UFSBI GENERAL PRESENTATION 18_05_2017-1.pptx
 
Halmar dropshipping via API with DroFx
Halmar  dropshipping  via API with DroFxHalmar  dropshipping  via API with DroFx
Halmar dropshipping via API with DroFx
 
BigBuy dropshipping via API with DroFx.pptx
BigBuy dropshipping via API with DroFx.pptxBigBuy dropshipping via API with DroFx.pptx
BigBuy dropshipping via API with DroFx.pptx
 
Abortion pills in Doha Qatar (+966572737505 ! Get Cytotec
Abortion pills in Doha Qatar (+966572737505 ! Get CytotecAbortion pills in Doha Qatar (+966572737505 ! Get Cytotec
Abortion pills in Doha Qatar (+966572737505 ! Get Cytotec
 
Call me @ 9892124323 Cheap Rate Call Girls in Vashi with Real Photo 100% Secure
Call me @ 9892124323  Cheap Rate Call Girls in Vashi with Real Photo 100% SecureCall me @ 9892124323  Cheap Rate Call Girls in Vashi with Real Photo 100% Secure
Call me @ 9892124323 Cheap Rate Call Girls in Vashi with Real Photo 100% Secure
 
CALL ON ➥8923113531 🔝Call Girls Chinhat Lucknow best sexual service Online
CALL ON ➥8923113531 🔝Call Girls Chinhat Lucknow best sexual service OnlineCALL ON ➥8923113531 🔝Call Girls Chinhat Lucknow best sexual service Online
CALL ON ➥8923113531 🔝Call Girls Chinhat Lucknow best sexual service Online
 
Mature dropshipping via API with DroFx.pptx
Mature dropshipping via API with DroFx.pptxMature dropshipping via API with DroFx.pptx
Mature dropshipping via API with DroFx.pptx
 

Average Facebook page fan growth rates for seven industries

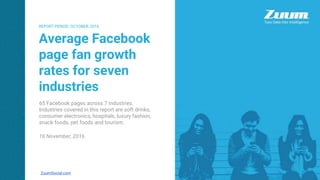
  • 1. REPORT PERIOD: Average Facebook page fan growth rates for seven industries REPORT PERIOD: OCTOBER, 2016 ZuumSocial.com 65 Facebook pages across 7 industries. Industries covered in this report are soft drinks, consumer electronics, hospitals, luxury fashion, snack foods, pet foods and tourism. 16 November, 2016
  • 2. About What’s in this report may surprise a few people. Especially if you’ve been reading the headlines about Facebook is still growing users globally. But what you’ll see here is of the 65 pages in 7 industries we analyzed in this report, a significant number of them are showing negative fan growth for October of 2016. The next page is a summary of report, followed by the industry rankings, and then each of the industries broken out page by page. Charts for each industry show the brands, fan counts, growth rate, and net change in fans. We wrap up with a detailed view of some of the key Facebook pages in the report, assessing their fan loss curves and considerations for why that might be happening. Average Facebook page fan growth rates for 7 industries Sections ❖ Summary ❖ Industry rankings ❖ Consumer Electronics ❖ Luxury Fashion ❖ Pet Foods ❖ Snack Foods ❖ Soft Drinks ❖ Hospitals ❖ Tourism ❖ Detailed views of pages dropping fans
  • 3. Summary ❖ 19 of 65 Facebook pages in this report lost fans in October. That’s 29% of the pages. ❖ Our previous report on social media fan growth in February 2016 showed earlier indication of this drop in fan count trend. ❖ Our February 2015 report on social network fan growth shows a much more positive fan growth rate for Facebook for virtually all industries. ❖ Facebook is still experiencing user growth. So it’s not like the network is falling off the face of the earth. ❖ The number of brand pages with dropping fan counts could be something Facebook noticed, and sensing fans were seeing too much of brands and their content, scaled back the Facebook brand page impressions fans will see, as they recently announced. ❖ Only 2 of the 7 industries we analyzed had negative average fan growth. Average Facebook page fan growth rates for 7 industries
  • 4. Industry Analysis Industry overview and industry by industry breakout Average Facebook page fan growth rates for 7 industries
  • 5. Industry Rankings Average Facebook page fan growth rates for 7 industries Overall growth is positive -- about ⅓ of a percent. Two industries, however, are in the red. Snack Foods and Soft Drinks. Pet Foods is just about flat. Does this indicate a declining interest in Facebook, or is there some other factor. We’ll look at each industry, and then take a closer look at some of the individual brands. Industry Avg Fans Avg Growth Rate Avg Change in Fans Hospitals 361,464 1.53% 5,530 Luxury Fashion 11,037,260 0.58% 64,016 Consumer Electronics 3,349,772 0.47% 15,744 Average 5,645,305 0.34% 8,924 Tourism 862,866 0.07% 4,228 Pet Foods 670,634 0.01% 67 Snack Foods 15,478,891 -0.09% -13,931 Soft Drinks 7,756,251 -0.17% -13,186
  • 6. Consumer Electronics Average Facebook page fan growth rates for 7 industries Only one account is losing fans -- Nokia -- but it happens to be the page with the largest fan count, by a wide margin. Page Fans Fan Growth Rate Change in Fans Pioneer Electronics (North America) 102,580 1.14% 1,169 HP 4,018,431 0.98% 39,381 Bose 1,660,983 0.80% 13,288 Average 3,349,772 0.47% 15,744 Vizio 245,179 0.45% 1,103 Canon 1,194,562 0.38% 4,539 Sony 7,430,730 0.32% 23,778 Panasonic 339,990 0.31% 1,054 Philips 416,473 0.26% 1,083 GoPro 4,864,302 0.15% 7,296 Nokia 13,224,494 -0.11% -14,547
  • 7. Luxury Fashion Average Facebook page fan growth rates for 7 industries This industry is looking more robust. No brands in the red, and an average growth rate of over ½ percent. CHANEL leads the pack with both the highest growth rate and biggest increase in fans. Page Fans Fan Growth Rate Change in Fans CHANEL 14,567,617 1.68% 244,736 Versace 4,444,033 0.82% 36,441 Calvin Klein 8,690,142 0.72% 62,569 Marc Jacobs 1,835,632 0.71% 13,033 Average 11,037,260 0.58% 64,016 Dior 15,501,658 0.49% 75,958 Armani 6,800,393 0.46% 31,282 Dolce & Gabbana 10,777,817 0.33% 35,567 Louis Vuitton 18,798,911 0.26% 48,877 Gucci 13,366,906 0.25% 33,417 Burberry 15,589,491 0.04% 6,236
  • 8. Pet Foods Average Facebook page fan growth rates for 7 industries Five of eight brands in the red in growth. This is an odd trend for an industry that seems well- suited to social media, as well as fan counts that don’t feel large enough to have hit their max yet. This industry group has the second smallest average page size. Page Fans Fan Growth Rate Change in Fans Purina ONE 779,492 0.23% 1,793 Wellness Natural Pet Food for Dogs and Cats 508,554 0.08% 407 Natural Balance Pet Foods 451,862 0.03% 136 Average 670,634 0.01% 67 ALPO 290,353 -0.01% -29 Eukanuba 288,428 -0.02% -58 IAMS 725,253 -0.04% -290 Pedigree 1,307,302 -0.05% -654 Beggin' 1,013,828 -0.11% -1,115
  • 9. Snack Foods Average Facebook page fan growth rates for 7 industries The first industry with negative overall fan growth. These are very large pages, and a large overall industry. In additional exploration on this later, we’ll see what these lowering fan counts look like on a line chart. Skittles, in losing over 45 thousand fans, is the largest single page drop of all pages in this report. Page Fans Fan Growth Rate Change in Fans Oreo 42,480,492 0.04% 16,992 Butterfinger 1,980,374 0.03% 594 Snickers 10,605,860 -0.03% -3,182 Average 15,478,891 -0.09% -13,931 Reese's 10,733,609 -0.11% -11,807 Twix 7,630,848 -0.16% -12,209 Skittles 23,824,820 -0.19% -45,267 Starburst 11,096,231 -0.23% -25,521
  • 10. Soft Drinks Average Facebook page fan growth rates for 7 industries Every page in this industry set is in the red. And the highest average negative fan growth in this report. The two bottom pages are the largest percentage loss in fan counts of all pages in this report. Page Fans Fan Growth Rate Change in Fans Mountain Dew 8,505,488 -0.08% -6,804 Fanta 767,239 -0.14% -1,074 Dr Pepper 14,377,160 -0.17% -24,441 Pepsi (PepsiUS) 6,442,827 -0.17% -10,953 Average 7,756,251 -0.17% -13,186 Coca-Cola (CocaColaUnitedStates) 12,530,987 -0.24% -30,074 Sprite (spriteus) 3,913,803 -0.24% -9,393
  • 11. Children’s Hospitals Average Facebook page fan growth rates for 7 industries This is more like what we’ve been seeing in Facebook fan page growth rates in the past. A strong overall 1.5% growth for the month. The Fans column shows that these pages are not anywhere near as large as the other industries. However, these are also more local businesses, which would seemingly have a lower ceiling on total fan counts. It could be that this industry is later to social media than the others, and is still in a higher growth phase. Page Fans Fan Growth Rate Change in Fans Akron Children's Hospital 37,234 4.91% 1,828 UH Rainbow Babies & Children's 24,045 2.98% 717 Cook Children's 51,341 1.60% 821 Average 361,464 1.53% 5,530 Nationwide Children's Hospital 197,936 1.36% 2,692 Children's Hospital of Pittsburgh of UPMC 57,500 1.31% 753 Children's Hospital of Philadelphia 112,514 1.00% 1,125 St. Jude Children's Research Hospital 1,975,225 0.29% 5,728 Dayton Children's Hospital 40,393 0.20% 81 Boston Children's Hospital 756,986 0.15% 1,135
  • 12. Tourism Average Facebook page fan growth rates for 7 industries Another industry in which all sample pages are moving in an upward direction. Average page size is still well under a million, and while these aren’t local pages, because they’re state tourism pages, they’re likely to have a regional appeal. Page Fans Fan Growth Rate Change in Fans Pure Michigan 1,084,643 1.32% 14,317 VISIT FLORIDA 708,619 0.61% 4,323 Explore Georgia 372,577 0.59% 2,198 Visit Colorado 641,022 0.51% 3,269 I LOVE NEW YORK 1,367,283 0.49% 6,700 Average 862,866 0.49% 4,228 Texas Tourism 120,196 0.18% 216 Visit California 770,600 0.11% 848 Hawaii – gohawaii.com 1,837,989 0.07% 1,287
  • 13. Page Details A closer look at some of the key pages losing fans in this report. Average Facebook page fan growth rates for 7 industries
  • 14. Coca-Cola’s and Sprite’s drop for October Average Facebook page fan growth rates for 7 industries Below you can see each of these brands followed a similar long, gradual decline. If this was more of a sudden drop, it might be attributed to new regional pages being carved off a larger global page, or perhaps Facebook purging obsolete fan accounts.
  • 15. Starburst. A history of dropping fan count. Average Facebook page fan growth rates for 7 industries Starburst was another relatively big drop in October 2016, of .23%. A loss of over 25,000 fans. The October fan trending is in the top chart. The second chart shows Starburst since January 1, 2016. The fan drop trend line has been going on for quite a while.
  • 16. Skittles. Dropping trend except for the Super Bowl. Average Facebook page fan growth rates for 7 industries This is Skittles since January 1, 2016. Another long, dropping fan count curve. The slight uptick in fans is right around the Super Bowl. They had a spot featuring Steven Tyler of Aerosmith. It ranked 25 out of 63 of all the Super Bowl spots.
  • 17. Beggin’ Pet Food. Long decline after a bumpy 2015. Average Facebook page fan growth rates for 7 industries Beggin’ pet food seem to have started their long decline after the beginning of the year. However, the bottom chart shows the brand’s 2015 daily fan count line. Clearly they must have had some strong campaigns going that year, although overall fan count was still down quite a bit at the end of the year.
  • 18. REPORT PERIOD: Average Facebook page fan growth rates for seven industries ZuumSocial.com This Google Slide is downloadable in either PDF or PPT. Zuum is a powerful social media analysis and reporting tool that will help you maximize the value of your social media properties. We have a free demo you should check out. It’s a free Facebook page performance report -- available instantly after you login with Facebook. Just visit: zuumsocial.com/free-facebook-report/