Packet Loss Distributions of TCP using Web100
•Transferir como PPT, PDF•
0 gostou•177 visualizações

This research studied the time distribution between packet loss events in TCP connections using a testbed with varying bandwidths and packet loss rates. The results show that for ADSL and T1 connections, over 80% of congestion events occurred within 1 second or less. For an OC-1 connection, over 80% of events were within 0.25 seconds. The time between events was shorter for higher bandwidth links. To maximize bandwidth utilization, TCP would need a bandwidth estimation mechanism performing updates within 1 second for highly congested links.
Recomendados

Recomendados
Mais conteúdo relacionado
Mais procurados
Mais procurados (20)
Destaque
Semelhante a Packet Loss Distributions of TCP using Web100
Semelhante a Packet Loss Distributions of TCP using Web100 (20)
Packet Loss Distributions of TCP using Web100
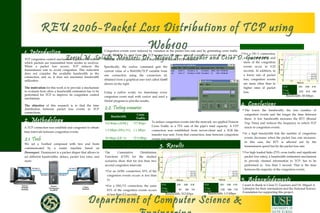
- 1. 1. Introduction REU 2006-Packet Loss Distributions of TCP using Web100 Zoriel M. Salado, Mentors: Dr. Miguel A. Labrador and Cesar D. Guerrero 2. Methodology 3. Results 4. Conclusions 5. Acknowledgments Department of Computer Science & I want to thank to César D. Guerrero and Dr. Miguel A. Labrador for their orientations and the National Science Foundation for supporting this project. TCP congestion control mechanism regulates the rate at which packets are transmitted from sender to receiver. When a packet loss occurs, TCP reduces the transmission rate to avoid congestion. This reduction does not consider the available bandwidth in the connection, and so, it does not maximize bandwidth utilization. The motivation for this work is to provide a mechanism to evaluate how often a bandwidth estimation has to be performed for TCP to improve its congestion control mechanism. The objective of this research is to find the time distribution between packet loss events in TCP connections. A TCP connection was establish and congested to obtain time intervals between congestion events. 2.1. Tools We set a Testbed composed with two end hosts communicated by a router machine based on Dummynet. Dummynet is a packet shaper that allows to set different bandwidths, delays, packet loss rates, and more. Congestion events were induced by variation in the packet loss rate and by generating cross traffic using MGEN. To read from the TCP connection the times when a congestion event occurs, we use Web100. It is a Linux kernel patch that allows to monitor TCP variables. Specifically, the readvar command gets the current value of a Web100/TCP variable from one connection using the connection id, obtained from a graphical user tool called Gutil shown on the right. Using a python script, we timestamp every congestion event read with readvar and used a Matlab program to plot the results. 2.2. Testing scenarios To induce congestion events into the network, we applied Poisson Cross Traffic to a 75% rate of the pipe’s total capacity. A FTP connection was established from server-client and a 3GB file transfer was sent. From that connection, time between congestion events was measured. Bandwidth Cross Traffic 512 Kbps (ADSL) 377 Kbps 1.5 Mbps (DS1/T1) 1.1 Mbps 50 Mbps (OC-1) 37.5 Mbps The Cumulative Distribution Functions (CDF) for the studied scenarios show that for less than two second congestion intervals: •For an ADSL connection, 83% of the congestion events occurs is less than 1s. •For a DS1/T1 connection, the same 83% of the congestion events occurs in less than 0.5 seconds. Bandwidth: 512 Kbps Bandwidth: 1.5 Mbps Bandwidth: 50 Mbps •For a OC-1 connection, we see that 80% and more of the congestion events occur in 0.25 seconds. In addition, in a lower rate of packet loss, congestion events are more often than in higher rates of packet loss. •The lower the bandwidth, the less number of congestion events and the longer the time between them. A low bandwidth increases the RTT (Round Trip Time) and reduces the frequency in which TCP reacts to congestion events. •In a high bandwidth link the number of congestion events decreases when the packet loss rate increases. In this case, the RTT is affected not by the transmission speed but by the packet loss rate. •For high loaded links (75% cross traffic and significant packet loss rates), a bandwidth estimation mechanism to provide channel information to TCP, has to be performed in less than 1 second. That is the time between the majority of the congestion events. PLR 0.01 0.05 0.10 Cong. Events 401 608 815 PLR 0.01 0.05 0.10 Cong. Events 1048 1596 1778 PLR 0.01 0.05 0.10 Cong. Events 7976 4216 1488