SlideShare a Scribd company logo
1 of 4
Download to read offline
Canadian Update
 Last updated: July 2010                                                 Commercial Property
GRIP data indicates that the commercial property rate is stable in the first half of 2010. A review of
FY’09 statutory financials indicates that commercial property written premium grew very slightly at
0.34% which was below the 2.7% growth in total premiums written for all other products. At 68%, the
commercial property direct loss ratio was slightly better than the average 72%. However, the two
largest markets (Ontario and Quebec) significantly underperformed, with direct loss ratios of 77% and
79% respectively.

 PRICING STATISTICS
 On an annualized basis, GRIP data indicates that the commercial property rate for Q2’10 fell 2%. The GRIP estimate for
 Q3’10 shows a continuation of this trend with a 2.9% drop. Estimates are achieved using closed transactions and work
 in progress quotations. In terms of exposures, the average renewing commercial property client appear to be reporting
 a higher total insured value than the previous year. An increase in exposure variables is not unexpected given the
 general economic revival.


                                                              Canadian Update: Commercial Property                        1
STATISTICS and FINANCIALS:
Ten years of loss data show that flooding has been the principal cause of property losses at 21%, followed by
windstorms at 15%. In geographic terms, Quebec reports a large share of property losses at 36% (relative to its
share of economic activity (GDP) at approximately 20%). With the exception of the Quebec ice storm in 1998, the
top ten natural disasters by property losses are relatively benign in the context of industry profitability.

Written premium grew very slightly in FY’09 at 1.1%. This is likely to have been caused by a combination of                 Quarterly Update
         Q3/09
reduced economic activity and a soft rate market. Positively, loss cost growth was similarly subdued at -0.03%
and likely to have benefitted somewhat from the recent negative trend in commercial construction prices.                      Construction
The FY’09 Canadian direct loss ratio for commercial property of 68% was slightly below the all product average of
72%. However, the two largest markets Ontario and Quebec had a direct loss ratio significantly above average at
77% and 79% respectively. The Lloyd's market was the largest writer of both commercial property and all
commercial premium at a national level.


                                                          Top 10 Canadian Natural Disasters by Property Losses $mn
         Year               Loss $mn      Territory                    Event                                                             Note
        1998                  1,377        Quebec                     Ice storm      Greatest natural disaster in Canadian history with over 650,000 property claims filed
        2005                   500         Ontario                   Rainstorm       Significant damage caused to more than 500,000 homes
        2009                   365         Alberta                    Hailstorm      Powerful hail and wind storm hits rural Alberta
        2005                   300         Alberta                    Flooding       Southern parts of the Alberta territory suffer extensive flooding
        1996                   288         Quebec                     Flooding       Severe flooding results in nearly 17,000 property claims
        2003                   200     British Columbia              Forest Fire     Over 3,000 property claims are recorded as forest fires engulf BC's forests
        2009                   196         Ontario                   Rainstorm       Torrential rain recorded in the Ottawa and Hamilton region of Ontario
        2004                   188         Alberta                    Hailstorm      Hailstorms in Edmonton and Calgary result in over 17,000 property claims
        1993                   185        Manitoba                    Flooding       Severe flooding in Winnipeg results in over 21,000 property claims
        2008                   172         Quebec                      Storm         Severe thunderstorm hit Montreal resulting in massive disruption
Source: Insurance Bureau of Canada


                                                                                           Canadian Update: Commercial Property                                              2
Quarterly Update
     Q3/09                                                                                                              Construction


                                            Canada                                       FY'09                    $Mn
                                  Top 5 Underwriters by DPW                             GROUP                 DPW DCI           DLR APLR FSR
                                     Lloyd's Underwriters                                Lloyd's               464   335        72% 52%   A
                                         Intact Ins Co                                  ING Grp                461   311        70% 67% A+
                                      Aviva Ins Co (CAN)                                  Aviva                460   358        80% 70%   A-
                                     Chartis Ins Co (CAN)                                  AIG                 382   243        60% 66%   A
                                        Zurich Ins Co                                    Zurich                308   173        55% 59%   A
                                             Total                                                            5,065 3,163       68% 72%
                          Source: The Office of the Superintendent of Financial Institutions Canada (OSFI)

             Alberta                        FY'09             $Mn                                      British Columbia                FY'09               $Mn
  Top 5 Underwriters by DPW                GROUP              DPW DCI DLR        APLR FSR        Top 5 Underwriters by DPW            GROUP                DPW   DCI   DLR APLR FSR
     Chartis Ins Co (CAN)                    AIG               125    75  62%    26%   A             Lloyd's Underwriters              Lloyd's             121    72   60% 59%   A
     Lloyd's Underwriters                  Lloyd's             118    43  36%    40%   A              AXA Pacific Ins Co                AXA                 77    38   49% 54%   A
 Co-operators General Ins Co       The Co-operators Grp Ltd     94    80  85%    60%   A-             Aviva Ins Co (CAN)                Aviva               77    44   58% 57%   A-
          Intact Ins Co                   ING Grp               82    56   69%    60% A+                 Zurich Ins Co                 Zurich               64    27   41% 45%   A
     Wawanesa Mtl Ins Co                 Unaffiliated           72    64   94%    80% A+            Economical Mtl Ins Co         Economical Ins Grp        57    40   73% 65% B++
          Alberta Total                                       1,019 644 71%      60%                British Columbia Total                                 914   427   54% 60%
            Manitoba                       FY'09              $Mn                                       New Brunswick                    FY'09             $Mn
  Top 5 Underwriters by DPW               GROUP               DPW DCI DLR        APLR FSR        Top 5 Underwriters by DPW              GROUP              DPW   DCI   DLR APLR FSR
     Wawanesa Mtl Ins Co                 Unaffiliated           26    14  57%    65% A+              Lloyd's Underwriters               Lloyd's              9    5    60% 44%   A
      Aviva Ins Co (CAN)                    Aviva               24    27 118%    80%   A-             Aviva Ins Co (CAN)                 Aviva               8    5    59% 62%   A-
          Intact Ins Co                   ING Grp               16    12  74%    79% A+               Factory Mtl Ins Co             FM Global Grp           8   0.1    2%  3%   A+
     Lloyd's Underwriters                  Lloyd's              14    11  81%    46%   A             Chartis Ins Co (CAN)                 AIG                6    1    17% 66%   A
     Chartis Ins Co (CAN)                    AIG                11    18 113%    115% A          Co-operators General Ins Co    The Co-operators Grp Ltd     6    3    60% 89%   A-
        Manitoba Total                                         183   144 85%     67%                 New Brunswick Total                                    94   56    64% 69%
   Newfoundland & Labrador                   FY'09            $Mn                                    Northwest Territories               FY'09             $Mn
  Top 5 Underwriters by DPW                GROUP              DPW DCI DLR        APLR FSR        Top 5 Underwriters by DPW              GROUP              DPW   DCI   DLR APLR FSR
Lombard General Ins Co (CAN)         Fairfax Financial Grp      7     2   34%    38%   A                 Zurich Ins Co                   Zurich              5   0.5   10% 67%   A
      Aviva Ins Co (CAN)                     Aviva              6      2  45%    44%   A-             Aviva Ins Co (CAN)                 Aviva               3    2    58% 56%   A-
      RSA Ins Co (CAN)                       RSA                 5     5  114%   67%   A             Chartis Ins Co (CAN)                 AIG                2   0.5   17% 26%   A
      Factory Mtl Ins Co                FM Global Grp            5     7  144%   143% A+         Co-operators General Ins Co    The Co-operators Grp Ltd     2   n/m    n/a 41%  A-
     Lloyd's Underwriters                   Lloyd's              5     3  50%    19%   A             Lloyd's Underwriters               Lloyd's              2   0.3   16%   n/a A
Newfoundland & Labrador Total                                   59    40  74%    61%              Northwest Territories Total                               23    11   54% 58%
           Nova Scotia                      FY'09             $Mn                                           Nunavut                     FY'09              $Mn
  Top 5 Underwriters by DPW                GROUP              DPW DCI DLR        APLR FSR        Top 5 Underwriters by DPW             GROUP               DPW   DCI   DLR APLR FSR
          Intact Ins Co                   ING Grp               13    9   72%    62% A+              Lloyd's Underwriters               Lloyd's              3    2    86% 196% A
      RSA Ins Co (CAN)                      RSA                 10    5   56%    52%   A             Chartis Ins Co (CAN)                 AIG                2   n/m    n/a n/a  A
    Economical Mtl Ins Co            Economical Ins Grp         9     11 123%    58% B++              Factory Mtl Ins Co             FM Global Grp           1   n/a    n/a n/a  A+
      Aviva Ins Co (CAN)                    Aviva               8     4   47%    35%   A-                 ACE INA Ins                    ACE                 1   0.2   28% 26% A+
   Sovereign General Ins Co        The Co-operators Grp Ltd     6     4   80%    69% B++           Westport Ins Corporation            Swiss Re              1   0.3   45% 45%   A
       Nova Scotia Total                                       105    58  61%    53%                     Nunavut Total                                       8    3    55% 79%
             Ontario                      FY'09               $Mn                                        Out of Canada                    FY'09            $Mn
  Top 5 Underwriters by DPW              GROUP                DPW DCI DLR        APLR FSR        Top 5 Underwriters by DPW              GROUP              DPW   DCI   DLR APLR FSR
      Aviva Ins Co (CAN)                   Aviva               168   142 89%     92%   A-           Commonwealth Ins Co           Fairfax Financial Grp     91    5     5%   n/a A
          Intact Ins Co                  ING Grp               146   114 80%     76% A+              Chartis Ins Co (CAN)                  AIG              11    3    43% 170% A
    Economical Mtl Ins Co            Economical Ins Grp        128    89  68%    83% B++         Allianz Gbl Risks US Ins Co             Allianz             7    1    12%   6%  A+
         Zurich Ins Co                    Zurich               102    64  59%    67%   A                  ACE INA Ins                     ACE                3   n/m    n/a 20% A+
     Lloyd's Underwriters                 Lloyd's               94   106 113%    55%   A                   Pool Ins Co                   Viterra             3   n/a    n/a  n/a B+
         Ontario Total                                        1,545 1,124 77%    82%                 Out of Canada Total                                   120    9     7%  34%
     Prince Edward Island                   FY'09             $Mn                                            Quebec                      FY'09             $Mn
  Top 5 Underwriters by DPW                GROUP              DPW DCI DLR        APLR FSR        Top 5 Underwriters by DPW              GROUP              DPW   DCI DLR APLR FSR
 Co-operators General Ins Co       The Co-operators Grp Ltd     2     0   24%    45%   A-                 Intact Ins Co                 ING Grp            142    93 69% 61% A+
     Lloyd's Underwriters                  Lloyd's              2     1   30%    15%   A             Lloyd's Underwriters                Lloyd's            79    81 102% 56%  A
      Aviva Ins Co (CAN)                    Aviva               1      4  270%   65%   A-             Aviva Ins Co (CAN)                  Aviva             72    56 78% 61%   A-
          Intact Ins Co                   ING Grp               1     1   104%   53% A+              Chartis Ins Co (CAN)                  AIG              62    55 81% 114% A
     Chartis Ins Co (CAN)                    AIG                1     2   153%   46%   A                 Zurich Ins Co                   Zurich             55    35 66% 62%   A
  Prince Edward Island Total                                    17    14  90%    48%                     Quebec Total                                      760   544 79% 66%
        Saskatchewan                        FY'09             $Mn                                            Yukon                       FY'09             $Mn
  Top 5 Underwriters by DPW                GROUP              DPW DCI DLR        DLR   FSR       Top 5 Underwriters by DPW              GROUP              DPW   DCI   DLR APLR FSR
     Wawanesa Mtl Ins Co                 Unaffiliated           37    17  47%    48%    A+            Aviva Ins Co (CAN)                 Aviva               2   0.3   21% 41%   A-
      Aviva Ins Co (CAN)                    Aviva               23    16  72%    63%    A-           Lloyd's Underwriters               Lloyd's              1   0.2   22% 53%   A
 Co-operators General Ins Co       The Co-operators Grp Ltd     21     9  43%    62%    A-           Chartis Ins Co (CAN)                 AIG                1   n/m    n/a  n/a A
     Chartis Ins Co (CAN)                    AIG                14     6  41%    51%    A        Allianz Gbl Risks US Ins Co            Allianz              1   0.1   20%   5%  A+
     Lloyd's Underwriters                  Lloyd's              11     8  72%    26%    A             RSA Ins Co (CAN)                   RSA                 1   0.0    5%  25%  A
     Saskatchewan Total                                        210    87  45%    41%                       Yukon Total                                       9    1     9%  31%


                                                                                          Canadian Update: Commercial Property                                                 3
Aon Global Risk Insight Platform (Aon GRIPTM) is the world’s leading global repository of global risk and insurance
                                                                                  Quarterly Update
placement information. By providing fact-based insights into Aon’s USD $54 billion in global premium flow, Aon GRIP
helps identify the best placement option regardless of size, industry, coverage line or geography.
       Q3/09                                                                             Construction
The Web-accessible data produced by Aon GRIP helps Aon brokers evaluate which markets to approach with a
placement and which carriers may provide the best value for clients. It also gives Aon brokers a leg up when it comes to
negotiations, making sure every conversation is based on the most complete, most current set of facts.


GLOSSARY
     •   DPW: Direct Premiums Written in the period for the specific line of business without taking into account
         premiums ceded or premiums assumed under reinsurance.
     •   DPE: Direct Premiums Earned is the portion of direct premiums written attributable to the risks borne by the
         insurer during the accounting year.
     •   DCI: Direct Claims Incurred in the period (including prior year development and forward estimates of losses)
         for the specific line of business without taking into account losses ceded or losses assumed under
         reinsurance.
     •   DLR: Direct Loss Ratio is a primary component of underwriting profitability. It is calculated as Direct Claims
         Incurred / Direct Premiums Earned. The ratio excludes any impact from reinsurance.
     •   APLR: All Products Loss Ratio (as direct loss ratio but for all non-life products).
     •   FSR: Financial Strength Rating by A.M. Best.
     •   Commercial P&C market is estimated by subtracting the following insurance lines from the aggregate P&C
         market: Personal property, accident and sickness, and 85% of auto premium and losses.


This report has been compiled for you on behalf of
Christine Lithgow
Executive Vice President
National Client Service - Market Relations
T: 1 416 868 5638
e: christine.lithgow@aon.ca


CONTACTS
Please direct any questions about this report to:

Nicholas Keye, CFA                                      Susie Crawford
The Aon Centre for Innovation and Analytics             The Aon Centre for Innovation and Analytics
T: +353 1 266 6419                                      T: +353 1 266 6512
e:nick_keye@aon.ie                                       e: susie_crawford@aon.ie


DISCLAIMER
Aon does not provide or express an opinion or recommendation regarding any company or matter mentioned
herein. The recipient understands that Aon has endeavored to include information known to it which it believes to
be relevant to the recipient. The recipient further understands that neither Aon nor its employees shall make any
representation or warranty as to the accuracy or completeness of this information. Aon shall not have any liability
to the recipient or any other party resulting from the use of this information by the recipient or such other party.

Copyright 2010 Aon Commercial Services and Operations Ireland Limited. For use only by an Aon employee for
client purposes. May not be reproduced in any way or disseminated to an insurance company or to any other
party without the prior written consent of Aon Commercial Services and Operations Ireland Limited.


                                                               Canadian Update: Commercial Property                   4

More Related Content

Featured

2024 State of Marketing Report – by Hubspot
2024 State of Marketing Report – by Hubspot2024 State of Marketing Report – by Hubspot
2024 State of Marketing Report – by HubspotMarius Sescu
 
Everything You Need To Know About ChatGPT
Everything You Need To Know About ChatGPTEverything You Need To Know About ChatGPT
Everything You Need To Know About ChatGPTExpeed Software
 
Product Design Trends in 2024 | Teenage Engineerings
Product Design Trends in 2024 | Teenage EngineeringsProduct Design Trends in 2024 | Teenage Engineerings
Product Design Trends in 2024 | Teenage EngineeringsPixeldarts
 
How Race, Age and Gender Shape Attitudes Towards Mental Health
How Race, Age and Gender Shape Attitudes Towards Mental HealthHow Race, Age and Gender Shape Attitudes Towards Mental Health
How Race, Age and Gender Shape Attitudes Towards Mental HealthThinkNow
 
AI Trends in Creative Operations 2024 by Artwork Flow.pdf
AI Trends in Creative Operations 2024 by Artwork Flow.pdfAI Trends in Creative Operations 2024 by Artwork Flow.pdf
AI Trends in Creative Operations 2024 by Artwork Flow.pdfmarketingartwork
 
PEPSICO Presentation to CAGNY Conference Feb 2024
PEPSICO Presentation to CAGNY Conference Feb 2024PEPSICO Presentation to CAGNY Conference Feb 2024
PEPSICO Presentation to CAGNY Conference Feb 2024Neil Kimberley
 
Content Methodology: A Best Practices Report (Webinar)
Content Methodology: A Best Practices Report (Webinar)Content Methodology: A Best Practices Report (Webinar)
Content Methodology: A Best Practices Report (Webinar)contently
 
How to Prepare For a Successful Job Search for 2024
How to Prepare For a Successful Job Search for 2024How to Prepare For a Successful Job Search for 2024
How to Prepare For a Successful Job Search for 2024Albert Qian
 
Social Media Marketing Trends 2024 // The Global Indie Insights
Social Media Marketing Trends 2024 // The Global Indie InsightsSocial Media Marketing Trends 2024 // The Global Indie Insights
Social Media Marketing Trends 2024 // The Global Indie InsightsKurio // The Social Media Age(ncy)
 
Trends In Paid Search: Navigating The Digital Landscape In 2024
Trends In Paid Search: Navigating The Digital Landscape In 2024Trends In Paid Search: Navigating The Digital Landscape In 2024
Trends In Paid Search: Navigating The Digital Landscape In 2024Search Engine Journal
 
5 Public speaking tips from TED - Visualized summary
5 Public speaking tips from TED - Visualized summary5 Public speaking tips from TED - Visualized summary
5 Public speaking tips from TED - Visualized summarySpeakerHub
 
ChatGPT and the Future of Work - Clark Boyd
ChatGPT and the Future of Work - Clark Boyd ChatGPT and the Future of Work - Clark Boyd
ChatGPT and the Future of Work - Clark Boyd Clark Boyd
 
Getting into the tech field. what next
Getting into the tech field. what next Getting into the tech field. what next
Getting into the tech field. what next Tessa Mero
 
Google's Just Not That Into You: Understanding Core Updates & Search Intent
Google's Just Not That Into You: Understanding Core Updates & Search IntentGoogle's Just Not That Into You: Understanding Core Updates & Search Intent
Google's Just Not That Into You: Understanding Core Updates & Search IntentLily Ray
 
Time Management & Productivity - Best Practices
Time Management & Productivity -  Best PracticesTime Management & Productivity -  Best Practices
Time Management & Productivity - Best PracticesVit Horky
 
The six step guide to practical project management
The six step guide to practical project managementThe six step guide to practical project management
The six step guide to practical project managementMindGenius
 
Beginners Guide to TikTok for Search - Rachel Pearson - We are Tilt __ Bright...
Beginners Guide to TikTok for Search - Rachel Pearson - We are Tilt __ Bright...Beginners Guide to TikTok for Search - Rachel Pearson - We are Tilt __ Bright...
Beginners Guide to TikTok for Search - Rachel Pearson - We are Tilt __ Bright...RachelPearson36
 

Featured (20)

2024 State of Marketing Report – by Hubspot
2024 State of Marketing Report – by Hubspot2024 State of Marketing Report – by Hubspot
2024 State of Marketing Report – by Hubspot
 
Everything You Need To Know About ChatGPT
Everything You Need To Know About ChatGPTEverything You Need To Know About ChatGPT
Everything You Need To Know About ChatGPT
 
Product Design Trends in 2024 | Teenage Engineerings
Product Design Trends in 2024 | Teenage EngineeringsProduct Design Trends in 2024 | Teenage Engineerings
Product Design Trends in 2024 | Teenage Engineerings
 
How Race, Age and Gender Shape Attitudes Towards Mental Health
How Race, Age and Gender Shape Attitudes Towards Mental HealthHow Race, Age and Gender Shape Attitudes Towards Mental Health
How Race, Age and Gender Shape Attitudes Towards Mental Health
 
AI Trends in Creative Operations 2024 by Artwork Flow.pdf
AI Trends in Creative Operations 2024 by Artwork Flow.pdfAI Trends in Creative Operations 2024 by Artwork Flow.pdf
AI Trends in Creative Operations 2024 by Artwork Flow.pdf
 
Skeleton Culture Code
Skeleton Culture CodeSkeleton Culture Code
Skeleton Culture Code
 
PEPSICO Presentation to CAGNY Conference Feb 2024
PEPSICO Presentation to CAGNY Conference Feb 2024PEPSICO Presentation to CAGNY Conference Feb 2024
PEPSICO Presentation to CAGNY Conference Feb 2024
 
Content Methodology: A Best Practices Report (Webinar)
Content Methodology: A Best Practices Report (Webinar)Content Methodology: A Best Practices Report (Webinar)
Content Methodology: A Best Practices Report (Webinar)
 
How to Prepare For a Successful Job Search for 2024
How to Prepare For a Successful Job Search for 2024How to Prepare For a Successful Job Search for 2024
How to Prepare For a Successful Job Search for 2024
 
Social Media Marketing Trends 2024 // The Global Indie Insights
Social Media Marketing Trends 2024 // The Global Indie InsightsSocial Media Marketing Trends 2024 // The Global Indie Insights
Social Media Marketing Trends 2024 // The Global Indie Insights
 
Trends In Paid Search: Navigating The Digital Landscape In 2024
Trends In Paid Search: Navigating The Digital Landscape In 2024Trends In Paid Search: Navigating The Digital Landscape In 2024
Trends In Paid Search: Navigating The Digital Landscape In 2024
 
5 Public speaking tips from TED - Visualized summary
5 Public speaking tips from TED - Visualized summary5 Public speaking tips from TED - Visualized summary
5 Public speaking tips from TED - Visualized summary
 
ChatGPT and the Future of Work - Clark Boyd
ChatGPT and the Future of Work - Clark Boyd ChatGPT and the Future of Work - Clark Boyd
ChatGPT and the Future of Work - Clark Boyd
 
Getting into the tech field. what next
Getting into the tech field. what next Getting into the tech field. what next
Getting into the tech field. what next
 
Google's Just Not That Into You: Understanding Core Updates & Search Intent
Google's Just Not That Into You: Understanding Core Updates & Search IntentGoogle's Just Not That Into You: Understanding Core Updates & Search Intent
Google's Just Not That Into You: Understanding Core Updates & Search Intent
 
How to have difficult conversations
How to have difficult conversations How to have difficult conversations
How to have difficult conversations
 
Introduction to Data Science
Introduction to Data ScienceIntroduction to Data Science
Introduction to Data Science
 
Time Management & Productivity - Best Practices
Time Management & Productivity -  Best PracticesTime Management & Productivity -  Best Practices
Time Management & Productivity - Best Practices
 
The six step guide to practical project management
The six step guide to practical project managementThe six step guide to practical project management
The six step guide to practical project management
 
Beginners Guide to TikTok for Search - Rachel Pearson - We are Tilt __ Bright...
Beginners Guide to TikTok for Search - Rachel Pearson - We are Tilt __ Bright...Beginners Guide to TikTok for Search - Rachel Pearson - We are Tilt __ Bright...
Beginners Guide to TikTok for Search - Rachel Pearson - We are Tilt __ Bright...
 

Canadian Property Insurance Market Update - Summer 2010

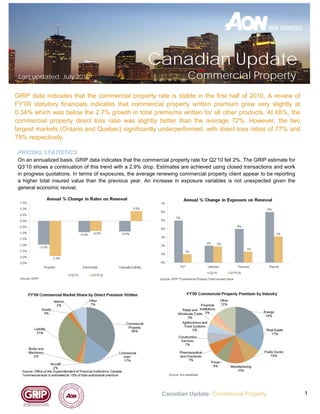
  • 1. Canadian Update Last updated: July 2010 Commercial Property GRIP data indicates that the commercial property rate is stable in the first half of 2010. A review of FY’09 statutory financials indicates that commercial property written premium grew very slightly at 0.34% which was below the 2.7% growth in total premiums written for all other products. At 68%, the commercial property direct loss ratio was slightly better than the average 72%. However, the two largest markets (Ontario and Quebec) significantly underperformed, with direct loss ratios of 77% and 79% respectively. PRICING STATISTICS On an annualized basis, GRIP data indicates that the commercial property rate for Q2’10 fell 2%. The GRIP estimate for Q3’10 shows a continuation of this trend with a 2.9% drop. Estimates are achieved using closed transactions and work in progress quotations. In terms of exposures, the average renewing commercial property client appear to be reporting a higher total insured value than the previous year. An increase in exposure variables is not unexpected given the general economic revival. Canadian Update: Commercial Property 1
  • 2. STATISTICS and FINANCIALS: Ten years of loss data show that flooding has been the principal cause of property losses at 21%, followed by windstorms at 15%. In geographic terms, Quebec reports a large share of property losses at 36% (relative to its share of economic activity (GDP) at approximately 20%). With the exception of the Quebec ice storm in 1998, the top ten natural disasters by property losses are relatively benign in the context of industry profitability. Written premium grew very slightly in FY’09 at 1.1%. This is likely to have been caused by a combination of Quarterly Update Q3/09 reduced economic activity and a soft rate market. Positively, loss cost growth was similarly subdued at -0.03% and likely to have benefitted somewhat from the recent negative trend in commercial construction prices. Construction The FY’09 Canadian direct loss ratio for commercial property of 68% was slightly below the all product average of 72%. However, the two largest markets Ontario and Quebec had a direct loss ratio significantly above average at 77% and 79% respectively. The Lloyd's market was the largest writer of both commercial property and all commercial premium at a national level. Top 10 Canadian Natural Disasters by Property Losses $mn Year Loss $mn Territory Event Note 1998 1,377 Quebec Ice storm Greatest natural disaster in Canadian history with over 650,000 property claims filed 2005 500 Ontario Rainstorm Significant damage caused to more than 500,000 homes 2009 365 Alberta Hailstorm Powerful hail and wind storm hits rural Alberta 2005 300 Alberta Flooding Southern parts of the Alberta territory suffer extensive flooding 1996 288 Quebec Flooding Severe flooding results in nearly 17,000 property claims 2003 200 British Columbia Forest Fire Over 3,000 property claims are recorded as forest fires engulf BC's forests 2009 196 Ontario Rainstorm Torrential rain recorded in the Ottawa and Hamilton region of Ontario 2004 188 Alberta Hailstorm Hailstorms in Edmonton and Calgary result in over 17,000 property claims 1993 185 Manitoba Flooding Severe flooding in Winnipeg results in over 21,000 property claims 2008 172 Quebec Storm Severe thunderstorm hit Montreal resulting in massive disruption Source: Insurance Bureau of Canada Canadian Update: Commercial Property 2
  • 3. Quarterly Update Q3/09 Construction Canada FY'09 $Mn Top 5 Underwriters by DPW GROUP DPW DCI DLR APLR FSR Lloyd's Underwriters Lloyd's 464 335 72% 52% A Intact Ins Co ING Grp 461 311 70% 67% A+ Aviva Ins Co (CAN) Aviva 460 358 80% 70% A- Chartis Ins Co (CAN) AIG 382 243 60% 66% A Zurich Ins Co Zurich 308 173 55% 59% A Total 5,065 3,163 68% 72% Source: The Office of the Superintendent of Financial Institutions Canada (OSFI) Alberta FY'09 $Mn British Columbia FY'09 $Mn Top 5 Underwriters by DPW GROUP DPW DCI DLR APLR FSR Top 5 Underwriters by DPW GROUP DPW DCI DLR APLR FSR Chartis Ins Co (CAN) AIG 125 75 62% 26% A Lloyd's Underwriters Lloyd's 121 72 60% 59% A Lloyd's Underwriters Lloyd's 118 43 36% 40% A AXA Pacific Ins Co AXA 77 38 49% 54% A Co-operators General Ins Co The Co-operators Grp Ltd 94 80 85% 60% A- Aviva Ins Co (CAN) Aviva 77 44 58% 57% A- Intact Ins Co ING Grp 82 56 69% 60% A+ Zurich Ins Co Zurich 64 27 41% 45% A Wawanesa Mtl Ins Co Unaffiliated 72 64 94% 80% A+ Economical Mtl Ins Co Economical Ins Grp 57 40 73% 65% B++ Alberta Total 1,019 644 71% 60% British Columbia Total 914 427 54% 60% Manitoba FY'09 $Mn New Brunswick FY'09 $Mn Top 5 Underwriters by DPW GROUP DPW DCI DLR APLR FSR Top 5 Underwriters by DPW GROUP DPW DCI DLR APLR FSR Wawanesa Mtl Ins Co Unaffiliated 26 14 57% 65% A+ Lloyd's Underwriters Lloyd's 9 5 60% 44% A Aviva Ins Co (CAN) Aviva 24 27 118% 80% A- Aviva Ins Co (CAN) Aviva 8 5 59% 62% A- Intact Ins Co ING Grp 16 12 74% 79% A+ Factory Mtl Ins Co FM Global Grp 8 0.1 2% 3% A+ Lloyd's Underwriters Lloyd's 14 11 81% 46% A Chartis Ins Co (CAN) AIG 6 1 17% 66% A Chartis Ins Co (CAN) AIG 11 18 113% 115% A Co-operators General Ins Co The Co-operators Grp Ltd 6 3 60% 89% A- Manitoba Total 183 144 85% 67% New Brunswick Total 94 56 64% 69% Newfoundland & Labrador FY'09 $Mn Northwest Territories FY'09 $Mn Top 5 Underwriters by DPW GROUP DPW DCI DLR APLR FSR Top 5 Underwriters by DPW GROUP DPW DCI DLR APLR FSR Lombard General Ins Co (CAN) Fairfax Financial Grp 7 2 34% 38% A Zurich Ins Co Zurich 5 0.5 10% 67% A Aviva Ins Co (CAN) Aviva 6 2 45% 44% A- Aviva Ins Co (CAN) Aviva 3 2 58% 56% A- RSA Ins Co (CAN) RSA 5 5 114% 67% A Chartis Ins Co (CAN) AIG 2 0.5 17% 26% A Factory Mtl Ins Co FM Global Grp 5 7 144% 143% A+ Co-operators General Ins Co The Co-operators Grp Ltd 2 n/m n/a 41% A- Lloyd's Underwriters Lloyd's 5 3 50% 19% A Lloyd's Underwriters Lloyd's 2 0.3 16% n/a A Newfoundland & Labrador Total 59 40 74% 61% Northwest Territories Total 23 11 54% 58% Nova Scotia FY'09 $Mn Nunavut FY'09 $Mn Top 5 Underwriters by DPW GROUP DPW DCI DLR APLR FSR Top 5 Underwriters by DPW GROUP DPW DCI DLR APLR FSR Intact Ins Co ING Grp 13 9 72% 62% A+ Lloyd's Underwriters Lloyd's 3 2 86% 196% A RSA Ins Co (CAN) RSA 10 5 56% 52% A Chartis Ins Co (CAN) AIG 2 n/m n/a n/a A Economical Mtl Ins Co Economical Ins Grp 9 11 123% 58% B++ Factory Mtl Ins Co FM Global Grp 1 n/a n/a n/a A+ Aviva Ins Co (CAN) Aviva 8 4 47% 35% A- ACE INA Ins ACE 1 0.2 28% 26% A+ Sovereign General Ins Co The Co-operators Grp Ltd 6 4 80% 69% B++ Westport Ins Corporation Swiss Re 1 0.3 45% 45% A Nova Scotia Total 105 58 61% 53% Nunavut Total 8 3 55% 79% Ontario FY'09 $Mn Out of Canada FY'09 $Mn Top 5 Underwriters by DPW GROUP DPW DCI DLR APLR FSR Top 5 Underwriters by DPW GROUP DPW DCI DLR APLR FSR Aviva Ins Co (CAN) Aviva 168 142 89% 92% A- Commonwealth Ins Co Fairfax Financial Grp 91 5 5% n/a A Intact Ins Co ING Grp 146 114 80% 76% A+ Chartis Ins Co (CAN) AIG 11 3 43% 170% A Economical Mtl Ins Co Economical Ins Grp 128 89 68% 83% B++ Allianz Gbl Risks US Ins Co Allianz 7 1 12% 6% A+ Zurich Ins Co Zurich 102 64 59% 67% A ACE INA Ins ACE 3 n/m n/a 20% A+ Lloyd's Underwriters Lloyd's 94 106 113% 55% A Pool Ins Co Viterra 3 n/a n/a n/a B+ Ontario Total 1,545 1,124 77% 82% Out of Canada Total 120 9 7% 34% Prince Edward Island FY'09 $Mn Quebec FY'09 $Mn Top 5 Underwriters by DPW GROUP DPW DCI DLR APLR FSR Top 5 Underwriters by DPW GROUP DPW DCI DLR APLR FSR Co-operators General Ins Co The Co-operators Grp Ltd 2 0 24% 45% A- Intact Ins Co ING Grp 142 93 69% 61% A+ Lloyd's Underwriters Lloyd's 2 1 30% 15% A Lloyd's Underwriters Lloyd's 79 81 102% 56% A Aviva Ins Co (CAN) Aviva 1 4 270% 65% A- Aviva Ins Co (CAN) Aviva 72 56 78% 61% A- Intact Ins Co ING Grp 1 1 104% 53% A+ Chartis Ins Co (CAN) AIG 62 55 81% 114% A Chartis Ins Co (CAN) AIG 1 2 153% 46% A Zurich Ins Co Zurich 55 35 66% 62% A Prince Edward Island Total 17 14 90% 48% Quebec Total 760 544 79% 66% Saskatchewan FY'09 $Mn Yukon FY'09 $Mn Top 5 Underwriters by DPW GROUP DPW DCI DLR DLR FSR Top 5 Underwriters by DPW GROUP DPW DCI DLR APLR FSR Wawanesa Mtl Ins Co Unaffiliated 37 17 47% 48% A+ Aviva Ins Co (CAN) Aviva 2 0.3 21% 41% A- Aviva Ins Co (CAN) Aviva 23 16 72% 63% A- Lloyd's Underwriters Lloyd's 1 0.2 22% 53% A Co-operators General Ins Co The Co-operators Grp Ltd 21 9 43% 62% A- Chartis Ins Co (CAN) AIG 1 n/m n/a n/a A Chartis Ins Co (CAN) AIG 14 6 41% 51% A Allianz Gbl Risks US Ins Co Allianz 1 0.1 20% 5% A+ Lloyd's Underwriters Lloyd's 11 8 72% 26% A RSA Ins Co (CAN) RSA 1 0.0 5% 25% A Saskatchewan Total 210 87 45% 41% Yukon Total 9 1 9% 31% Canadian Update: Commercial Property 3
  • 4. Aon Global Risk Insight Platform (Aon GRIPTM) is the world’s leading global repository of global risk and insurance Quarterly Update placement information. By providing fact-based insights into Aon’s USD $54 billion in global premium flow, Aon GRIP helps identify the best placement option regardless of size, industry, coverage line or geography. Q3/09 Construction The Web-accessible data produced by Aon GRIP helps Aon brokers evaluate which markets to approach with a placement and which carriers may provide the best value for clients. It also gives Aon brokers a leg up when it comes to negotiations, making sure every conversation is based on the most complete, most current set of facts. GLOSSARY • DPW: Direct Premiums Written in the period for the specific line of business without taking into account premiums ceded or premiums assumed under reinsurance. • DPE: Direct Premiums Earned is the portion of direct premiums written attributable to the risks borne by the insurer during the accounting year. • DCI: Direct Claims Incurred in the period (including prior year development and forward estimates of losses) for the specific line of business without taking into account losses ceded or losses assumed under reinsurance. • DLR: Direct Loss Ratio is a primary component of underwriting profitability. It is calculated as Direct Claims Incurred / Direct Premiums Earned. The ratio excludes any impact from reinsurance. • APLR: All Products Loss Ratio (as direct loss ratio but for all non-life products). • FSR: Financial Strength Rating by A.M. Best. • Commercial P&C market is estimated by subtracting the following insurance lines from the aggregate P&C market: Personal property, accident and sickness, and 85% of auto premium and losses. This report has been compiled for you on behalf of Christine Lithgow Executive Vice President National Client Service - Market Relations T: 1 416 868 5638 e: christine.lithgow@aon.ca CONTACTS Please direct any questions about this report to: Nicholas Keye, CFA Susie Crawford The Aon Centre for Innovation and Analytics The Aon Centre for Innovation and Analytics T: +353 1 266 6419 T: +353 1 266 6512 e:nick_keye@aon.ie e: susie_crawford@aon.ie DISCLAIMER Aon does not provide or express an opinion or recommendation regarding any company or matter mentioned herein. The recipient understands that Aon has endeavored to include information known to it which it believes to be relevant to the recipient. The recipient further understands that neither Aon nor its employees shall make any representation or warranty as to the accuracy or completeness of this information. Aon shall not have any liability to the recipient or any other party resulting from the use of this information by the recipient or such other party. Copyright 2010 Aon Commercial Services and Operations Ireland Limited. For use only by an Aon employee for client purposes. May not be reproduced in any way or disseminated to an insurance company or to any other party without the prior written consent of Aon Commercial Services and Operations Ireland Limited. Canadian Update: Commercial Property 4