Beginners Guide to TikTok for Search - Rachel Pearson - We are Tilt __ Bright...
Initiative Back to School Infographic 2016 - 08.09.16
1. INSIGHT SERIES
With Back to School just around the corner, Initiative has conducted a study targeting full-time Canadian
students 18-24 and parents of school aged children 3-17 to understand consumer behavior around this busy
time. Our research strives to determine the student-parent spending power, what they are purchasing and
other relative trends.
The average expenditure on
education by all household in
Canada is $1,502*. That includes
tuition, textbooks and school
supplies
Contact: Nish.Shah@initiative.com
Sources:
Initiative Back to School Study 2016
*Statistics Canada
Base: Canadian 18-24 full time students and Parents with
children 3-17
WHAT DOES THIS MEAN FOR BRANDS?
ON AVERAGE, PARENTS TEND TO SPEND 2X MORE THAN
STUDENTS
Average spending on Back to School products
On average, parents
spend $480 for their
children on back to
school products
On average, students
spend $208 for back to
school products
$480 $208
Parents and students tend to buy
different items. Defining your
creative to target the right
audience is crucial.
STUDENTS TEND TO BE LAST MINUTE SHOPPERS
Parents Students
8% After school starts 18%
24% One week in advance 28%
32% 2-3 weeks in advance 29%
17% 4-5 weeks in advance 14%
7% 6-8 weeks in advance 7%
12%
More than 2 months in
advance
4%
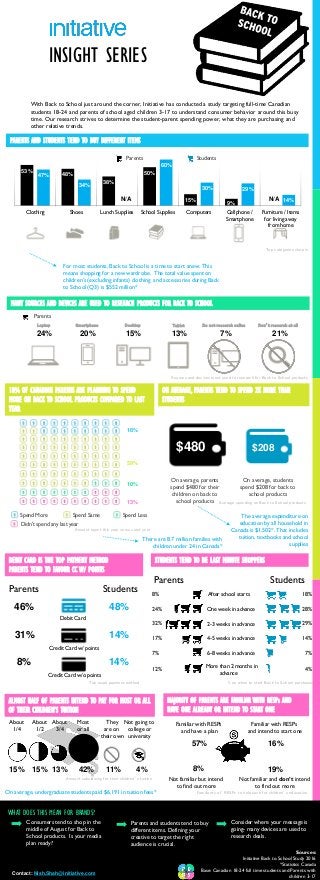
PARENTS AND STUDENTS TEND TO BUY DIFFERENT ITEMS
53%
48%
38%
50%
15%
9%
47%
34%
60%
30% 29%
14%
Clothing Shoes Lunch Supplies School Supplies Computers Cellphone /
Smartphone
Furniture / Items
for living away
from home
Parents Students
Top categories shop in
N/A N/A
18% OF CANADIAN PARENTS ARE PLANNING TO SPEND
MORE ON BACK TO SCHOOL PRODUCTS COMPARED TO LAST
YEAR
Spend More Spend Same Spend Less
Amount spent this year versus last year
18%
59%
10%
13%
Didn't spend any last year
MANY SOURCES AND DEVICES ARE USED TO RESEARCH PRODUCTS FOR BACK TO SCHOOL
Parents
Laptop Smartphone Desktop Tablet Do not research online Don’t research at all
24% 20% 15% 13% 7%
Sources and devices most used to research for Back to School products
21%
Consider where your message is
going- many devices are used to
research deals.
Consumers tend to shop in the
middle of August for Back to
School products. Is your media
plan ready?
For most students, Back to School is a time to start anew. This
means shopping for a new wardrobe. The total value spent on
children’s (excluding infants) clothing and accessories during Back
to School (Q3) is $552 million*
There are 8.7 million families with
children under 24 in Canada*
On average, undergraduate students paid $6,191 in tuition fees*
ALMOST HALF OF PARENTS INTEND TO PAY FOR MOST OR ALL
OF THEIR CHILDREN’S TUITION
Amount subsidizing for their children’s tuition
15% 15% 13% 42% 11% 4%
About
1/4
About
1/2
About
3/4
Most
or all
They
are on
their own
Not going to
college or
university
% on when to start Back to School purchases
Familiarity of RESPs to help save for children’s education
Familiar with RESPs
and have a plan
Familiar with RESPs
and intend to start one
Not familiar but intend
to find out more
Not familiar and don’t intend
to find out more
57% 16%
8% 19%
MAJORITY OF PARENTS ARE FAMILIAR WITH RESPs AND
HAVE ONE ALREADY OR INTEND TO START ONE
DEBIT CARD IS THE TOP PAYMENT METHOD
PARENTS TEND TO FAVOUR CC W/ POINTS
Top usual payment method
Parents Students
Debit Card
Credit Card w/ points
46% 48%
14%31%
Credit Card w/o points
8% 14%