State of the Construction Industry Report (2015)
•
1 like•158 views

Bill McConnell presents the analysis of the state of the construction industry.

Recommended
Recommended
More Related Content
What's hot
What's hot (13)
Similar to State of the Construction Industry Report (2015)
Similar to State of the Construction Industry Report (2015) (20)
More from The Vertex Companies, LLC
More from The Vertex Companies, LLC (19)
Recently uploaded
Recently uploaded (20)
State of the Construction Industry Report (2015)
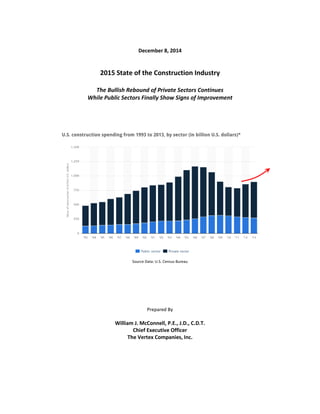
- 1. December 8, 2014 2015 State of the Construction Industry The Bullish Rebound of Private Sectors Continues While Public Sectors Finally Show Signs of Improvement Source Data: U.S. Census Bureau Prepared By William J. McConnell, P.E., J.D., C.D.T. Chief Executive Officer The Vertex Companies, Inc.
- 2. December 8, 2014 2015 State of the Construction Industry Page 2 of 42 I. Executive Summary This report covers the anticipated performance of the construction industry in 2015. Construction is nearly a trillion dollar industry that makes up approximately 7 percent of the U.S. gross domestic product (“GDP”). Prior to the Great Recession, the construction industry outpaced the growth of the GDP by a wide margin hence the burst of the residential bubble. In hindsight, that should have come as no surprise. The lesson learned is that the performance of the construction industry is inescapably intertwined with the performance of the U.S. economy; thus, if empirical data proves that the growth of the construction industry is materially divergent to that of the overall economy, such divergence is indicative of an imminent downward correction or bullish return. Source Data: U.S. Census Bureau Because the construction industry underperformed in comparison to the overall economy between 2009 and 2013, a bullish return was imminent. 2014 was the tipping point for construction’s rebound as overall growth is forecasted at 4 percent, which outpaces forecasted GDP results by approximately 100 basis points. The bullish return should continue into 2015 as the construction industry is well positioned for improved growth. More of the public sectors will rally back from a five year setback. Public construction spending will improve due to the increasing tax base and rising bond measures. The Federal Government (“Fed”) will likely address inflationary pressures from the expanding economy in the second half of 2015 with an increase in interest rates; this will be the first rate adjustment in over five years. This measure will certainly constrain growth in a number of flourishing private sectors such as Residential, Office, Commercial, and Lodging; however, the backlash should be somewhat offset if lending institutions ease current restrictions to promote loans to those without perfect credit. Despite the widely anticipated rate adjustment, 2015 will likely prove to be the most well-rounded growth year for construction in over a decade. As a result, contractor profitability should edge upwards through this return and the main constraint to growth will be locating qualified construction managers and craftsman to execute the work.
- 3. December 8, 2014 2015 State of the Construction Industry Page 3 of 42 II. State of the U.S. Economy 2014 was supposed to be the year when rock-bottom interest rates began to lift as the Federal Reserve eased its foot off the stimulus pedal and economic growth pushed borrowing costs higher; this fear never materialized. Consequently, corporations took full advantage of the remaining low interest environment by raising cheap debt to implement stock buyback programs and this, coupled with low wage rates and failing energy prices, yielded record profits. While record corporate profits caused a surge in the stock market, the GNP is only up approximately 3 percent in 2014 because corporations only deployed a limited amount of funds to capital expenditures and hiring. As a result, low wage growth has held consumer spending in check. In addition, credit for homebuyers remains restrictive, which has caused a soft housing recovery. In sum, the overall economy finds itself in a peculiar position—corporations have never been healthier but the GDP is rising below historical averages. Inflation is also below the target level based in large part due to the falling energy prices. Economists forecast that corporations are starting to make more and more capital expenditures and labor wages will increase in 2015, which should result in improved GDP growth in 2015. The risk of an economic setback in 2015 continues to be an upward adjustment to interest rates. A. Unemployment The U.S. unemployment rate has declined steadily since 2009 as the economy has progressively improved. As of October-2014, unemployment stands at 5.8 percent—the lowest level since July of 2008 (two months prior to the collapse of Lehman Brothers).1 An unemployment rate of 5.0 percent is considered full employment due to the transitional nature of the labor market. Source Data: Bureau of Labor Statistics 1 http://data.bls.gov/timeseries/LNS14000000
- 4. December 8, 2014 2015 State of the Construction Industry Page 4 of 42 B. Inflation The Federal Open Market Committee (“FOMC”) targets an inflation rate of 2 percent; the FOMC typically lowers the Federal Funds Rate when inflation is over 2 percent and lowers the rate, to the extent possible, when inflation is below this target level.2 Over the past six years, inflation has been low as a result of poor economic conditions. Now that circumstances are improving, one would expect a significant increase in the all-items CPI; however, this has not been the case due to the free-falling energy prices over the past year. As of September of 2014, the all-items CPI stands at 1.7 percent, slightly below the 2 percent mark target. De-escalating energy prices have mitigated the overall effect of modest increases in health care, shelter, and food prices. If energy prices spike in 2015, inflation will certainly eclipse the 2 percent mark in short order.3 Source Data: Bureau of Labor Statistics C. Federal Funds Rate The FOMC reduced the Federal Funds Rate to a historic low of 0 – ¼ percent approximately five years ago to promote economic expansion and to mitigate mortgage foreclosures.4 The economy is almost at a point that warrants a rate increase—unemployment is down and corporate profits are at record levels as noted later in this report. Two issues are currently preventing an immediate increase. First, actual and expected inflation is slightly below the FOMC’s target level of 2 percent.5 Second, the FOMC just recently ended its Quantitative Easing measures so the Government is no longer purchasing short term government assets 2 http://www.federalreserve.gov/faqs/economy_14400.htm 3 http://www.bls.gov/cpi/cpid1409.pdf 4 http://www.federalreserve.gov/default.htm 5 http://www.federalreserve.gov/newsevents/press/monetary/20141029a.htm
- 5. December 8, 2014 2015 State of the Construction Industry Page 5 of 42 to promote economic growth; thus, the Government wants the economy to adjust to this measure in the short term prior to raising rates, which seems inevitable in 2015.6 Typically, the FOMC swiftly raises rates when inflation is evident but due to the “fragility of the economy” it will likely raise rates slowly over the next year.7 Source Data: The Federal Reserve D. GNP Since 1970, the GNP has increased at an average rate of 2.8 percent—annual growth above this mark is deemed strong.8 In early 2014 the harsh winter kept factories idle and consumers at home, which led to a first quarter GDP retraction of 2.1 percent. Once spring hit the economy started to heat up. In the second quarter, real GDP increased at an annual rate of 4.6 percent—the fastest pace in more than two years. Advanced estimates indicate that the GDP increased by 3.9 percent in the third quarter of 2014.9 As a result of poor first quarter performance the overall growth rate for 2014 will likely land just over 3 percent. Leading economists forecast that GDP growth in 2015 will be north of 3 percent.10 6 http://www.nytimes.com/2014/10/30/upshot/quantitative-easing-is-about-to-end-heres-what-it-did-in-seven- charts.html?_r=0 7 Id. 8 http://data.worldbank.org/country/united-states 9 http://www.nytimes.com/2014/09/27/business/economy/-growth-revised-to-46-brightening-the-outlook- .html?_r=0 10 Id.
- 6. December 8, 2014 2015 State of the Construction Industry Page 6 of 42 Source Data: U.S. Department of Commerce E. Tax Revenue As result of the Great Recession, tax receipts slipped to $2.1 trillion in 2009—the lowest level since 2004. As a result of the limited tax income in 2009 and a $600 billion jump in outlays due to the federal stimulus program, the federal deficit hit a record mark (by a factor of three) of $1.4 trillion. While the current deficit remains remarkably high at approximately $650 billion, it is less than half of the 2009 deficit and the deficit has trended downward for five straight years. In addition, the Tax Policy Center forecasts that this downward trend will continue for an additional four years although they don’t anticipate a surplus during this period.11 Source Data: U.S. Office of Management and Budget 11 http://www.taxpolicycenter.org/taxfacts/displayafact.cfm?Docid=200
- 7. December 8, 2014 2015 State of the Construction Industry Page 7 of 42 Source Data: U.S. Office of Management and Budget F. State Economies With few exceptions, states are economically healthier than they have been in years. Overall states have low debt levels when compared to the size of their economies and maintain the ability to cut spending and raise taxes during tough times. The most daunting issue that states face is hefty pension obligations and unfunded employee health-care liabilities. Nearly every state has enacted pension reform that either reduces benefits or increases employee contributions. The oil/natural gas producing states are clearly in the best financial condition due to booming economies, increasing populations, and low debt levels.12 According to a recent article in Barron’s, the top five states include North Dakota, Wyoming, Utah, Nebraska, Iowa, and Alaska.13 The states in the worst economic condition have lackluster economies and underfunded pension issues.14 The bottom five states include Kentucky, Pennsylvania, Connecticut, New Jersey, and Illinois.15 [This portion of the page is left intentionally blank.] 12 http://mercatus.org/publication/state-fiscal-condition-ranking-50-states 13 http://online.barrons.com/articles/states-finances-have-gotten-on-solid-ground-1416633606 14 Id. 15 Id.
- 8. December 8, 2014 2015 State of the Construction Industry Page 8 of 42 Source: Mercatus.org G. Bank Lending Unrestricted lending practices that peaked between 2004 and 2007 triggered the burst of the housing bubble and, as a result, the Great Recession of 2008. Not surprisingly, the Government reacted with the passage of legislative mandates that require tight underwriting standards among mortgage lenders. In addition, many lending institutions went beyond the federal mandates and started to sharply limit mortgage offerings.16 The restriction of credit conditions has led to a soft housing recovery. According to FOMC Chairwoman Janet Yellen, mortgage market conditions remain “abnormally tight.”17 New apartments are popping up at the fastest pace since 1989 as more young households elect to rent rather than buy. The White House believes that single-family home building tends to have bigger tangential effects for consumer spending and job creation. Therefore, White House officials believe improving access to credit is the key to reviving not only housing but the broader economy.18 Obviously, easier credit may sound like a repeat of the subprime mortgage crisis so lenders and legislators will need to proceed with caution. The soft housing market is exacerbated by the lack of income growth from many borrowers. Household income is virtually unchanged from 2012 and 8 percent below their 2007 levels after adjusting for inflation. 16 http://online.wsj.com/articles/easing-mortgage-lending-poses-a-conundrum-1411322579 17 Id. 18 Id.
- 9. December 8, 2014 2015 State of the Construction Industry Page 9 of 42 Source: U.S. Census Bureau H. Debt An ongoing issue that will continue for the foreseeable future is the country’s debt load that continues to increase at an alarming pace. Currently the US debt is approximately $18 trillion. As a percentage of the GDP, the U.S. debt level has risen from 64 percent in 2007 to 105 percent in 2014. Source Data: International Monetary Fund
- 10. December 8, 2014 2015 State of the Construction Industry Page 10 of 42 Source Data: International Monetary Fund I. Energy Crude oil prices dipped considerably in 2014 from $108 per barrel to $77 per barrel. In addition, natural gas prices dropped from from $5.00 to $4.18 per 1,000 per cubic feet. The reductions are a result of massive reserve increases. Recently, the U.S. became the world’s biggest oil producer after overtaking Saudi Arabia and Russia as extraction of energy from shale rock spurs the nation’s economic recovery.19 In addition, the U.S. became the world’s largest natural gas producer in 2010.20 Oil extraction from shale formations in Texas and North Dakota continues to soar as companies split rocks using high-pressure liquid, a process known as hydraulic fracturing. The surge in supply, combined with restrictions on exporting crude, is curbing the price of oil. Regardless of the increase in reserves and improvement in extraction, the Department of Energy recently reported that the U.S. still imports an average of 7.5 million barrels a day of crude.21 As a result of increases in reserves and extraction, the U.S. Commerce Department will likely lift a four-decade ban on most oil exports.22 [This portion of the page is left intentionally blank.] 19 http://www.bloomberg.com/news/2014-07-04/u-s-seen-as-biggest-oil-producer-after-overtaking-saudi.html 20 Id. 21 Id. 22 http://www.wsj.com/articles/u-s-ruling-would-allow-first-shipments-of-unrefined-oil-overseas-1403644494
- 11. December 8, 2014 2015 State of the Construction Industry Page 11 of 42 Source Data: OPEC J. Corporate Profits Corporate profits are at record levels despite only modest gains in gross revenue. Corporations have boosted profits by employing as few workers as possible and by keeping wage growth down— hourly wages are only growing at a 2 percent nominal pace (growth is typically in the 3 to 4 percent range). 23 In addition, continued low interest rate levels allow companies to borrow money for investment purposes. In fact, corporate cash holdings relative to corporate debt is at its lowest level in 15 years.24 Year-to-date, companies have issued $236.6 billion in investment-grade loans, the highest on record, according to ThomsonReuters.25 Rather than deploying the borrowed funds to capital expenditures, corporation’s most noted usage of late has been the trillion dollars or so that have gone to boost share prices through stock buybacks.26 Notwithstanding record debt levels, corporation’s cash level also rose to a record level in 2014, according to Fed data. The combination of hoarding cash while continuing to raise debt and not invest in growth has prompted concern about whether companies are using the low-rate opportunity wisely.27 Once interest rates increase, buyback purchases will not be as attractive to corporations so this bonanza will likely wane in 2015. In fact, Bank of America notes that more companies are now starting to use their cash to invest in growth rather than simply returning money to shareholders. Wall Street analysts predict capital expenditures will double in 2015 based on the low 2013 and 2014 figures. Similarly, Citiroup believes 23 Id. 24 http://www.cnbc.com/id/101481029# 25 Id. 26 http://www.trimtabs.com/global/index.htm 27 Id.
- 12. December 8, 2014 2015 State of the Construction Industry Page 12 of 42 that companies will spend more of their borrowed money on capital expenditures and hiring over the next year.28 Based on improved economic growth the U.S. dollar started to strengthen in 2014. While a strong dollar brings upside to corporations on the domestic front, it impacts the volume of future exports by making goods produced in the U.S. less competitive. Recently the dollar reached a two-year high against the euro. Notwithstanding this fear, recent data compiled by T. Rowe Price confirms that manufacturing activity expanding at a faster clip in the U.S. than in any other major economy.29 Source Data: BEA Source Data: SIFMA 28 Id. 29 Id.
- 13. December 8, 2014 2015 State of the Construction Industry Page 13 of 42 K. Stock Market Because of record corporate profits and the Fed decision not to raise interest rates, the stock market surged to historic levels in the second half of 2014. The manufacturing sector remains robust due in large part to the energy boom, while a better job market and rising consumer spending is driving healthy growth in the much larger service sector.30 Moreover, the housing sector is regaining traction as homebuyers accept somewhat higher home prices and mortgage rates. Source Data: Yahoo Finance Economists are concerned that corporate profits are largely a result of the weak dollar and low- cost energy prices. Also, as of the writing of this report the stock market appears to be slightly overvalued based on historic P/E ratio levels. The average PE ratio for the S&P 500 over the past 25 years is 18.90; currently, the average P/E ratio is 20.13. While stock prices are no longer cheap, they are also not widely out of line with pricing patterns of the past several decades. [This portion of the page is left intentionally blank.] 30 http://individual.troweprice.com/public/Retail/Planning-&-Research/T.-Rowe-Price-Insights/Market- Analysis/Quarterly-Wrap-Ups
- 14. December 8, 2014 2015 State of the Construction Industry Page 14 of 42 Source Data: Multpl.com Source Data: Bespokeninvest.com III. State of the Construction Industry The construction industry is in very good shape; private sectors are booming while public sectors are staging a mild rebound after five years of steady declines. The outlook for 2015 is positive in all sectors, without exception. I anticipate that all 17 construction sectors will report growth in 2015 for the first time in over a decade. The only sub-sector that might realize flat growth or possible retraction is multifamily construction due to the over-development of apartment projects over the past several years. As the construction industry stages a bullish return, contractor margins should tick up as well. The main constraint to growth this coming year will be access to qualified construction managers and craftsmen. In addition, the increase in demand for construction will initiate increased inflation on materials and labor wages. The Fed will likely address notable inflationary pressures through rate increases.
- 15. December 8, 2014 2015 State of the Construction Industry Page 15 of 42 A. Put In Place Construction The U.S. Census Bureau recently reported that the annualized value of “Put in Place Construction” (in other words, construction revenue) for 2014 is estimated at $950 billion. While $950 billion remains significantly lower than revenue levels achieved in the mid to late 2000s, an upward trend in revenue continued in 2014 for the fourth consecutive year. For reasons set forth herein, I anticipate that the upward trend will continue in 2015 and the industry will eclipse the trillion dollar mark for the first time since 2008. Moreover, the industry is more balanced now than it was between 2004 and 2008. Source Data – U.S. Census Bureau In 2014 there was a fairly even split between private residential work, private non-residential work, and public work. Of the three, the public construction sector is slightly underweighted. Private Residential $349B 37 percent Private Non-Residential $331B 35 percent Public $271B 28 percent Overall $951B 100 percent The residential bubble displaced this balance between 2004 and 2008 when the construction industry was heavily weighted towards private residential construction. For instance, in 2006, private residential construction represented 56 percent of all work ($642 billion). Meanwhile, the marketshare of the private non-residential sector and the public sector slipped down to approximately 22 percent each ($257 billion and $244 billion, respectively). After the residential bubble burst in 2008, private residential construction settled back into a near 33 percent market share by 2011. Thereafter, however, public construction spending started to decline for a three year period. It is worth noting that the Federal Government mitigated the severity of this decline with the various stimulus programs that jumpstarted a number of large public construction
- 16. December 8, 2014 2015 State of the Construction Industry Page 16 of 42 projects. Had the Federal Government decided against this measure there would have been a massive fallout of public construction contractors throughout the U.S. Now that the decline in public construction spending has reversed, the three categories of work will be even more evenly balanced in 2015, which bodes well for the near future of the industry. Source Data: U.S. Census Bureau Data B. Construction Sector Review The U.S. Census Bureau breaks down the put-in-place revenue into 17 construction sectors. By far the largest sector is Residential. Other large sectors include Power, Highway & Street, Educational, Commercial, Manufacturing, Transportation, and Health Care. These nine sectors account for 90 percent of all construction revenue; the other eight sectors comprise the remaining 10 percent. Residential % Change Non- Residential % Change 2003 933,157$ 502,160$ 210,216$ 220,762$ 2004 1,031,623$ 11% 559,791$ 11% 229,224$ 9% 242,808$ 10% 2005 1,160,635$ 13% 648,895$ 16% 255,419$ 11% 256,321$ 6% 2006 1,177,659$ 1% 582,290$ -10% 314,484$ 23% 280,885$ 10% 2007 1,140,200$ -3% 462,007$ -21% 380,351$ 21% 297,842$ 6% 2008 1,053,717$ -8% 319,195$ -31% 417,907$ 10% 316,615$ 6% 2009 902,545$ -14% 260,448$ -18% 332,509$ -20% 309,588$ -2% 2010 787,878$ -13% 226,377$ -13% 260,490$ -22% 301,010$ -3% 2011 816,383$ 4% 241,188$ 7% 288,549$ 11% 286,646$ -5% 2012 884,980$ 8% 308,153$ 28% 306,731$ 6% 270,096$ -6% 2013 930,493$ 5% 352,605$ 14% 311,321$ 1% 266,567$ -1% 2014 970,989$ 4% 349,075$ -1% 330,957$ 6% 270,888$ 2% Public Construction Total ConstructionYear % Change % Change Private Construction
- 17. December 8, 2014 2015 State of the Construction Industry Page 17 of 42 Source Data: U.S. Census Bureau Data In 2014, many of the predominantly private sectors flourished with the exception of Residential and Health Care. The Residential sector leveled off to 2 percent growth after significant gains in 2012 (22 percent) and 2013 (18 percent). The Health Care sector pulled back as well in 2014 (-8 percent) due to diminished activity after strong growth numbers in 2013 (20 percent). Many of the primarily public sectors such as Transportation, Highway & Street, Sewage & Waste Disposal, Public Safety, and Water Supply remained mostly flat in 2014, which was fairly good news when compared to the negative growth figures from 2009 through 2013. The bright sector for public construction was Education, which reported a 4 percent increase in 2014 due to an increase in the tax base as well as bond measures.
- 18. December 8, 2014 2015 State of the Construction Industry Page 18 of 42 Source Data: U.S. Census Bureau Data As shown below, the negative sector growth figures (shown in red) since the Great Recession are starting to fade to black as the economy improves. In 2015 the construction industry is poised to fire on all cylinders (similar to the late 1990s and 2005/2006) where all sectors show improvement due to softening lending conditions, continued low interest rates, an increased tax base, increased bond measures, and for the most part healthy financials at the state level. Revenue within the public sectors will be somewhat constrained due to negligible increases in federal funding; however, an increase in state funding should nearly double 2014’s growth figure of 4 percent.
- 19. December 8, 2014 2015 State of the Construction Industry Page 19 of 42 1. Residential The Residential sector should pick up steam in 2015 after a marginal 2 percent gain in 2014. The increased growth should come on the heels of the softening credit market, which will increase demand for single-family housing. The increased demand for single-family housing, however, will likely be mitigated if/when the Fed elects to increase interest rates. Also, the millennial generation is only gradually making the shift towards homeownership, which is limiting the potential number of new homebuyers in the near term so the growth will continue in the single digits. Regardless, the softening credit conditions should outweigh these potential setbacks and growth in the Residential sector should double to 4 percent in 2015. As a result of the increase in single-family construction, apartment construction should slow accordingly (note that multi-family construction only makes up 10 percent of the Residential sector). Construction Sector Performance US Cencus Bureau [www.census.gov] 1994 1995 1996 1997 1998 1999 2000 2001 2002 2003 2004 2005 2006 2007 2008 2009 2010 2011 2012 2013 2014 1. Residential 14% -4% 14% 3% 9% 11% 7% 4% 9% 13% 14% 11% 0% -19% -28% -19% -1% -2% 22% 18% 2% 4% 2. Lodging 2% 50% 51% 18% 15% 8% 2% -8% -28% 1% 12% 1% 41% 58% 35% -46% -52% -25% 16% -1% 4% 10% 3. Office 3% 12% 14% 19% 19% 10% 18% -3% -22% -10% 6% 3% 18% 19% 16% -29% -31% -8% 9% 31% 16% 8% 4. Commercial 14% 12% 12% 8% 4% 7% 8% 1% -7% -2% 5% 8% 9% 16% -8% -38% -21% 8% 4% 6% 16% 10% 5. Health Care 4% 1% 2% 10% -1% 4% 8% 0% 14% 7% 9% 7% 12% 11% 12% -11% -10% 0% -1% 20% 9% 1% 6. Educational 6% 22% 1% 19% 5% 13% 13% 10% 12% 3% 2% 7% 7% 13% 10% -6% -15% -4% -2% -2% -8% 6% 7. Religious -1% 12% 4% 27% 14% 12% 9% 9% -5% 2% -5% -6% 0% -4% -6% -18% -16% -21% -10% -8% 4% 3% 8. Public Safety 4% 8% 12% 1% 11% 1% 3% -5% 0% -4% -6% 9% 6% 27% 25% -10% -8% -10% -13% -7% -5% 0% 9. Amusement & Recreation 12% 12% 8% 16% 5% 14% 4% 0% -1% 1% -2% -4% 25% 14% 5% -17% -4% -8% -4% -4% -1% 3% 10. Transporation -1% 3% 13% 0% 9% 2% 18% 6% 7% -2% 1% 1% 12% 16% 11% 10% -5% -7% 14% 10% 1% 5% 11. Communication 4% 9% 6% 5% 0% 47% 2% 6% -9% -31% 5% 6% 18% 22% -14% -12% -8% -2% -5% -13% -9% 0% 12. Manufacturing 23% 23% 8% -1% 8% -19% -2% -6% -45% -14% 4% -2% 18% 20% 69% -7% -35% -2% -1% -2% 22% 10% 13. Power -11% 5% -20% -2% 21% 3% 31% 8% 0% -4% -1% 11% 12% 34% 44% 6% -12% 14% 11% -21% 1% 5% 14. Highway & Street 8% 1% 5% 9% 4% 10% 8% 12% 2% 2% 4% 14% 12% 6% 9% 6% 1% -5% -4% 11% 0% 4% 15. Sewage & Waste Disposal 2% 12% 7% 6% 1% 12% 9% 9% 14% 1% 7% 12% 17% 6% 6% -2% 18% -11% -13% -3% 0% 3% 16. Water Supply 6% 9% 3% 7% 4% 7% 13% 9% 12% 0% -1% 10% 7% 4% 13% -3% 7% -8% -4% -5% -2% 5% 17. Conservation & Development 4% 8% 7% 8% 2% 10% 10% 18% -1% 2% 8% 22% 15% 2% -6% 15% 18% 0% -9% 4% 33% 5% Total 10% 4% 10% 6% 8% 9% 8% 4% 2% 5% 11% 9% 6% -3% -4% -13% -10% -2% 8% 5% 3% 6% Sector Actual 2015 Forecast
- 20. December 8, 2014 2015 State of the Construction Industry Page 20 of 42 Source Data: Freddie Mac Source Data: Joint Center for Housing Studies
- 21. December 8, 2014 2015 State of the Construction Industry Page 21 of 42 Source Data: FMI.net Source Data: Joint Center for Housing Studies 2. Power Notwithstanding the front page stories of increased oil and gas production from North Dakota’s Bakken shale and the Marcellus Shale in the northeastern region of the U.S., the Power sector remained relatively flat in 2014. The marginal performance is likely due to near static demand for electricity as evidenced by generation figures for coal, shale gas, hydro, wind, and nuclear plants.
- 22. December 8, 2014 2015 State of the Construction Industry Page 22 of 42 In addition, the demand for electricity has further slowed due to improvements in efficiencies in automobiles and appliances.31 Thus, the Power sector will likely realize a slight increase in construction spending in 2015 (~5 percent). The one bright spot for the Power sector is solar generation, which is increasing at an exponential rate as noted in the chart below. Solar power’s impact to the overall Power sector, however, is inconsequential at this point as it only make up less than one percent of total kilowatt generation in the U.S.32 If the federal government lifted the ban on U.S. crude oil exports, which is very likely in 2015, the demand for fuel would obviously go up and construction spending would follow shortly thereafter.33 According to the U.S. Government Accountability Office, allowing exports would appreciably boost the U.S. economy. Source Data: EIA.gov 31 http://www.eia.gov/forecasts/aeo/MT_electric.cfm 32 www.EIA.gov 33 http://www.gao.gov/assets/670/666274.pdf
- 23. December 8, 2014 2015 State of the Construction Industry Page 23 of 42 Source Data: EIA.gov Source Data: EIA.gov
- 24. December 8, 2014 2015 State of the Construction Industry Page 24 of 42 Source Data: EIA.gov 3. Highway & Streets / Transportation / Environmental / Military The increasing tax base and increasing bond measures for public improvement projects should result in an average sector increase of 3 to 5 percent in 2015. The Federal spending restraint will be offset by a greater financing role played by the states, involving higher user fees and the increased use of public-private partnerships. Source Data: U.S. Census Bureau
- 25. December 8, 2014 2015 State of the Construction Industry Page 25 of 42 Source Data: U.S. Census Bureau Source Data: U.S. Census Bureau
- 26. December 8, 2014 2015 State of the Construction Industry Page 26 of 42 Source Data: White House Budget Figures 4. Education / Health Care Spending in the Education sector declined from 2009 to 2013. In 2014 this trend reversed and put in place construction is up 4%. Growth should continue in 2015 as state and local governments allocate more funds towards K-12 improvements. The additional funding is made possible by improved tax revenue and increased bond measures.34 Similarly, Healthcare facilities are expected to show some improvement relative to diminished activity in 2014.35 34 http://www.aia.org/practicing/AIAB099624 35 https://www2.deloitte.com/content/dam/Deloitte/global/Documents/Life-Sciences-Health-Care/dttl-lshc-2014- global-health-care-sector-report.pdf
- 27. December 8, 2014 2015 State of the Construction Industry Page 27 of 42 Source Data: U.S. Census Bureau Source Data: U.S. Census Bureau 5. Office / Commercial The Commercial and Office sectors will likely increase at the same pace in 2015 as they did in 2014 (16 percent for commercial office and 9 percent for commercial retail). Office construction has assumed a leading role in the commercial building upturn, aided by expanding private development, as
- 28. December 8, 2014 2015 State of the Construction Industry Page 28 of 42 well as healthy construction activity related to technology and finance firms. Hotel and warehouse construction should also strengthen, although the rebound for retail outlets is more tenuous. Office construction was up 31 percent in 2013 and is up an additional 16 percent in 2014. The growth is a result of significant increases in net absorption across much of the country.36 National vacancies will likely level off in 2015. Accordingly, the Office sector will remain hot in 2015 as pent up demand is satisfied; however, the growth will fall back to the single digit level. Source Data: U.S. Department of Commerce Similar to the Office Sector, the Commercial sector is benefiting from increased absorption and falling vacancy levels. In 2015 the retail sector was up 16 percent in 2014. As shown in the next graphic, vacancy levels are expected to flatten out in 2015 for both retail and industrial space so revenue increases will not be as drastic in 2015;37 therefore, single digit growth in the Commercial sector, similar to that of the Office sector, is anticipated. 36 http://www.cbre.us/research/2014-US-Reports/Pages/Q3-2014-US-Office-MarketView.aspx 37 Id.
- 29. December 8, 2014 2015 State of the Construction Industry Page 29 of 42 Source Data: U.S. Department of Commerce Source Data: U.S. Department of Commerce 6. Manufacturing The Purchasing Manager’s Index, which is reported on a monthly basis by The Institute for Supply Management (“ISM”), reflects the health of the U.S. manufacturing industry. The index weighs five differing fields, namely: production level, new orders from customers, speed of supplier deliveries, inventories and employment level. In November of 2014 ISM reported expansion in the manufacturing sector for the 18th consecutive month.38 Seventeen of the eighteen industries profiled reported growth and this positive trend looks to continue into 2015, albeit at a more moderate level. The 22 percent gain in construction spending in 2014 will likely throttle back to 10 percent in 2015, as such a pace is not 38 http://www.ism.ws/ismreport/mfgrob.cfm
- 30. December 8, 2014 2015 State of the Construction Industry Page 30 of 42 sustainable in such a mature sector. In addition, the strengthening dollar will likely reverse the upward trend of exports in the near future, which will constrain the need for capital improvements. Source Data: ISM Source Data: U.S. Department of Commerce 7. Lodging The Lodging sector staged a formidable comeback over the past three years after compressing by 46 percent in 2009, 52 percent in 2010, and 25 percent in 2011. Construction spending was up 4 percent in 2014 and 10 percent growth is expected in 2015, based on increasing occupancy rates. As
- 31. December 8, 2014 2015 State of the Construction Industry Page 31 of 42 noted below, 2014 occupancy (63.8 percent) is the highest level it has been in the past fifteen years and it is expected to increase to 62.4 percent in 2015. The Lodging sector will likely cool off in 2016. Source Data: American Hotel & Lodging Association B. Construction Employment The labor pool for construction is tightening. The number of employed construction workers surpassed the 6 million mark in 2014 for the first time in four years. While the construction workforce remains approximately 20 percent below the 2006 level (over 7.7 million), the labor force has been steadily climbing since 2011, and it will continue to climb through 2015 due to increased demand. Source Data: U.S. Census Bureau Based on the addition of approximately 600k workers over the past four years, unemployment has been cut in half. Construction unemployment typically trends double that of the overall US unemployment rate, mainly due to the seasonal nature of construction in cold weather climates—note
- 32. December 8, 2014 2015 State of the Construction Industry Page 32 of 42 the peaks in the chart below take place during the winter months. That said, construction unemployment has trended from an average rate of 20.6 percent in 2010 down to an average rate of approximately 9 percent in 2014. This downward trend will continue in 2015 so long as there is not a quick spike in inflation. Source Data: U.S. Census Bureau D. Labor Escalation Regardless of economic conditions, labor costs almost never de-escalate. In fact, labor costs increased through the Great Recession at a higher rate than over the past three years, which is somewhat inexplicable. That said, labor costs have escalated within a percentage point of the CPI since 2011. As noted in the RSMeans chart below, labor tends to escalate at nearly the same pace regardless of whether the rates are based on union, open shop, or residential construction. Wage escalation will likely increase at a higher percentage in 2015 due to the anticipated rebound of public sector work and the continued demand for private sector construction. E. Material Escalation After significant material de-escalation in 2009 (-5.6 percent), material pricing reversed course and notable escalation resulted in 2010 (4.2 percent) and 2011 (4.8 percent) as economic conditions improved. Over the past three years, material escalation has increased to near CPI levels and it is RSMean Labor Wage Escalation Year Union % Change Open Shop % Change Residential % Change CPI % Change 2014 47.30$ 2.4% 36.30$ 2.4% 32.45$ 2.5% 237.4 2.3% 2013 46.20$ 1.8% 35.45$ 1.7% 31.65$ 1.6% 232 0.9% 2012 45.40$ 2.3% 34.85$ 2.3% 31.15$ 2.3% 230 2.2% 2011 44.40$ 4.2% 34.05$ 4.1% 30.45$ 4.1% 225 3.2% 2010 42.60$ 4.3% 32.70$ 4.3% 29.25$ 4.3% 218 1.6% 2009 40.85$ 3.7% 31.35$ 3.6% 28.05$ 3.9% 214.5 -0.4% 2008 39.40$ 3.7% 30.25$ 3.6% 27.00$ 3.4% 215.3 3.9% 2007 38.00$ 29.20$ 26.10$ 207.3
- 33. December 8, 2014 2015 State of the Construction Industry Page 33 of 42 estimated at 3.6 percent in 2014. The reason for the notable escalation in 2014 is due in large part to lumber (8.8 percent) and cement (4.7 percent) prices. Material prices will continue to escalate in 2015 as the demand for all sectors of construction improves. F. Number of Construction Establishments Over the past decade the number of construction establishments grew to a peak of 896,200 in the third quarter of 2007 and then steadily declined for the next five years down to a low of 738,056 in the first quarter of 2013; this represents a reduction of 158,144 firms. In the latter part of 2013 this downward trend reversed and the number of establishments has slowly increased to 748,023 as of the first quarter in 2014. While it will take some time to surpass the near 900,000 level set in 2007, I anticipate that the number of establishments will steadily increase over the next several years. ENR Material Price Index Year Index No. % Change CPI % Change 2014 3073 3.6% 237.4 2.3% 2013 2969 2.8% 232 0.9% 2012 2889 0.9% 230 2.2% 2011 2863 4.8% 225 3.2% 2010 2731 4.2% 218 1.6% 2009 2620 -5.6% 214.5 -0.4% 2008 2775 7.7% 215.3 3.9% 2007 2577 -0.7% 207.3 2.8% 2006 2596 0.8% 201.6 3.2% 2005 2575 6.4% 195.3 3.4% 2004 2420 20.3% 188.9 2.7% 2003 2011 1.0% 184 2.3% 2002 1992 -3.1% 179.9 1.6% 2001 2056 -3.3% 177.1 2.8% 2000 2127 -3.0% 172.2 3.4% 1999 2192 166.6 ENR Material Indices Year Index Value % Change Cement ($/ton) 116.16 4.7% Steel (CWT) 50.46 1.5% Lumber (MBF) 471.44 8.8%
- 34. December 8, 2014 2015 State of the Construction Industry Page 34 of 42 G. Contractor Profitability 1. Yahoo Finance Data Yahoo Finance reports that profit margins for public General Contractors improved to 4.5 percent in 2014. Meanwhile, profit margins for public Heavy Contractors remained at the paltry 2 percent level for the fourth consecutive year. Similarly, public Engineering Companies reported profit margins in the 2 percent range, which is actually an increase from the two prior years. Residential Contractors realized the largest swing of fortune in 2014, with profit margins increasing to 7.6 percent; the largest margin for the industries reviewed. Margins for Heavy Contractors and Engineering Companies should trend upwards in 2015 as the public sectors rebound. 2. BizMiner Data – Non-Residential Building Contractors BizMiner profiled over 34,000 Non-Residential Building Contractors in 2013.39 As noted in the next graphic, the Building Contractors reported slight increases in EBITDA due in part to lower wages. 39 BizMiner will not have 2014 data available until mid-2015.
- 35. December 8, 2014 2015 State of the Construction Industry Page 35 of 42 The 2013 figures demonstrate an improved financial condition on the combined profit and loss statement. The combined balance sheet for the Non-Residential Building Contractors reflects a somewhat deteriorating condition in 2013. While cash reserves increased, accounts payables and other liabilities increased as well and the net effect was an overall drop in net worth. I anticipate that an increase in revenue in 2014 and 2015 will certainly improve this financial picture.
- 36. December 8, 2014 2015 State of the Construction Industry Page 36 of 42 3. BizMiner Data – Multi-Family Contractors BizMiner profiled over 569 Multifamily Contractors in 2013. As shown below, these contractors reported flat profit figures in 2013. Based on the increased revenue figures in 2014, I anticipate that EBITDA figures for Multifamily Contractors will trend upwards in 2014.
- 37. December 8, 2014 2015 State of the Construction Industry Page 37 of 42 The combined balance sheet for Multifamily Contractors mirrors that of Non-Residential Building Contractors as an increase in cash is coupled with a decrease in receivables as well as an increase in liabilities. The net result is a slight decrease in net worth. The financial condition of Multifamily Building Contractors will likely improve in 2014 and 2015 due to increases in revenue. [This portion of the page is left intentionally blank.] 4. BizMiner Data – Heavy Contractors BizMiner profiled over 34,000 Heavy Contractors in 2013. The combined profit and loss statement notes a decrease in revenue in 2013 as the public sectors compressed. In addition, Heavy Contractors reported an increase in officer compensation as well as an increase in overall wages; this caused a notable reduction in EBIDTA and Net Profit.
- 38. December 8, 2014 2015 State of the Construction Industry Page 38 of 42 Unlike the Building Contractors, the Heavy Contractors noted a reduction in cash. The reduction in cash was coupled with an increase in liabilities, which in turn led to a drop in net worth. Balance sheets of Heavy Contractors should improve as the public sectors rally in 2014 and 2015.
- 39. December 8, 2014 2015 State of the Construction Industry Page 39 of 42 a5. BizMiner Data – Specialty Contractors BizMiner profiled over 260,000 Specialty Contractors in 2013. The combined profit and loss statement demonstrate very little improvement from 2012. In fact, higher salaries and higher rent caused slight profit margin erosion. As noted in the Yahoo Finance numbers listed above, this figure should improve 2014 and 2015.
- 40. December 8, 2014 2015 State of the Construction Industry Page 40 of 42 Specialty Contractors also noted a slight decrease in cash and a minor increase in receivables (likely because the General Contractors reported an increase in accounts payable). Also, similar to the other contractors, the combined balance sheet reflects an increase of liabilities and a reduction in net worth; this trend should reverse itself 2015 and beyond.
- 41. December 8, 2014 2015 State of the Construction Industry Page 41 of 42 H. Trends in the Construction Industry 1. Qualified Workforce Shortage Many contractors now worry that there is an insufficient number of skilled craftsman to address the rising demand for construction. According to a recent survey conducted by The Associated General Contractors of America (“AGC”), “[m]ost construction firms report they are having trouble finding qualified craft workers to fill key spots as the industry recovers from its years-long downturn.”40 Per Ken Simonson, AGC’s chief economist, “[c]onsidering how much the nation’s educational focus has moved away from teaching students career and technical skills during the past few decades, it is easy to understand why the construction industry is facing such severe labor shortages.”41 The Associated Builders and Contractors, Inc. (“ABC”) conducted a similar survey and 75 percent of the respondents noted that their respective construction company is experiencing a shortage of willing and qualified craft professionals.42 Per ABC, “[t]hese results support the findings of the Construction Labor Market Analyzers’ 20/20 Foresight Report, which shows there will be a nationwide shortage of nearly 2 million skilled craft workers by 2017.”43 ABC opines that the worker shortage is a result of “the nearly 30 percent of the construction workforce lost at the peak of the recession combined with an aging workforce, an insufficient pipeline of new workers and lost workers that moved on to other industries.”44 2. Continued Thin Margins as the Construction Industry Rebounds A recent article in Engineering News Record noted that, “[w]hile the recession may be over, construction's legacy of tight margins remains. While some contractors have seen a healthy uptick in activity in recent years, margins have not kept pace.”45 As a consequence, contractors are adopting lean construction techniques in order to compete in today’s marketplace, such as prefabrication and modular systems.46 3. Reduction in Apartment Construction Due to the anticipated softening of the lending market for single family houses, coupled with the surge of apartment construction over the past five years, the growth of multi-family apartment towers will likely wane in 2015 and beyond. According to the Wall Street Journal, “[t]he share of new homes being built as rental apartments is at the highest level in at least four decades, as an improving 40 http://news.agc.org/2014/10/22/eighty-three-percent-of-construction-firms-report-having-trouble-finding- qualified-workers-to-meet-growing-demand-for-construction-services/ 41 Id. 42 http://www.abc.org/NewsMedia/Newsline/tabid/143/entryid/1601/abc-members-experience-skilled-worker- shortage.aspx 43 Id. 44 Id. 45 http://enr.construction.com/bonus_regions/midatlantic/2014/0217-five-trends-to-watch-in-2014.asp 46 Id.
- 42. December 8, 2014 2015 State of the Construction Industry Page 42 of 42 jobs picture spurs younger Americans to form their own households but tighter lending standards make it more difficult to buy.”47 IV. Conclusions 2014 brought rapid expansion to many non-residential private sectors, reduced growth in the residential private sector, and a much awaited recovery (albeit modest) of many public sectors. Overall, it was a very good year in the construction industry and this is evidenced by the improvements in employment and inflationary pressures. Lending institutions, the Federal Government, and State/Local governments are taking measures to position 2015 as a banner year for construction. Growth in the second half of 2015 might be constrained by the drag caused by an interest rate hike. Due to the heated market conditions, the financial condition of constructors should improve as well in 2015. The new constraint to growth for many contractors will be access to qualified resources. 47 http://www.wsj.com/articles/SB10001424052702304020104579429280698777544