
Recomendados
Mais conteúdo relacionado
Mais procurados
Mais procurados (20)
Semelhante a BREAK-EVEN ANALYSIS AND BUDGETING CALCULATIONS
Semelhante a BREAK-EVEN ANALYSIS AND BUDGETING CALCULATIONS (20)
Mais de UCFPMBA
Último
Último (20)
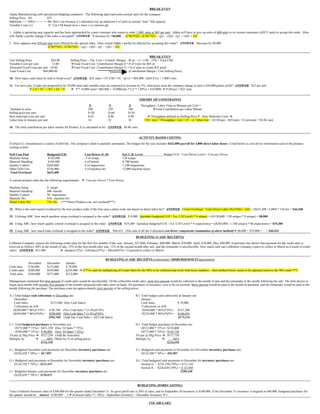
BREAK-EVEN ANALYSIS AND BUDGETING CALCULATIONS
- 1. BREAK-EVEN Alpha Manufacturing sells specialized shipping containers. The following data represents normal sales for the company: Selling Price (P) $75 Full Cost (TC) 50 Don’t use because it’s allocated over an unknown # of units at current “near” full capacity Variable Costs (v) 35 Use CM based on p-v since v is a known qty 1. Alpha is operating near capacity and has been approached by a new customer who wants to order 1,000 units at $65 per unit. Alpha will have to give up sales of 600 units to its current customers (@$75 /unit) to accept this order. How will Alpha’s profits change if the order is accepted? ANSWER: N Increase by +$6,000 (CM2*Q2) - (CM1*Q1) = (p2 – v)Q2 - (p1 – v)Q1 = ΔN 2. Now suppose only $50 per unit were offered for the special order. How would Alpha’s profits be affected by accepting this order? ANSWER: Decrease by $9,000 (CM3*Q3) - (CM1*Q1) = (p2 – v)Q2 - (p1 – v)Q1 = ΔN BREAK-EVEN Unit Selling Price $24.00 Selling Price – Var. Cost = Contrib. Margin (p – v) = CM (*Q = Total CM) Variable Costs per unit 12.00 Total Fixed Cost / Contribution Margin $ = # of Units for B/E pt Allocated Fixed Costs per unit 10.00 Total Fixed Cost / Contribution Margin % = $ of sales to create B/E point Total Fixed Cost $84,000.00 (Contribution Margin / Unit Selling Price) 10. How many units must be sold to break-even? ANSWER: B/E units = FC/CM = FC / (p-v) = $84,000 / ($24-$12) = 7,000 Units 11. For next year, if sales are projected to be 10,000 units and variable costs are expected to increase by 5%, what price must the company charge to earn a $10,000 pretax profit? ANSWER: $22 per unit P x Q = FC + (VC x Q) + N P * 10,000 units= $84,000 + 10,000units * (12 * 1.05%) + $10,000) P (Price) = $22 /unit THEORY OF CONSTRAINTS X Y Z Throughput / Labor Time in Minutes per Unit = Demand in units 160 150 140 Total Contribution per Labor Minute Selling price per unit $130 $160 $150 Raw materials costs per unit $ 65 $ 80 $ 90 Throughput defined as (Selling Price P - Raw Materials Cost) Labor time in minutes per unit 16 23 10 CM / min = Throughput / min = (P – v) / labor min = ($130/unit - $65/unit) / 16 min/unit = $4.06 /unit 16. The total contribution per labor minute for Product X is calculated to be: ANSWER: $4.06 /unit ACTIVITY-BASED COSTING Everlast Co. manufactures a variety of drill bits. The company's plant is partially automated. The budget for the year includes $432,000 payroll for 4,800 direct labor-hours. Listed below is cost driver information used in the product- costing system: O.H Cost Pool Budgeted O.H. Cost Driver (C.D) Est. C.D. Level Budget O.H. / Cost Driver Level = Cost per Driver Machine Setup $120,000 # of setups 120 setups Material Handling $104,400 # of barrels 8,700 barrels Quality Control $264,000 # of inspections 1,100 inspections Other O/H Cost $144,000 # of machine hrs 12,000 machine hours Total Overhead $632,400 A current product order has the following requirements: Cost per Driver * Cost Driver Machine Setup 8 setups Material Handling 606 barrels Quality Control 80 inspections Machine Hrs 830 machine hrs Direct Labor Hrs 336 hrs - (***Direct Product cost, not overhead***) 22. What is the total manuf overhead for the new product order if the firm uses a plant-wide rate based on direct labor-hrs? ANSWER: (Total Overhead / Total Direct Labor Hrs)*(Hrs / Job) = ($632,400 / 4,800) * 336 hrs = $44,268 23. Utilizing ABC, how much machine setup overhead is assigned to the order? ANSWER: $ 8,000 ((product budgeted O.H. / Est. C/D Level) * # setups) = (($120,000 / 120 setups) * 8 setups) = $8,000 24. Using ABC, how much quality control overhead is assigned to the order: ANSWER: $19,200 ((product budgeted O.H. / Est. C/D Level) * # inspections) = (($264,000 / 1,100 setups) * 80 inspections) = $19,200 25. Using ABC, how much total overhead is assigned to the order? ANSWER: $44,432 (The sum of all the 4 allocated cost driver components (summation of above method) $8,000 + $19,000 +… = $44,432 BUDGETING (CASH RECEIPTS) LeMinton Company expects the following credit sales for the first five months of the year: January, $25,000; February, $40,000; March, $30,000; April, $36,000, May $40,000. Experience has shown that payment for the credit sales is received as follows: 60% in the month of sale, 25% in the first month after sale, 12% in the second month after sale, and the remainder is uncollectible. How much cash can LeMinton Company expect to collect in March as a result of credit sales? ANSWER: $31,000 January(12%) + February(25%) + March(65%) = Expected to collect in March BUDGETING (CASH RECEIPTS (collections) / DISBURSEMNETS (payments)) November December January Cash sales $ 96,000 $125,000 $ 78,000 Credit sales $288,000 $450,000 $234,000 (***or start by multiplying all Credit Sales by the 96% to be collected and work with those numbers – then method below needs to be adjusted (remove the 96% mult.***) Total sales $384,000 $575,000 $312,000 Management estimated that four percent of credit sales would be uncollectible. Of the collectible credit sales, sixty-five percent would be collected in the month of sale and the remainder in the month following the sale. The firm desires to begin each month with seventy-five percent of the month's projected total sales units on hand. All purchases of inventory were to be on account; thirty percent would be paid in the month of purchase, and the remainder would be paid in the month following the purchase. The purchase costs are approximately sixty percent of the selling prices. A.) Total budget cash collections in December are: B.) Total budget cash collections in January are: December: January: Cash Sales $125,000 (Dec Cash Sales) Cash Sales $ 78,000 Collections on A/R Collections on A/R ($288,000 * 96%)*35%= $ 96,768 (Nov Crdt Sales * (1-4%))*35% ($450,000 * 96%)*35%= $151,200 ($450,000 * 96%)*65%= $280,800 (Dec Crdt Sales * (1-4%))*65% ($234,000 * 96%)*65%= $146,016 $502,568 (Add Dec Cash Sales + All Crdt Sales) $375,216 C.) Total budgeted purchases in November are: D.) Total budget purchases in December are: ($575,000 * 75%)= $431,250 (Dec Ttl Sales * 75%) ($312,000 * 75%)= $234,000 ($384,000 * 25%)= $ 96,000 (Nov Ttl Sales * 25%) ($575,000 * 25%)= $143,750 Ttl pur @ Sllg Price $527,250 (Add the Amounts) Ttl pur @ Sllg Price $377,750 Mulitply by 60% (Multi by % of selling price) Mulitply by 60% $316,350 $226,650 E.) Budgeted December cash payments for December inventory purchases are: F.) Budgeted cash payments in November for November inventory purchases are: ($226,650 * 30%) = $67,995 ($316,500 * 30%) = $94,905 G.) Budgeted cash payments in December for November inventory purchases are: H.) Total budgeted cash payments in December for inventory purchases are: ($316,350 * 70%) = $221,445 Section G - $316,350 (70%) = $221,445 Section E - $226,650 (30%) = $ 67,995 I.) Budgeted January cash payments for December inventory purchases are: $289,440 ($226,650 * 70%) = $158,655 BUDGETING (FORECASTING) Tony's Fashions forecasts sales of $300,000 for the quarter ended December 31. Its gross profit rate is 20% of sales, and its September 30 inventory is $100,000. If the December 31 inventory is targeted at $40,000, budgeted purchases for the quarter should be: Answer: $180,000 ( (Forecast Sales *1- 20%) - September Inventory + December Inventory ) VOCABULARY
- 2. Activity: a specific task or action of work done. High value (design, processing, delivering) and low value (set up, moving, reworking) activities. Activity-Based Budgeting ABB: is a budgeting process based on activities and associated activity costs to support production and sales operations. Activity Based Costing: a costing approach that assigns resource costs to cost objects based on activities performed for the cost objects.(Steps in developing an ABC system: identify resource costs and activities; assign resource costs o activities; assign activity costs to cost objects. Used to improve accuracy of cost by tracing costs to products or customers.) – ABC is expensive and time-consuming. Activity Based Management: uses activity analysis and activity-based costing to help managers improve value of products and services. Balanced Scorecard (BSC): an accounting system that includes the firm’s critical success factors in four areas: financial performance, customer satisfaction, internal processes, and learning & growth. (Balanced Scorecard measures - financial performance, customer satisfaction, internal processes, learning and growth) – a strategy-based performance measurement system, more comprehensive than traditional financial systems. Batch-Level Activity: an activity performed for each batch of products or services. Ex. Machine setups, purchase orders, scheduling production, batch inspections, etc… Break-Even Point: the point at which revenues equal total costs and profit is zero. Budget: is a detailed plan for the acquisition and use of financial and other resources over a specified period of time. Budgetary Slack: is the “cushion” managers intentionally build into budgets to help ensure success in meeting the budget - padding the budget. Budgeting Process: budget committee formation; selection of budget period (fixed or rolling); budget guidelines (zero base or revision of prior budget-not preferred); preparation of initial proposal; negotiation of final budget; review and approve; revision after implementation; evaluation Cost Allocation: the assignment of indirect cost to cost pools and cost objects – a form of cost assignment in which direct tracing is not economically feasible. Cost Driver: any factor that causes a change in the cost of an activity. Cost Life Cycle: the sequence of activities within the firm that begins with research and development, followed by design, manufacturing, marketing/distribution, and customer service. Cost Management Information: used to implement an org’s strategy. Consists of financial cost and revenue measures, as well as non-financial key success factors (i.e. cust retention, productivity, quality). Cost Pools: the meaningful groups into which costs are often collected (ex’s. claims processing, financial services, design, purchasing, dept,…) Cost-Volume Profit Analysis: a method for analyzing how various operating decisions and marketing decisions will affect profit. (a method for analyzing how various operating decisions and marketing decisions will affect net income.) Contribution Margin: (unit – the difference between unit sales price and unit variable cost. (p – v)) (total – the unit contribution margin multiplied by the number of units sold. = ((p –v)xQ)) – need +CM to earn a profit Contribution Margin Ratio: the ratio of the unit contribution margin to unit sales price – (selling price-variable cost)/ selling price = ((p – v)/p). CPA / CMA: Certified Public Accountant / Certified Management Accountant (by the AICPA = American Institute of Certified Public Accountants, IMA = Institute of Management Accountants). Decision Making Process: 5 steps: 1 = Determine strategic issues; 2 = Identify alternatives; 3 = Obtain info and conduct analyses; 4 = select and implement solution; 5 = continuous evaluation. Direct Cost: a cost conveniently and economically traced directly to a cost pool or a cost object (i.e. product or activity). Direct Labor Cost: the labor used to manufacture the product or to provide the service. Direct Material Cost: includes the cost of the materials in the product and a reasonable allowance for scrap and defective units Enterprise Sustainability: balancing a company’s short and long-term goals in three dimensions (social, environmental and financial) Facility-Level Activity: an activity performed to support operations of products and the facility/factoryin general. Ex. Plant security, maintenance, plant management, property taxes, accounting, etc… Factory Overhead Applied: the amount of overhead assigned to a job using a predetermined factory overhead rate. Fixed Cost: the portion of the total cost that does not change with a change in the quantity of the cost driver, within relevant range and given time period. Opposite of variable cost. Flexible Budget: a budget that adjusts revenues and costs to the actual output level achieved. High-Volume-Added Activity: increases the value of the product or service to the customer. Indirect Cost: a cost that is not conveniently or economically traceable to a specific cost pool or cost objective. Indirect Labor Cost: supervision, quality control, inspection, purchasing and receiving, and other labor-related manufacturing support costs. Indirect Material Cost: refers to the cost of materials used in manufacturing that are not physically part of the finished product. Life-Cycle Costing: a method to identify and monitor the costs of a product throughout its life cycle. (Consists of all steps from production design and purchase of raw materials to delivery and service of the finished product. Monitors cost of product through its life cycle.) Low-Value-Added Activity: consumes time, resources, or space, but adds little to satisfying customers’ needs. Master Budget: an organization’s operating and financing pal for the upcoming period; it translates short-term objectives into action steps. Marin of Safety: the amount of sales above the breakeven point. Mixed Cost: contains both fixed and variable costs. Operating Leverage: the ratio of the C.M. to profit = CM/N Overapplied Overhead: the amount of factory overhead applied that exceeds actual factory overhead cost. (Applied overhead might exceed incurred overhead if the amount incurred is less than estimated.) Performance-Level Activity: Support production of a specific product line or service. Ex. Design, purchasing, ECNs. Period Cost: all non-product expenditures for managing the firm and selling the product. Opposite of product cost, not traceable to a product. Product Cost: the cost necessary to complete the product (direct materials, direct labor, and factory overhead, ex. Dental, radiaology) = cost of goods sold. Opposite of period cost. Vary w/ Qty of product produced. Product-Level Activity: an activity performed to support the production of a specific product or service. Resource Cost: cost category used in BSC to group resource costs (ex. Data processing, supplies, postage, etc…) Sales Budget: shows expected sales in units at their expected selling prices – has three components: forecasted sales volume, forecasted sales mix, and budgeted selling prices Sales Life Cycle: the sequence of phases in a product’s or service’s life in the market – from the introduction of the product, to the growth in sales, and finally maturity, decline, and withdrawal from the market. Sensitivity Analysis: methods that examine how an amount changes if factors involved in predicting that amount change. Strategy: a plan for using resources to achieve sustainable goals (2 main strategies: Cost Leadership & Product Differentiation) Strategy Map: cause-and-effect diagram of the relationships among the 4 BSC perspectives. Mangers use it to show how the achievement of goals in each perspective affect the achievement of goals in other perspectives, and finally the overall success of the firm. Sunk Cost: costs that has been incurred in the past or are committed for the future and are therefore irrelevant to decision making. SWOT Analysis: systematic procedure for identifying a firm’s 4 critical success factors: its internal strengths and weaknesses and its external opportunities and threats.
- 3. Target Costing: determines the desired cost for a product no the basis of a given competitive price, such that the product will earn a desired profit. Theory of Constraints (TOC): helps firms effectively improve the rate at which raw materials are converted to finished products. (Improve important critical success factors: cycle time, rate at which raw materials are converted to finished products. The TOC helps identify and eliminate bottlenecks.) Throughput Margin: a TOC measure of product profitability; It equals the price less the material cost, including all purchased components and materials handling costs. Underapplied Overhead: the amount by which actual factory overhead exceeds factory overhead applied. (Applied overhead will be less than the incurred amount of overhead.) Unit Cost: average cost – total manuf. Cost (materials, labor and overhead) divided by # of unit output. Unit-Level Activity: an activity performed for each unit of the cost object (each actual product or service). Ex. Direct labor or material costs. Value Activities: activities a firm must perform in designing and producing/providing a product or service. Value-Chain Analysis: a strategic analysis used to better understand the firm’s competitive advantage, identify where value to customers can be increased or cost reduced, and better understand the firm’s linkages with suppliers, customers, and other firms in the industry. (Value-Chain identifies specific steps required to provide a product/service to the customer. Three phase: upstream steps (ex. design), operations activities (perform R&D), and downstream outputs (completed design).) Value Engineering: used in target costing to reduce product cost by analyzing tradeoffs between different types of product functionality and total product cost (ex. tools = Functional Analysis, Design Analysis, QFD, Concurrent Eng). Value Stream: a group of related products - consists of all the activities required to create customer value for a family of products or services – identify value added activities and areas of improvement. What-If Analysis: the calculation of an amount given different levels for a factor that influences that amount. Zero-Based Budgeting ZBB: is a budgeting process that requires managers to prepare budgets from a zero base – a fresh start. Target Costing: Value Chain Life Cycle Phase Cost overtime: highest at introduction, lowest at maturity (Design Stage) Introduction Grow Mature Decline Set-Up (UP) High Medium Low Low -- Upstream: Design and Planning <1 Reduce Cost; >1.25 Enhance Value; >1 and <1.25 Acceptable Outcome Production (MAN) High High Medium Medium -- Manufacturing: Gain Traction and Speed Customer Service (DOWN) Low Medium High Medium -- Downstream: Support • What should be our focus: Long-Term – all cost must be considered (all stages in life cycle) Short-Term – just those costs under our control (current phase in life cycle) Cost Life Cycle: R&D Design Manufacturing Marketing & Distribution Customer Service (Upstream Activities/Costs) (Downstream Activities/Costs) Life-Cycle Costing Design Stage: Reduces time to Market, expected service costs and eases manufactured critical success Sales Life Cycle: Growth Maturity Sales Intro Decline Time CVP Basic Training (Theory of Constraints) 1. (Price – Cost) = Profit Breakeven 2. Cost = (Variable Cost + Fixed Cost) Units = Fixed Costs/Contribution Margin 3. Contribution Margin = (Price – Variable Cost) Sales Dollars = Fixed Costs/Contribution Margin Ratio • What is controllable at one level may not be at another level; i.e., equip purchases • Attributes = accurate and timely Chapter 2 Firm Strategy – Cost Effective (tradeoff between cost of error and cost of investigation) • Decision Perspective – Price Leadership - Wal-Mart – Relevant Costs ***important for decision making*** – Product Differentiation - Target • Differ among alternatives – Opportunity Costs – Combination - High Tech Products (Cell Phone, MP3’s Computers, etc.) • Alternatives not selected SWOT Analysis = (Strengths, Weaknesses, Opportunities, Threats) – Sunk Costs Value Chain • Past expenditures that are no longer relevant – Components • Description (More in Chapter 9) – Upstream (Design) – Variable (Changes with increase in activities) – Operations (Production) – Fixed (Does not change with increases in activities) – Downstream (Customers) – Mixed (Combination) – Determine Critical Success Factor (p. 36) • Relationship to Strategy – Critical – Structural – (Long Term, how do we capitalize on our strengths to add value) • Reduce Cost or Add Additional Value • Scale • Construct Balanced Scorecard to Track Progress • Experience – Not Critical - Outsource • Technology Balanced Scorecard BSC (Performance Beyond Net Income) • Complexity – Financial Perspective – Executional (Short Term, how can we reduce costs) – Customer Perspective • Workforce Involvement – Internal Processes Perspective • Design of the Production Process – Learning and Growth Perspective • Supplier Relationships For Public Corporations, Shareholder Wealth (Financial Perspective is Most Important) • ACCOUNTING PERSPECTIVE For Private Companies, Owners Set the Top Priority and May Chooses More than Four • Classification (all costs are considered, not just controllable) Sustainability Perspective – Product (Can be traced to a product or service) – Emerging Importance • Direct (Materials and Labor, traceable) – Considers Environmental and Social Performance – Maybe engineered or discretionary Strategy Map • Indirect (Overhead, allocated) – Links four perspectives of the Balanced Scorecard – Distinction is subject of Chapter 5 – Key is to have activities feed into another perspective – Period Costs (Costs related to the organization and not traceable to a product) • Dead ends do not add value • Marketing & nonproduction administrative/general costs • Sort by level – Resource Cost Chapter 3 – Cost Pool Basic Cost Concepts – Cost Object • MANAGERIAL PERSPECTIVE • (All linked by cost drivers) • Controllable vs. Noncontrollable • Sort by object classification – Only performance relative to controllable costs is evaluated – Product Costs • Contrast with Financial Accounting • Ending Inventory or Cost of Goods Sold
- 4. – Period Costs – Selling prices will likely change too • Costs for running the business (not tied directly to a product) • How do we reach target cost? CHAPTER 5 – Upstream (Direction) ABC & CUSTOMER COSTS • Design & Planning • Cost vs. Expense • Value Engineering (Quality Function Deployment) • Expenses are accurate – financial accounting concept 1. Determine Cost Components • Costs are estimates approaching accuracy – management accounting concept 2. Determine Relative Customer Values – descriptive of past (accounting) 3. Assign Costs across Values • creating data points 4. Calculate Importance Index (Step 3/Step1) – predictive of future (management) – <1, Reduce Cost – maintaining or moving data points – >1.25, Enhance Value • DETERMING COST – >1 and <1.25, Acceptable Outcome (COST OBJECT AUTOPSY) • Interaction must be considered • Direct + Indirect = Total 1. Too little upstream planning may result in • Traceable + Allocated = Total additional downstream costs • What has happened over time 2. Too much upstream planning may not result in – Shift from Primarily Direct to Primarily Indirect downstream savings – Manufacturing (Traction & Speed) – Shift from Primarily Traceable to Primarily Allocated –Focus has shifted to emphasis on how indirect costs are allocated • Continuous Improvement/Kaizen - Japanese cost reduction method • Efficient Processes • COST ALLOCATION METHODS 1. Adequate Capacity • VOLUME BASED - Single product, low indirect costs, all costs treated equally. 2. Reduced Cycle Time (Takt Time Concept) 3. Efficient workflow (Drum, Buffer, Rope) – Downstream (Support) • ACTIVITY BASED – Unique products, high indirect costs, assigned based on activity usage • Plan according to life cycle • COST OF INAPPROPRIATE VOLUME COSTING– Some Products overcosted (high • • Theory of Constraints What to do when there is not enough capacity (short run problem) volume), some undercosted (low volume) • Theory of Constraints Concept • VOLUME COSTING CALCULATION – Identify the constraint and affected products; i.e., too little labor to work on all • Total indirect costs/Total # of units (output or input (hours)) = Cost assigned to each unit products • Example: Restaurant food & beverage bill plus tax and tip. – Food & beverage are direct costs – Calculate Throughput Margins – Tax and tip are indirect costs (Selling Price – Direct Materials)/Units of Constrained Resource • Volume costing solution to tax and tip allocation is to divide by the • Theory of Constraints, Example number of diners; i.e., everyone pays the same amount A company finds there is not enough labor for (fill in the blank of your choice) to produce both A and B. • ABC COST CALCULATION • Theory of Constraints, Example • More complex process • Solution • Step 1: IDENTIFY RESOURCE COSTS AND ACTIVITIES – – Short Term: Produce A, then B Long Term: Add Capacity or change the process – Costs come from accounting records; in our example the total bill • In the textbook, you find the problem – Activities are how those costs are “used” • In the workplace, the problem finds you! • Unit Level • Cost Volume Profit (CVP) • Batch Level • Two alternatives for profit planning • Product Level – Replicate the entire income statement and compare results – time consuming and • Facility Level confusing because of “volume” • Step 2: ASSIGN RESOURCE COSTS TO ACTIVITIES BY GROUP (COST POOLS) – Use CVP analysis • Focus is on cost behavior vs. cost description • Unit Level - Direct Labor & Materials; in our example, food & • Uses aggregate vs. “line item” data beverage per diner • Easier to apply and interpret • Batch Level - Setup & inspection • Cost Volume Profit (CVP) • Product Level - Design, Administration of parts/products, • CVP Basic Training Marketing – (Price – Cost) = Profit • Facility Level - Maintenance, Insurance, Taxes; in our example taxes and tip • Can be per unit or weighted average if the product mix remains constant • Step 3: ASSIGN ACTIVITY COSTS TO COST OBJECTS (based on cost drivers; i.e., how – Total Cost = (Variable Cost + Fixed Cost) the objects “use” the cost) – Contribution Margin = (Price – Variable Cost) – In our example, each diner would be assigned the food and beverages they • (Contribution Margin/Time) = Contribution Margin per Time Unit ordered plus the applicable tax and tip related to the cost of that order. Contrast with volume based total/# – Price x Quantity = Fixed Cost + (Variable Cost x Quantity) + Profit – Allocate by either • P x Q = FC + (VC x Q) + N • • Resources used per cost object – allocates all costs Resources available – allocates only those costs used and identifies – Total Profit = Operating Profit – FC N = CM * Q - FC – N used as pretax profit from practice exam excess/wasted capacity – see Bellhaven Homes p.136 • CVP Applications – insignificant or nontraceable are volume allocated – Breakeven Analysis • ACTIVITY BASED MANAGEMENT - ABM (Focus on Activities vs. Costs) – Profit Planning – Cost Volume Profit (CVP) • Hi-Value Activities – Contributes to customer satisfaction/value or organizational needs • Examples: (product design, manufacture, & delivery) – Breakeven Formula – Find ways to enhance • Units = Fixed Costs/Contribution Margin • Low-Value Activities – (set up, moving parts, inspection, repair, etc.) • Assume Fixed Costs = $10,000 and per unit, Sales Dollars = Fixed Costs/Contribution Margin Ratio – Find ways to reduce or eliminate • Cost Volume Profit (CVP) – The more routine the process, the less the percentage of Low-value activities • Units: $10,000/4 = 2,500 (banks vs. government agencies) • Sales: $10,000/20 = $50,000 • CUSTOMER PROFITABILITY ANALYSIS $50,000 of sales creates $10,000 of profit which is equal to fixed costs • Takes ABC Concept beyond the “cost of sales” – Profit Planning (Moving beyond breakeven) • Perspective (single cell, age of reptiles & snakes, man walks upright) • Treat target profit as an additional fixed cost • Used to assess customer profitability • To get pretax profits, divide by (1- tax rate) – The “Whale Curve” Phenomena – Sensitivity Analysis – CUSTOMER PROFITABILITY ANALYSIS • Margin of Safety – number of units above breakeven • Angels & Demons Matrix • Operating Leverage – (Contribution Margin/Operating Profit) • Shift in Marketing focus from “Spray & Pray” to “Investing in Customers) – Higher values for firms with high fixed costs – Cheaper to keep old customers than get new ones and expensive to get back lost » Good when above breakeven customers. » Bad when below – Customer life value takes a longer run view – i.e., customer at age 35 vs. age 85 » Airline example, 72.4% was profitable in the 90’s, but 70.4% post CHAPTERS 9 & 13 9-11 was disastrous Target Costing, Theory of Constraints, & CVP – Lower values for firms with low fixed costs • Target Costing » Profit is less dramatically affected by • Focus is on how to use costs vs. classify costs (Ch. 3 & 5) swings in volume/revenue – Will the costs we plan to incur allow us to earn a profit? If not, what can we do? • Critical Success Factors at the Design Stage: – Target Price = Target Cost + Desired Profit – Reduced time to market • The Survival Triplet (linked to strategy) – Reduced expected service costs Cost Price – Reduced product environmental impact – Improved ease of manufacture Functionality Quality – Process Planning and Design (trade-offs) (meets specs) • Sales Life Cycle Fancy features sticking with fundamentals – Phase 1: Introduction or R&D Design high cost / low profit • Costs must be considered in the context of Life Cycle and Value Chain • Little competition, slow sales, costs relatively high, prices are high • Target Costing due to product differentiation • What should be our focus? – Long Term: All costs must be considered, including fixed (All stages in L.C.) – Phase 2: Growth or Introduction high costs / high returns • Sales increase rapidly; – Short Term: Just those costs under our control, variable (current phase in L.C.) – Phase 3: Maturity small costs / high profits • How do costs change over time? – Highest at introduction, lowest at maturity – Phase 4: Decline low costs / med/low profits • May change with volume too – step functions, relevant range, CHAPTER 10 learning curves Master Budget
- 5. • Relationship to Strategy • Budget is how management implements strategy – Formal expression of plans/communication • Hopefully motivational???? • Expressed in operational terms (dollars/units) – Forward looking – Basis for Assessment • Should not be dominate purpose – Matches External and Internal Factors • External (Opportunities & Threats) • Internal (Strengths & Weaknesses – competitive advantage) – Budgeting Process An “ideal Process” 1. Budget Committee Formation 2. Selection of Budget Period – Fixed or Rolling (usually 12 month minimum) 3. Budget Guidelines – Zero Base or (not preferred) Revision of Prior Budget 4. Preparation of Initial Proposal 5. Negotiation of Final Budget (incorporation of input from those affected) 6. Review and Approval 7. Revision After Implementation 8. Evaluation – Budget Hierarchy