SlideShare uma empresa Scribd logo
1 de 20
Baixar para ler offline
Blake Taylor                                                                                                                                                                              Taylor Real Estate
                                                                            Median Sold Price by Month
                                                                   Dec-09 vs. Dec-11: The median sold price is up 19%


                                                                                  Dec-09 vs. Dec-11
                  Dec-09                                           Dec-11                                          Change                                             %
                  105,000                                          125,000                                         20,000                                            +19%


MLS: ACTRIS       Period:   2 years (monthly)           Price:   All                         Construction Type:    All            Bedrooms:       All          Bathrooms:       All   Lot Size: All
Property Types:   Residential: (House, Condo, Townhouse, Half Duplex, Modular)                                                                                                        Sq Ft:    All
MLS Areas:        2N


Clarus MarketMetrics®                                                                                     1 of 2                                                                                      01/13/2012
                                                Information not guaranteed. © 2012 - 2013 Terradatum and its suppliers and licensors (www.terradatum.com/about/licensors.td).


                               www.TaylorRealEstateAustin.com                 |   Direct: 512.796.4447         |   Fax: 512.628.7720          |    2525 Wallingwood Bldg. 7C Austin, TX 78746
                                                                                                                                                  1 of 20
Blake Taylor                                                                                                                                                                Taylor Real Estate
                                                                    Median Sold Price by Month
                                                           Dec-09 vs. Dec-11: The median sold price is up 19%


Time Period             Median Price            # Units        Average DOM
Dec-11                      125,000                   25                    68
Nov-11                        84,500                  29                    70
Oct-11                      115,000                   23                    89
Sep-11                      114,950                   23                    62
Aug-11                      116,750                   34                    77
Jul-11                      127,250                   26                    61
Jun-11                      128,350                   31                    50
May-11                      113,000                   31                    62
Apr-11                      113,050                   20                    49
Mar-11                      145,000                   25                   106
Feb-11                      108,900                   20                    86
Jan-11                      105,838                   18                    89
Dec-10                        96,000                  24                   121
Nov-10                      103,500                   28                    64
Oct-10                      115,000                   23                    76
Sep-10                      119,900                   21                    63
Aug-10                      104,262                   20                    56
Jul-10                      131,700                   20                    63
Jun-10                      114,000                   35                    39
May-10                      118,000                   42                    53
Apr-10                      126,250                   36                    53
Mar-10                      129,000                   35                    49
Feb-10                      111,000                   18                    55
Jan-10                      106,000                   18                    64
Dec-09                      105,000                   25                    49


Clarus MarketMetrics®                                                                            2 of 2                                                                                01/13/2012
                                       Information not guaranteed. © 2012 - 2013 Terradatum and its suppliers and licensors (www.terradatum.com/about/licensors.td).


                           www.TaylorRealEstateAustin.com            |   Direct: 512.796.4447         |   Fax: 512.628.7720          |    2525 Wallingwood Bldg. 7C Austin, TX 78746
                                                                                                                                         2 of 20
Blake Taylor                                                                                                                                                                                 Taylor Real Estate
                                                                         Median For Sale vs. Median Sold
             Dec-09 vs. Dec-11: The median price of for sale properties is down 7% and the median price of sold properties is up 19%


                            Dec-09 vs. Dec-11                                                                                                                         Dec-09 vs. Dec-11
    Dec-09             Dec-11                Change                       %                                                                     Dec-09              Dec-11             Change             %
    123,000            114,900                -8,100                     -7%                                                                    105,000             125,000            20,000            +19%


MLS: ACTRIS       Period:    2 years (monthly)            Price:   All                        Construction Type:    All             Bedrooms:       All         Bathrooms:       All     Lot Size: All
Property Types:   Residential: (House, Condo, Townhouse, Half Duplex, Modular)                                                                                                           Sq Ft:    All
MLS Areas:        2N


Clarus MarketMetrics®                                                                                      1 of 2                                                                                         01/13/2012
                                                 Information not guaranteed. © 2012 - 2013 Terradatum and its suppliers and licensors (www.terradatum.com/about/licensors.td).


                                www.TaylorRealEstateAustin.com                 |   Direct: 512.796.4447         |   Fax: 512.628.7720           |    2525 Wallingwood Bldg. 7C Austin, TX 78746
                                                                                                                                                    3 of 20
Blake Taylor                                                                                                                                                           Taylor Real Estate
                                                          Median For Sale vs. Median Sold
          Dec-09 vs. Dec-11: The median price of for sale properties is down 7% and the median price of sold properties is up 19%

                            For Sale             # Properties                         Sold                 # Properties                        Price
Time Period                  Median                  For Sale                       Median                        Sold                    Difference
Dec-11                      114,900                        133                     125,000                            25                      10,100
Nov-11                      117,500                        159                       84,500                           29                     -33,000
Oct-11                      118,250                        178                     115,000                            23                       -3,250
Sep-11                      122,000                        191                     114,950                            23                       -7,050
Aug-11                      119,450                        196                     116,750                            34                       -2,700
Jul-11                      129,000                        201                     127,250                            26                       -1,750
Jun-11                      128,000                        205                     128,350                            31                          350
May-11                      129,450                        192                     113,000                            31                     -16,450
Apr-11                      126,998                        187                     113,050                            20                     -13,948
Mar-11                      119,900                        185                     145,000                            25                      25,100
Feb-11                      124,500                        159                     108,900                            20                     -15,600
Jan-11                      124,500                        179                     105,838                            18                     -18,663
Dec-10                      119,000                        183                       96,000                           24                     -23,000
Nov-10                      120,000                        187                     103,500                            28                     -16,500
Oct-10                      121,450                        200                     115,000                            23                       -6,450
Sep-10                      121,900                        213                     119,900                            21                       -2,000
Aug-10                      125,000                        212                     104,262                            20                     -20,738
Jul-10                      130,000                        199                     131,700                            20                        1,700
Jun-10                      130,000                        195                     114,000                            35                     -16,000
May-10                      130,000                        191                     118,000                            42                     -12,000
Apr-10                      129,900                        224                     126,250                            36                       -3,650
Mar-10                      129,000                        212                     129,000                            35                            0
Feb-10                      125,000                        185                     111,000                            18                     -14,000
Jan-10                      124,414                        169                     106,000                            18                     -18,414
Dec-09                      123,000                        153                     105,000                            25                     -18,000


Clarus MarketMetrics®                                                                         2 of 2                                                                              01/13/2012
                                   Information not guaranteed. © 2012 - 2013 Terradatum and its suppliers and licensors (www.terradatum.com/about/licensors.td).


                        www.TaylorRealEstateAustin.com           |   Direct: 512.796.4447         |    Fax: 512.628.7720        |    2525 Wallingwood Bldg. 7C Austin, TX 78746
                                                                                                                                    4 of 20
Blake Taylor                                                                                                                                                                              Taylor Real Estate
                                                                                     Sold Properties by Month
                                                       Dec-09 vs. Dec-11: The number of Sold properties has not changed


                                                                                     Dec-09 vs. Dec-11
                  Dec-09                                                Dec-11                                     Change                                              %
                    25                                                    25                                         0                                                 0%


MLS: ACTRIS       Period:   2 years (monthly)            Price:   All                        Construction Type:    All             Bedrooms:       All         Bathrooms:       All   Lot Size: All
Property Types:   Residential: (House, Condo, Townhouse, Half Duplex, Modular)                                                                                                        Sq Ft:    All
MLS Areas:        2N


Clarus MarketMetrics®                                                                                     1 of 2                                                                                      01/13/2012
                                                Information not guaranteed. © 2012 - 2013 Terradatum and its suppliers and licensors (www.terradatum.com/about/licensors.td).


                               www.TaylorRealEstateAustin.com                    |   Direct: 512.796.4447      |   Fax: 512.628.7720           |    2525 Wallingwood Bldg. 7C Austin, TX 78746
                                                                                                                                                   5 of 20
Blake Taylor                                                                                                                                                                         Taylor Real Estate
                                                                          Sold Properties by Month
                                               Dec-09 vs. Dec-11: The number of Sold properties has not changed


                                       Full Market                                                 Bank Properties                                             Non-Bank Properties
Time Period             # Properties       Median Price         Average DOM              # Properties          % Bank           Median Price            # Properties    % Non-Bank        Median Price
Dec-11                           25              125,000                     68                      5            20.0                    97,000                  20          80.0            127,000
Nov-11                           29               84,500                     70                      4            13.8                    68,500                  25          86.2             85,000
Oct-11                           23              115,000                     89                      5            21.7                    89,000                  18          78.3            130,125
Sep-11                           23              114,950                     62                      6            26.1                    83,950                  17          73.9            124,500
Aug-11                           34              116,750                     77                      5            14.7                126,000                     29          85.3            115,000
Jul-11                           26              127,250                     61                      5            19.2                    77,700                  21          80.8            130,000
Jun-11                           31              128,350                     50                      3             9.7                    86,000                  28          90.3            134,000
May-11                           31              113,000                     62                      5            16.1                113,000                     26          83.9            120,625
Apr-11                           20              113,050                     49                      1             5.0                    99,900                  19          95.0            113,600
Mar-11                           25              145,000                    106                      3            12.0                118,900                     22          88.0            146,250
Feb-11                           20              108,900                     86                      7            35.0                    95,000                  13          65.0            126,000
Jan-11                           18              105,838                     89                      4            22.2                    62,500                  14          77.8            119,500
Dec-10                           24               96,000                    121                      8            33.3                    67,300                  16          66.7            121,500
Nov-10                           28              103,500                     64                      7            25.0                    54,500                  21          75.0            120,000
Oct-10                           23              115,000                     76                      2             8.7                    88,250                  21          91.3            123,500
Sep-10                           21              119,900                     63                      3            14.3                    49,500                  18          85.7            141,950
Aug-10                           20              104,262                     56                      4            20.0                    73,180                  16          80.0            133,500
Jul-10                           20              131,700                     63                      3            15.0                103,001                     17          85.0            134,900
Jun-10                           35              114,000                     39                      8            22.9                    68,357                  27          77.1            135,000
May-10                           42              118,000                     53                      9            21.4                    77,000                  33          78.6            127,000
Apr-10                           36              126,250                     53                      1             2.8                    70,000                  35          97.2            127,500
Mar-10                           35              129,000                     49                      5            14.3                    84,000                  30          85.7            135,000
Feb-10                           18              111,000                     55                      5            27.8                    36,175                  13          72.2            122,900
Jan-10                           18              106,000                     64                      2            11.1                    80,875                  16          88.9            106,000
Dec-09                           25              105,000                     49                      5            20.0                    52,000                  20          80.0            121,500


Clarus MarketMetrics®                                                                             2 of 2                                                                                        01/13/2012
                                        Information not guaranteed. © 2012 - 2013 Terradatum and its suppliers and licensors (www.terradatum.com/about/licensors.td).


                           www.TaylorRealEstateAustin.com             |   Direct: 512.796.4447           |   Fax: 512.628.7720        |     2525 Wallingwood Bldg. 7C Austin, TX 78746
                                                                                                                                           6 of 20
Blake Taylor                                                                                                                                                                              Taylor Real Estate
                                                                    Under Contract Properties by Month
                                                     Dec-09 vs. Dec-11: The number of Under Contract properties is up 5%


                                                                                     Dec-09 vs. Dec-11
                  Dec-09                                                Dec-11                                     Change                                              %
                    22                                                    23                                         1                                                +5%


MLS: ACTRIS       Period:   2 years (monthly)            Price:   All                        Construction Type:    All             Bedrooms:       All         Bathrooms:       All   Lot Size: All
Property Types:   Residential: (House, Condo, Townhouse, Half Duplex, Modular)                                                                                                        Sq Ft:    All
MLS Areas:        2N


Clarus MarketMetrics®                                                                                     1 of 2                                                                                      01/13/2012
                                                Information not guaranteed. © 2012 - 2013 Terradatum and its suppliers and licensors (www.terradatum.com/about/licensors.td).


                               www.TaylorRealEstateAustin.com                    |   Direct: 512.796.4447      |   Fax: 512.628.7720           |    2525 Wallingwood Bldg. 7C Austin, TX 78746
                                                                                                                                                   7 of 20
Blake Taylor                                                                                                                                                                         Taylor Real Estate
                                                           Under Contract Properties by Month
                                             Dec-09 vs. Dec-11: The number of Under Contract properties is up 5%


                                       Full Market                                                 Bank Properties                                             Non-Bank Properties
Time Period             # Properties       Median Price         Average DOM              # Properties          % Bank           Median Price            # Properties    % Non-Bank        Median Price
Dec-11                           23              121,200                     70                      7            30.4                    97,500                  16          69.6            132,495
Nov-11                           29              109,900                     82                      4            13.8                104,900                     25          86.2            114,998
Oct-11                           26              123,700                     85                      4            15.4                    80,000                  22          84.6            129,700
Sep-11                           23              111,500                     93                      5            21.7                    88,000                  18          78.3            130,950
Aug-11                           26               99,921                     67                      6            23.1                    86,450                  20          76.9            111,500
Jul-11                           37              129,900                     77                      9            24.3                122,399                     28          75.7            137,450
Jun-11                           26              147,200                     63                      1             3.9                116,910                     25          96.2            154,500
May-11                           24              119,900                     55                      3            12.5                    86,000                  21          87.5            126,000
Apr-11                           32              138,550                     42                      2             6.2                    68,550                  30          93.8            142,500
Mar-11                           23              137,800                     87                      4            17.4                134,900                     19          82.6            137,800
Feb-11                           19              145,000                     90                      1             5.3                    39,900                  18          94.7            147,450
Jan-11                           26              124,450                     76                     10            38.5                    92,400                  16          61.5            146,000
Dec-10                           25               95,000                    112                      8            32.0                    64,900                  17          68.0            114,714
Nov-10                           16              104,450                    104                      5            31.2                    69,900                  11          68.8            147,900
Oct-10                           26              122,200                     66                      3            11.5                    79,900                  23          88.5            129,900
Sep-10                           24              117,450                     75                      5            20.8                    61,900                  19          79.2            119,999
Aug-10                           23              129,000                     64                      4            17.4                    85,900                  19          82.6            139,900
Jul-10                           19              132,900                     59                      3            15.8                    34,900                  16          84.2            136,950
Jun-10                           20              109,900                     60                      3            15.0                    79,900                  17          85.0            139,000
May-10                           18              109,950                     38                      7            38.9                    72,270                  11          61.1            149,500
Apr-10                           50              128,000                     46                      5            10.0                    49,995                  45          90.0            130,900
Mar-10                           50              129,900                     46                      6            12.0                    86,350                  44          88.0            137,450
Feb-10                           27              129,900                     61                      5            18.5                105,000                     22          81.5            134,500
Jan-10                           23              118,000                     75                      4            17.4                    59,250                  19          82.6            119,900
Dec-09                           22              103,395                     43                      4            18.2                    51,308                  18          81.8            112,498


Clarus MarketMetrics®                                                                             2 of 2                                                                                        01/13/2012
                                        Information not guaranteed. © 2012 - 2013 Terradatum and its suppliers and licensors (www.terradatum.com/about/licensors.td).


                           www.TaylorRealEstateAustin.com             |   Direct: 512.796.4447           |   Fax: 512.628.7720        |     2525 Wallingwood Bldg. 7C Austin, TX 78746
                                                                                                                                           8 of 20
Blake Taylor                                                                                                                                                                              Taylor Real Estate
                                                                                     New Properties by Month
                                                           Dec-09 vs. Dec-11: The number of New properties is down 28%


                                                                                     Dec-09 vs. Dec-11
                  Dec-09                                                Dec-11                                     Change                                               %
                    25                                                    18                                         -7                                               -28%


MLS: ACTRIS       Period:   2 years (monthly)            Price:   All                        Construction Type:    All             Bedrooms:       All         Bathrooms:       All   Lot Size: All
Property Types:   Residential: (House, Condo, Townhouse, Half Duplex, Modular)                                                                                                        Sq Ft:    All
MLS Areas:        2N


Clarus MarketMetrics®                                                                                     1 of 2                                                                                      01/13/2012
                                                Information not guaranteed. © 2012 - 2013 Terradatum and its suppliers and licensors (www.terradatum.com/about/licensors.td).


                               www.TaylorRealEstateAustin.com                    |   Direct: 512.796.4447      |   Fax: 512.628.7720           |    2525 Wallingwood Bldg. 7C Austin, TX 78746
                                                                                                                                                   9 of 20
Blake Taylor                                                                                                                                                                      Taylor Real Estate
                                                                         New Properties by Month
                                                  Dec-09 vs. Dec-11: The number of New properties is down 28%


                            Full Market                                    Bank Properties                                               Non-Bank Properties
Time Period             # Properties      Median Price            # Properties         % Bank              Median Price         # Properties       % Non-Bank          Median Price
Dec-11                           18              96,400                       5           27.8                  44,959                      13              72.2           109,900
Nov-11                           40             109,250                       8           20.0                  87,700                      32              80.0           120,550
Oct-11                           30             110,250                       4           13.3                 105,700                      26              86.7           110,500
Sep-11                           33             119,900                       2             6.1                 81,250                      31              93.9           121,500
Aug-11                           44             116,000                       3             6.8                 99,000                      41              93.2           117,500
Jul-11                           44             129,900                       8           18.2                  96,250                      36              81.8           158,450
Jun-11                           53             128,000                     11            20.8                  85,500                      42              79.2           139,500
May-11                           47             139,900                       3             6.4                119,000                      44              93.6           139,900
Apr-11                           46             134,750                       6           13.0                 107,950                      40              87.0           139,900
Mar-11                           53             114,000                       3             5.7                105,000                      50              94.3           114,500
Feb-11                           27             129,000                       0                                                             27             100.0           129,000
Jan-11                           43             118,000                       7           16.3                 116,910                      36              83.7           122,750
Dec-10                           30             114,500                       7           23.3                  99,900                      23              76.7           119,000
Nov-10                           37             112,000                       7           18.9                  74,900                      30              81.1           121,450
Oct-10                           30             114,400                       6           20.0                  78,575                      24              80.0           126,200
Sep-10                           43             119,500                     10            23.3                 102,450                      33              76.7           129,900
Aug-10                           51             114,714                       8           15.7                  65,900                      43              84.3           118,900
Jul-10                           46             116,400                       7           15.2                  89,900                      39              84.8           129,900
Jun-10                           45             134,900                       7           15.6                  99,900                      38              84.4           138,500
May-10                           45             130,000                       7           15.6                  85,300                      38              84.4           132,450
Apr-10                           73             137,900                       8           11.0                  61,132                      65              89.0           144,900
Mar-10                           62             135,200                       3             4.8                 79,900                      59              95.2           135,900
Feb-10                           47             134,900                       8           17.0                  78,500                      39              83.0           149,000
Jan-10                           60             132,700                       1             1.7                132,500                      59              98.3           132,900
Dec-09                           25             115,000                       5           20.0                  52,717                      20              80.0           116,950


Clarus MarketMetrics®                                                                             2 of 2                                                                                    01/13/2012
                                       Information not guaranteed. © 2012 - 2013 Terradatum and its suppliers and licensors (www.terradatum.com/about/licensors.td).


                           www.TaylorRealEstateAustin.com            |   Direct: 512.796.4447          |    Fax: 512.628.7720        |    2525 Wallingwood Bldg. 7C Austin, TX 78746
                                                                                                                                         10 of 20
Blake Taylor                                                                                                                                                                              Taylor Real Estate
                                                                            For Sale Properties by Month
                                                       Dec-09 vs. Dec-11: The number of For Sale properties is down 13%


                                                                                     Dec-09 vs. Dec-11
                  Dec-09                                                Dec-11                                     Change                                               %
                   153                                                   133                                         -20                                              -13%


MLS: ACTRIS       Period:   2 years (monthly)            Price:   All                        Construction Type:    All             Bedrooms:       All         Bathrooms:       All   Lot Size: All
Property Types:   Residential: (House, Condo, Townhouse, Half Duplex, Modular)                                                                                                        Sq Ft:    All
MLS Areas:        2N


Clarus MarketMetrics®                                                                                     1 of 2                                                                                      01/13/2012
                                                Information not guaranteed. © 2012 - 2013 Terradatum and its suppliers and licensors (www.terradatum.com/about/licensors.td).


                               www.TaylorRealEstateAustin.com                    |   Direct: 512.796.4447      |   Fax: 512.628.7720           |    2525 Wallingwood Bldg. 7C Austin, TX 78746
                                                                                                                                                   11 of 20
Blake Taylor                                                                                                                                                                         Taylor Real Estate
                                                                   For Sale Properties by Month
                                               Dec-09 vs. Dec-11: The number of For Sale properties is down 13%


                                       Full Market                                                 Bank Properties                                             Non-Bank Properties
Time Period             # Properties       Median Price         Average DOM              # Properties          % Bank           Median Price            # Properties    % Non-Bank        Median Price
Dec-11                          133              114,900                    141                     21            15.8                    89,900                 112          84.2            119,450
Nov-11                          159              117,500                    126                     20            12.6                    98,250                 139          87.4            122,000
Oct-11                          178              118,250                    129                     16             9.0                    98,250                 162          91.0            123,775
Sep-11                          191              122,000                    125                     17             8.9                    94,900                 174          91.1            127,500
Aug-11                          196              119,450                    117                     23            11.7                    94,900                 173          88.3            128,000
Jul-11                          201              129,000                    111                     29            14.4                    97,600                 172          85.6            133,000
Jun-11                          205              128,000                    118                     25            12.2                105,000                    180          87.8            129,900
May-11                          192              129,450                    120                     18             9.4                119,450                    174          90.6            129,900
Apr-11                          187              126,998                    119                     17             9.1                116,910                    170          90.9            128,000
Mar-11                          185              119,900                    126                     17             9.2                116,910                    168          90.8            124,575
Feb-11                          159              124,500                    138                     15             9.4                116,910                    144          90.6            124,825
Jan-11                          179              124,500                    127                     26            14.5                109,700                    153          85.5            125,000
Dec-10                          183              119,000                    135                     28            15.3                    94,500                 155          84.7            121,900
Nov-10                          187              120,000                    130                     26            13.9                    82,950                 161          86.1            125,000
Oct-10                          200              121,450                    123                     25            12.5                    84,900                 175          87.5            125,000
Sep-10                          213              121,900                    112                     25            11.7                    85,300                 188          88.3            125,000
Aug-10                          212              125,000                    104                     19             9.0                    84,900                 193          91.0            129,900
Jul-10                          199              130,000                     98                     17             8.5                    99,900                 182          91.5            134,950
Jun-10                          195              130,000                    110                     16             8.2                    99,900                 179          91.8            134,900
May-10                          191              130,000                    107                     16             8.4                    84,478                 175          91.6            134,900
Apr-10                          224              129,900                    106                     17             7.6                    79,900                 207          92.4            134,900
Mar-10                          212              129,000                    112                     15             7.1                    89,900                 197          92.9            130,000
Feb-10                          185              125,000                    115                     17             9.2                    99,900                 168          90.8            129,900
Jan-10                          169              124,414                    116                     14             8.3                102,450                    155          91.7            125,000
Dec-09                          153              123,000                    131                     18            11.8                    87,775                 135          88.2            125,000


Clarus MarketMetrics®                                                                             2 of 2                                                                                        01/13/2012
                                        Information not guaranteed. © 2012 - 2013 Terradatum and its suppliers and licensors (www.terradatum.com/about/licensors.td).


                           www.TaylorRealEstateAustin.com             |   Direct: 512.796.4447           |   Fax: 512.628.7720        |    2525 Wallingwood Bldg. 7C Austin, TX 78746
                                                                                                                                          12 of 20
Blake Taylor                                                                                                                                                                              Taylor Real Estate
                                                                            Expired Properties by Month
                                                          Dec-09 vs. Dec-11: The number of Expired properties is up 23%


                                                                                     Dec-09 vs. Dec-11
                  Dec-09                                                Dec-11                                     Change                                              %
                    22                                                    27                                         5                                                +23%


MLS: ACTRIS       Period:   2 years (monthly)            Price:   All                        Construction Type:    All             Bedrooms:       All         Bathrooms:       All   Lot Size: All
Property Types:   Residential: (House, Condo, Townhouse, Half Duplex, Modular)                                                                                                        Sq Ft:    All
MLS Areas:        2N


Clarus MarketMetrics®                                                                                     1 of 2                                                                                      01/13/2012
                                                Information not guaranteed. © 2012 - 2013 Terradatum and its suppliers and licensors (www.terradatum.com/about/licensors.td).


                               www.TaylorRealEstateAustin.com                    |   Direct: 512.796.4447      |   Fax: 512.628.7720           |    2525 Wallingwood Bldg. 7C Austin, TX 78746
                                                                                                                                                   13 of 20
Blake Taylor                                                                                                                                                                         Taylor Real Estate
                                                                    Expired Properties by Month
                                                  Dec-09 vs. Dec-11: The number of Expired properties is up 23%


                                       Full Market                                                 Bank Properties                                             Non-Bank Properties
Time Period             # Properties      Median Price          Average DOM             # Properties           % Bank          Median Price            # Properties     % Non-Bank       Median Price
Dec-11                           27              110,500                    235                      4            14.8                    42,930                  23          85.2           114,900
Nov-11                           15              125,990                    124                      0                                                            15         100.0           125,990
Oct-11                           33              109,900                    119                      0                                                            33         100.0           109,900
Sep-11                           20              129,000                    130                      0                                                            20         100.0           129,000
Aug-11                           12              152,000                    102                      2            16.7                199,999                     10          83.3           152,000
Jul-11                           12              147,450                    112                      0                                                            12         100.0           147,450
Jun-11                           22              122,500                    222                      3            13.6                279,900                     19          86.4           117,900
May-11                           16              144,450                    129                      1             6.2                129,900                     15          93.8           149,900
Apr-11                           10              122,450                    220                      0                                                            10         100.0           122,450
Mar-11                           21              109,900                    150                      2             9.5                105,286                     19          90.5           112,000
Feb-11                            8              110,250                    144                      0                                                              8        100.0           110,250
Jan-11                           21              144,900                    111                      1             4.8                154,900                     20          95.2           144,400
Dec-10                           22              116,450                    149                      1             4.5                    99,900                  21          95.5           118,000
Nov-10                           18              139,872                    136                      0                                                            18         100.0           139,872
Oct-10                           24              121,450                    116                      3            12.5                105,000                     21          87.5           125,000
Sep-10                           19              119,900                    123                      1             5.3                    85,300                  18          94.7           126,200
Aug-10                           19              148,900                     80                      0                                                            19         100.0           148,900
Jul-10                           19              135,500                     77                      3            15.8                    99,900                  16          84.2           141,450
Jun-10                           22              129,500                    172                      3            13.6                279,900                     19          86.4           129,000
May-10                           23              135,000                    113                      0                                                            23         100.0           135,000
Apr-10                           28              117,450                    125                      3            10.7                123,000                     25          89.3           115,900
Mar-10                           11              149,900                    150                      0                                                            11         100.0           149,900
Feb-10                            8              134,900                     74                      0                                                              8        100.0           134,900
Jan-10                            8              139,750                     72                      1            12.5                    80,000                    7         87.5           159,500
Dec-09                           22              144,950                    136                      1             4.5                199,900                     21          95.5           144,900


Clarus MarketMetrics®                                                                             2 of 2                                                                                        01/13/2012
                                        Information not guaranteed. © 2012 - 2013 Terradatum and its suppliers and licensors (www.terradatum.com/about/licensors.td).


                            www.TaylorRealEstateAustin.com            |   Direct: 512.796.4447           |   Fax: 512.628.7720        |    2525 Wallingwood Bldg. 7C Austin, TX 78746
                                                                                                                                          14 of 20
Blake Taylor                                                                                                                                                                                 Taylor Real Estate
                                                                                Supply & Demand by Month
              Dec-09 vs. Dec-11: The number of for sale properties is down 13% and the number of sold properties has not changed


                            Dec-09 vs. Dec-11                                                                                                                         Dec-09 vs. Dec-11
     Dec-09             Dec-11               Change                        %                                                                    Dec-09              Dec-11             Change            %
      153                133                   -20                       -13%                                                                     25                  25                 0               0%


MLS: ACTRIS       Period:    2 years (monthly)            Price:   All                        Construction Type:    All             Bedrooms:       All         Bathrooms:       All     Lot Size: All
Property Types:   Residential: (House, Condo, Townhouse, Half Duplex, Modular)                                                                                                           Sq Ft:    All
MLS Areas:        2N


Clarus MarketMetrics®                                                                                      1 of 2                                                                                        01/13/2012
                                                 Information not guaranteed. © 2012 - 2013 Terradatum and its suppliers and licensors (www.terradatum.com/about/licensors.td).


                                www.TaylorRealEstateAustin.com                  |   Direct: 512.796.4447        |   Fax: 512.628.7720           |    2525 Wallingwood Bldg. 7C Austin, TX 78746
                                                                                                                                                    15 of 20
Blake Taylor                                                                                                                                                             Taylor Real Estate
                                                                 Supply & Demand by Month
              Dec-09 vs. Dec-11: The number of for sale properties is down 13% and the number of sold properties has not changed

                          # Properties           Average DOM                    # Properties                Average DOM
Time Period                   For Sale                For Sale                         Sold                         Sold
Dec-11                            133                        141                            25                          68
Nov-11                            159                        126                            29                          70
Oct-11                            178                        129                            23                          89
Sep-11                            191                        125                            23                          62
Aug-11                            196                        117                            34                          77
Jul-11                            201                        111                            26                          61
Jun-11                            205                        118                            31                          50
May-11                            192                        120                            31                          62
Apr-11                            187                        119                            20                          49
Mar-11                            185                        126                            25                         106
Feb-11                            159                        138                            20                          86
Jan-11                            179                        127                            18                          89
Dec-10                            183                        135                            24                         121
Nov-10                            187                        130                            28                          64
Oct-10                            200                        123                            23                          76
Sep-10                            213                        112                            21                          63
Aug-10                            212                        104                            20                          56
Jul-10                            199                          98                           20                          63
Jun-10                            195                        110                            35                          39
May-10                            191                        107                            42                          53
Apr-10                            224                        106                            36                          53
Mar-10                            212                        112                            35                          49
Feb-10                            185                        115                            18                          55
Jan-10                            169                        116                            18                          64
Dec-09                            153                        131                            25                          49


Clarus MarketMetrics®                                                                            2 of 2                                                                             01/13/2012
                                     Information not guaranteed. © 2012 - 2013 Terradatum and its suppliers and licensors (www.terradatum.com/about/licensors.td).


                         www.TaylorRealEstateAustin.com             |   Direct: 512.796.4447         |    Fax: 512.628.7720       |    2525 Wallingwood Bldg. 7C Austin, TX 78746
                                                                                                                                      16 of 20
Blake Taylor                                                                                                                                                                              Taylor Real Estate
                                                                  The Average Days on Market by Month
                                                              Dec-09 vs. Dec-11: The average days on market is up 62%


                                                                                     Dec-09 vs. Dec-11
                  Dec-09                                                Dec-11                                     Change                                              %
                    43                                                    70                                         27                                               +62%


MLS: ACTRIS       Period:   2 years (monthly)            Price:   All                        Construction Type:    All             Bedrooms:       All         Bathrooms:       All   Lot Size: All
Property Types:   Residential: (House, Condo, Townhouse, Half Duplex, Modular)                                                                                                        Sq Ft:    All
MLS Areas:        2N


Clarus MarketMetrics®                                                                                     1 of 2                                                                                      01/13/2012
                                                Information not guaranteed. © 2012 - 2013 Terradatum and its suppliers and licensors (www.terradatum.com/about/licensors.td).


                               www.TaylorRealEstateAustin.com                    |   Direct: 512.796.4447      |   Fax: 512.628.7720           |    2525 Wallingwood Bldg. 7C Austin, TX 78746
                                                                                                                                                   17 of 20
Blake Taylor                                                                                                                                                               Taylor Real Estate
                                                      The Average Days on Market by Month
                                                    Dec-09 vs. Dec-11: The average days on market is up 62%


Time Period             Average DOM       # UC Units
Dec-11                           70                 23
Nov-11                           82                 29
Oct-11                           85                 26
Sep-11                           93                 23
Aug-11                           67                 26
Jul-11                           77                 37
Jun-11                           63                 26
May-11                           55                 24
Apr-11                           42                 32
Mar-11                           87                 23
Feb-11                           90                 19
Jan-11                           76                 26
Dec-10                          112                 25
Nov-10                          104                 16
Oct-10                           66                 26
Sep-10                           75                 24
Aug-10                           64                 23
Jul-10                           59                 19
Jun-10                           60                 20
May-10                           38                 18
Apr-10                           46                 50
Mar-10                           46                 50
Feb-10                           61                 27
Jan-10                           75                 23
Dec-09                           43                 22


Clarus MarketMetrics®                                                                           2 of 2                                                                                01/13/2012
                                      Information not guaranteed. © 2012 - 2013 Terradatum and its suppliers and licensors (www.terradatum.com/about/licensors.td).


                            www.TaylorRealEstateAustin.com          |   Direct: 512.796.4447         |   Fax: 512.628.7720          |    2525 Wallingwood Bldg. 7C Austin, TX 78746
                                                                                                                                        18 of 20
Blake Taylor                                                                                                                                                                              Taylor Real Estate
                                                                             Months Supply of Inventory
                                                  Dec-09 vs. Dec-11: The average months supply of inventory is down 27%


                                                                                    Dec-09 vs. Dec-11
                  Dec-09                                               Dec-11                                      Change                                               %
                   5.0                                                  3.6                                         -1.3                                              -27%


MLS: ACTRIS       Period:   2 years (monthly)           Price:   All                         Construction Type:    All            Bedrooms:       All          Bathrooms:       All   Lot Size: All
Property Types:   Residential: (House, Condo, Townhouse, Half Duplex, Modular)                                                                                                        Sq Ft:    All
MLS Areas:        2N


Clarus MarketMetrics®                                                                                     1 of 2                                                                                      01/13/2012
                                                Information not guaranteed. © 2012 - 2013 Terradatum and its suppliers and licensors (www.terradatum.com/about/licensors.td).


                               www.TaylorRealEstateAustin.com                   |   Direct: 512.796.4447       |   Fax: 512.628.7720          |    2525 Wallingwood Bldg. 7C Austin, TX 78746
                                                                                                                                                  19 of 20
Blake Taylor                                                                                                                                                                 Taylor Real Estate
                                                                      Months Supply of Inventory
                                             Dec-09 vs. Dec-11: The average months supply of inventory is down 27%

                          # Units For Sale       # UC Units                                   UC Average
Time Period             Last Day of Month      During Month                      MSI                DOM
Dec-11                       83                             23                    3.6                       70
Nov-11                      115                             29                    4.0                       82
Oct-11                      119                             26                    4.6                       85
Sep-11                      148                             23                    6.4                       93
Aug-11                      158                             26                    6.1                       67
Jul-11                      152                             37                    4.1                       77
Jun-11                      157                             26                    6.0                       63
May-11                      152                             24                    6.3                       55
Apr-11                      145                             32                    4.5                       42
Mar-11                      141                             23                    6.1                       87
Feb-11                      132                             19                    6.9                       90
Jan-11                      132                             26                    5.1                       76
Dec-10                      136                             25                    5.4                   112
Nov-10                      153                             16                    9.6                   104
Oct-10                      150                             26                    5.8                       66
Sep-10                      170                             24                    7.1                       75
Aug-10                      170                             23                    7.4                       64
Jul-10                      161                             19                    8.5                       59
Jun-10                      153                             20                    7.7                       60
May-10                      150                             18                    8.3                       38
Apr-10                      146                             50                    2.9                       46
Mar-10                      151                             50                    3.0                       46
Feb-10                      150                             27                    5.6                       61
Jan-10                      138                             23                    6.0                       75
Dec-09                      109                             22                    5.0                       43


Clarus MarketMetrics®                                                                              2 of 2                                                                               01/13/2012
                                         Information not guaranteed. © 2012 - 2013 Terradatum and its suppliers and licensors (www.terradatum.com/about/licensors.td).


                             www.TaylorRealEstateAustin.com            |   Direct: 512.796.4447         |    Fax: 512.628.7720        |    2525 Wallingwood Bldg. 7C Austin, TX 78746
                                                                                                                                          20 of 20

Mais conteúdo relacionado

Mais procurados

6,7, 78704, travis heights, bouldin creek, barton hills
6,7, 78704, travis heights, bouldin creek, barton hills6,7, 78704, travis heights, bouldin creek, barton hills
6,7, 78704, travis heights, bouldin creek, barton hillsTaylor Real Estate
 
Rn, steiner ranch, river place metrics
Rn, steiner ranch, river place metricsRn, steiner ranch, river place metrics
Rn, steiner ranch, river place metricsTaylor Real Estate
 
Area 4 hyde park, shoal creek, rosedale
Area 4   hyde park, shoal creek, rosedaleArea 4   hyde park, shoal creek, rosedale
Area 4 hyde park, shoal creek, rosedaleTaylor Real Estate
 
Sww, circle c, western oaks, meridian, avana
Sww, circle c, western oaks, meridian, avanaSww, circle c, western oaks, meridian, avana
Sww, circle c, western oaks, meridian, avanaTaylor Real Estate
 
1 a, nw hills, highland park, cat mountain
1 a, nw hills, highland park, cat mountain1 a, nw hills, highland park, cat mountain
1 a, nw hills, highland park, cat mountainTaylor Real Estate
 
Area 2 allandale, brentwood, crestview
Area 2   allandale, brentwood, crestviewArea 2   allandale, brentwood, crestview
Area 2 allandale, brentwood, crestviewTaylor Real Estate
 
Area 3 windsor park, delwood, mueller
Area 3   windsor park, delwood, muellerArea 3   windsor park, delwood, mueller
Area 3 windsor park, delwood, muellerTaylor Real Estate
 
10 n, 10s, south austin metrics
10 n, 10s, south austin metrics10 n, 10s, south austin metrics
10 n, 10s, south austin metricsTaylor Real Estate
 
Area 1a northwest hills, highland park
Area 1a   northwest hills, highland parkArea 1a   northwest hills, highland park
Area 1a northwest hills, highland parkTaylor Real Estate
 
Murphy TX - Housing Market Report - November 2010
Murphy TX - Housing Market Report - November 2010Murphy TX - Housing Market Report - November 2010
Murphy TX - Housing Market Report - November 2010Valarie Littles
 
Areas 6, 7 78704 - Bouldin Creek, Barton Hills, Travis Heights
Areas 6, 7  78704 - Bouldin Creek, Barton Hills, Travis HeightsAreas 6, 7  78704 - Bouldin Creek, Barton Hills, Travis Heights
Areas 6, 7 78704 - Bouldin Creek, Barton Hills, Travis HeightsTaylor Real Estate
 
Plano TX - January 2011 - Housing Market Report
Plano TX - January 2011 - Housing Market ReportPlano TX - January 2011 - Housing Market Report
Plano TX - January 2011 - Housing Market ReportValarie Littles
 

Mais procurados (20)

1 b, old west austin metrics
1 b, old west austin metrics1 b, old west austin metrics
1 b, old west austin metrics
 
6,7, 78704, travis heights, bouldin creek, barton hills
6,7, 78704, travis heights, bouldin creek, barton hills6,7, 78704, travis heights, bouldin creek, barton hills
6,7, 78704, travis heights, bouldin creek, barton hills
 
Rn, steiner ranch, river place metrics
Rn, steiner ranch, river place metricsRn, steiner ranch, river place metrics
Rn, steiner ranch, river place metrics
 
Ls, lakeway, bee cave metrics
Ls, lakeway, bee cave metricsLs, lakeway, bee cave metrics
Ls, lakeway, bee cave metrics
 
Area 4 hyde park, shoal creek, rosedale
Area 4   hyde park, shoal creek, rosedaleArea 4   hyde park, shoal creek, rosedale
Area 4 hyde park, shoal creek, rosedale
 
Area 1n jester, lakewood
Area 1n   jester, lakewoodArea 1n   jester, lakewood
Area 1n jester, lakewood
 
W Metrics
W MetricsW Metrics
W Metrics
 
Sww, circle c, western oaks, meridian, avana
Sww, circle c, western oaks, meridian, avanaSww, circle c, western oaks, meridian, avana
Sww, circle c, western oaks, meridian, avana
 
DT Downtown
DT   DowntownDT   Downtown
DT Downtown
 
1 a, nw hills, highland park, cat mountain
1 a, nw hills, highland park, cat mountain1 a, nw hills, highland park, cat mountain
1 a, nw hills, highland park, cat mountain
 
Condos only metrics
Condos only metricsCondos only metrics
Condos only metrics
 
Area 2 allandale, brentwood, crestview
Area 2   allandale, brentwood, crestviewArea 2   allandale, brentwood, crestview
Area 2 allandale, brentwood, crestview
 
Area 3 windsor park, delwood, mueller
Area 3   windsor park, delwood, muellerArea 3   windsor park, delwood, mueller
Area 3 windsor park, delwood, mueller
 
10 n, 10s, south austin metrics
10 n, 10s, south austin metrics10 n, 10s, south austin metrics
10 n, 10s, south austin metrics
 
Area 1a northwest hills, highland park
Area 1a   northwest hills, highland parkArea 1a   northwest hills, highland park
Area 1a northwest hills, highland park
 
UT
UTUT
UT
 
Murphy TX - Housing Market Report - November 2010
Murphy TX - Housing Market Report - November 2010Murphy TX - Housing Market Report - November 2010
Murphy TX - Housing Market Report - November 2010
 
Areas 6, 7 78704 - Bouldin Creek, Barton Hills, Travis Heights
Areas 6, 7  78704 - Bouldin Creek, Barton Hills, Travis HeightsAreas 6, 7  78704 - Bouldin Creek, Barton Hills, Travis Heights
Areas 6, 7 78704 - Bouldin Creek, Barton Hills, Travis Heights
 
Area rn steiner, river place
Area rn   steiner, river placeArea rn   steiner, river place
Area rn steiner, river place
 
Plano TX - January 2011 - Housing Market Report
Plano TX - January 2011 - Housing Market ReportPlano TX - January 2011 - Housing Market Report
Plano TX - January 2011 - Housing Market Report
 

Destaque

How To Make A Great Pbj
How To Make A Great PbjHow To Make A Great Pbj
How To Make A Great Pbjguest73464
 
How To Make A Great Pbj
How To Make A Great PbjHow To Make A Great Pbj
How To Make A Great Pbjguest73464
 
City Eventions Marketing Capabilities
City Eventions Marketing CapabilitiesCity Eventions Marketing Capabilities
City Eventions Marketing CapabilitiesJoanna1324
 
How To Make A Great Pbj
How To Make A Great PbjHow To Make A Great Pbj
How To Make A Great Pbjguest73464
 

Destaque (6)

How To Make A Great Pbj
How To Make A Great PbjHow To Make A Great Pbj
How To Make A Great Pbj
 
How To Make A Great Pbj
How To Make A Great PbjHow To Make A Great Pbj
How To Make A Great Pbj
 
Central austin metrics
Central austin metricsCentral austin metrics
Central austin metrics
 
Westlake Metrics
Westlake MetricsWestlake Metrics
Westlake Metrics
 
City Eventions Marketing Capabilities
City Eventions Marketing CapabilitiesCity Eventions Marketing Capabilities
City Eventions Marketing Capabilities
 
How To Make A Great Pbj
How To Make A Great PbjHow To Make A Great Pbj
How To Make A Great Pbj
 

Semelhante a 2 n, scofield farms, gracy farms, quail creek, lamplight village metrics

Area sww village of western oaks, circle c
Area sww   village of western oaks, circle cArea sww   village of western oaks, circle c
Area sww village of western oaks, circle cTaylor Real Estate
 
Allen TX - Feb/March 2011 - Housing Market Report
Allen TX - Feb/March 2011 - Housing Market ReportAllen TX - Feb/March 2011 - Housing Market Report
Allen TX - Feb/March 2011 - Housing Market ReportValarie Littles
 
Frisco TX - Housing Market Report - November 2010
Frisco TX - Housing Market Report - November 2010Frisco TX - Housing Market Report - November 2010
Frisco TX - Housing Market Report - November 2010Valarie Littles
 
Rockwall TX - January 2011 - Housing Market Report
Rockwall TX - January 2011 - Housing Market ReportRockwall TX - January 2011 - Housing Market Report
Rockwall TX - January 2011 - Housing Market ReportValarie Littles
 
Richardson TX - Housing Market Report - November 2010
Richardson TX - Housing Market Report - November 2010Richardson TX - Housing Market Report - November 2010
Richardson TX - Housing Market Report - November 2010Valarie Littles
 
Rockwall TX - Housing Market Report - November 2010
Rockwall TX - Housing Market Report - November 2010Rockwall TX - Housing Market Report - November 2010
Rockwall TX - Housing Market Report - November 2010Valarie Littles
 
NW Hills, Highland Park Metrics
NW Hills, Highland Park MetricsNW Hills, Highland Park Metrics
NW Hills, Highland Park MetricsTaylor Real Estate
 

Semelhante a 2 n, scofield farms, gracy farms, quail creek, lamplight village metrics (10)

Area 5 east austin
Area 5   east austinArea 5   east austin
Area 5 east austin
 
Area sww village of western oaks, circle c
Area sww   village of western oaks, circle cArea sww   village of western oaks, circle c
Area sww village of western oaks, circle c
 
Condos Only
Condos OnlyCondos Only
Condos Only
 
Central Austin Metrics
Central Austin MetricsCentral Austin Metrics
Central Austin Metrics
 
Allen TX - Feb/March 2011 - Housing Market Report
Allen TX - Feb/March 2011 - Housing Market ReportAllen TX - Feb/March 2011 - Housing Market Report
Allen TX - Feb/March 2011 - Housing Market Report
 
Frisco TX - Housing Market Report - November 2010
Frisco TX - Housing Market Report - November 2010Frisco TX - Housing Market Report - November 2010
Frisco TX - Housing Market Report - November 2010
 
Rockwall TX - January 2011 - Housing Market Report
Rockwall TX - January 2011 - Housing Market ReportRockwall TX - January 2011 - Housing Market Report
Rockwall TX - January 2011 - Housing Market Report
 
Richardson TX - Housing Market Report - November 2010
Richardson TX - Housing Market Report - November 2010Richardson TX - Housing Market Report - November 2010
Richardson TX - Housing Market Report - November 2010
 
Rockwall TX - Housing Market Report - November 2010
Rockwall TX - Housing Market Report - November 2010Rockwall TX - Housing Market Report - November 2010
Rockwall TX - Housing Market Report - November 2010
 
NW Hills, Highland Park Metrics
NW Hills, Highland Park MetricsNW Hills, Highland Park Metrics
NW Hills, Highland Park Metrics
 

2 n, scofield farms, gracy farms, quail creek, lamplight village metrics

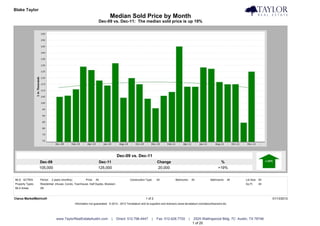
  • 1. Blake Taylor Taylor Real Estate Median Sold Price by Month Dec-09 vs. Dec-11: The median sold price is up 19% Dec-09 vs. Dec-11 Dec-09 Dec-11 Change % 105,000 125,000 20,000 +19% MLS: ACTRIS Period: 2 years (monthly) Price: All Construction Type: All Bedrooms: All Bathrooms: All Lot Size: All Property Types: Residential: (House, Condo, Townhouse, Half Duplex, Modular) Sq Ft: All MLS Areas: 2N Clarus MarketMetrics® 1 of 2 01/13/2012 Information not guaranteed. © 2012 - 2013 Terradatum and its suppliers and licensors (www.terradatum.com/about/licensors.td). www.TaylorRealEstateAustin.com | Direct: 512.796.4447 | Fax: 512.628.7720 | 2525 Wallingwood Bldg. 7C Austin, TX 78746 1 of 20
  • 2. Blake Taylor Taylor Real Estate Median Sold Price by Month Dec-09 vs. Dec-11: The median sold price is up 19% Time Period Median Price # Units Average DOM Dec-11 125,000 25 68 Nov-11 84,500 29 70 Oct-11 115,000 23 89 Sep-11 114,950 23 62 Aug-11 116,750 34 77 Jul-11 127,250 26 61 Jun-11 128,350 31 50 May-11 113,000 31 62 Apr-11 113,050 20 49 Mar-11 145,000 25 106 Feb-11 108,900 20 86 Jan-11 105,838 18 89 Dec-10 96,000 24 121 Nov-10 103,500 28 64 Oct-10 115,000 23 76 Sep-10 119,900 21 63 Aug-10 104,262 20 56 Jul-10 131,700 20 63 Jun-10 114,000 35 39 May-10 118,000 42 53 Apr-10 126,250 36 53 Mar-10 129,000 35 49 Feb-10 111,000 18 55 Jan-10 106,000 18 64 Dec-09 105,000 25 49 Clarus MarketMetrics® 2 of 2 01/13/2012 Information not guaranteed. © 2012 - 2013 Terradatum and its suppliers and licensors (www.terradatum.com/about/licensors.td). www.TaylorRealEstateAustin.com | Direct: 512.796.4447 | Fax: 512.628.7720 | 2525 Wallingwood Bldg. 7C Austin, TX 78746 2 of 20
  • 3. Blake Taylor Taylor Real Estate Median For Sale vs. Median Sold Dec-09 vs. Dec-11: The median price of for sale properties is down 7% and the median price of sold properties is up 19% Dec-09 vs. Dec-11 Dec-09 vs. Dec-11 Dec-09 Dec-11 Change % Dec-09 Dec-11 Change % 123,000 114,900 -8,100 -7% 105,000 125,000 20,000 +19% MLS: ACTRIS Period: 2 years (monthly) Price: All Construction Type: All Bedrooms: All Bathrooms: All Lot Size: All Property Types: Residential: (House, Condo, Townhouse, Half Duplex, Modular) Sq Ft: All MLS Areas: 2N Clarus MarketMetrics® 1 of 2 01/13/2012 Information not guaranteed. © 2012 - 2013 Terradatum and its suppliers and licensors (www.terradatum.com/about/licensors.td). www.TaylorRealEstateAustin.com | Direct: 512.796.4447 | Fax: 512.628.7720 | 2525 Wallingwood Bldg. 7C Austin, TX 78746 3 of 20
  • 4. Blake Taylor Taylor Real Estate Median For Sale vs. Median Sold Dec-09 vs. Dec-11: The median price of for sale properties is down 7% and the median price of sold properties is up 19% For Sale # Properties Sold # Properties Price Time Period Median For Sale Median Sold Difference Dec-11 114,900 133 125,000 25 10,100 Nov-11 117,500 159 84,500 29 -33,000 Oct-11 118,250 178 115,000 23 -3,250 Sep-11 122,000 191 114,950 23 -7,050 Aug-11 119,450 196 116,750 34 -2,700 Jul-11 129,000 201 127,250 26 -1,750 Jun-11 128,000 205 128,350 31 350 May-11 129,450 192 113,000 31 -16,450 Apr-11 126,998 187 113,050 20 -13,948 Mar-11 119,900 185 145,000 25 25,100 Feb-11 124,500 159 108,900 20 -15,600 Jan-11 124,500 179 105,838 18 -18,663 Dec-10 119,000 183 96,000 24 -23,000 Nov-10 120,000 187 103,500 28 -16,500 Oct-10 121,450 200 115,000 23 -6,450 Sep-10 121,900 213 119,900 21 -2,000 Aug-10 125,000 212 104,262 20 -20,738 Jul-10 130,000 199 131,700 20 1,700 Jun-10 130,000 195 114,000 35 -16,000 May-10 130,000 191 118,000 42 -12,000 Apr-10 129,900 224 126,250 36 -3,650 Mar-10 129,000 212 129,000 35 0 Feb-10 125,000 185 111,000 18 -14,000 Jan-10 124,414 169 106,000 18 -18,414 Dec-09 123,000 153 105,000 25 -18,000 Clarus MarketMetrics® 2 of 2 01/13/2012 Information not guaranteed. © 2012 - 2013 Terradatum and its suppliers and licensors (www.terradatum.com/about/licensors.td). www.TaylorRealEstateAustin.com | Direct: 512.796.4447 | Fax: 512.628.7720 | 2525 Wallingwood Bldg. 7C Austin, TX 78746 4 of 20
  • 5. Blake Taylor Taylor Real Estate Sold Properties by Month Dec-09 vs. Dec-11: The number of Sold properties has not changed Dec-09 vs. Dec-11 Dec-09 Dec-11 Change % 25 25 0 0% MLS: ACTRIS Period: 2 years (monthly) Price: All Construction Type: All Bedrooms: All Bathrooms: All Lot Size: All Property Types: Residential: (House, Condo, Townhouse, Half Duplex, Modular) Sq Ft: All MLS Areas: 2N Clarus MarketMetrics® 1 of 2 01/13/2012 Information not guaranteed. © 2012 - 2013 Terradatum and its suppliers and licensors (www.terradatum.com/about/licensors.td). www.TaylorRealEstateAustin.com | Direct: 512.796.4447 | Fax: 512.628.7720 | 2525 Wallingwood Bldg. 7C Austin, TX 78746 5 of 20
  • 6. Blake Taylor Taylor Real Estate Sold Properties by Month Dec-09 vs. Dec-11: The number of Sold properties has not changed Full Market Bank Properties Non-Bank Properties Time Period # Properties Median Price Average DOM # Properties % Bank Median Price # Properties % Non-Bank Median Price Dec-11 25 125,000 68 5 20.0 97,000 20 80.0 127,000 Nov-11 29 84,500 70 4 13.8 68,500 25 86.2 85,000 Oct-11 23 115,000 89 5 21.7 89,000 18 78.3 130,125 Sep-11 23 114,950 62 6 26.1 83,950 17 73.9 124,500 Aug-11 34 116,750 77 5 14.7 126,000 29 85.3 115,000 Jul-11 26 127,250 61 5 19.2 77,700 21 80.8 130,000 Jun-11 31 128,350 50 3 9.7 86,000 28 90.3 134,000 May-11 31 113,000 62 5 16.1 113,000 26 83.9 120,625 Apr-11 20 113,050 49 1 5.0 99,900 19 95.0 113,600 Mar-11 25 145,000 106 3 12.0 118,900 22 88.0 146,250 Feb-11 20 108,900 86 7 35.0 95,000 13 65.0 126,000 Jan-11 18 105,838 89 4 22.2 62,500 14 77.8 119,500 Dec-10 24 96,000 121 8 33.3 67,300 16 66.7 121,500 Nov-10 28 103,500 64 7 25.0 54,500 21 75.0 120,000 Oct-10 23 115,000 76 2 8.7 88,250 21 91.3 123,500 Sep-10 21 119,900 63 3 14.3 49,500 18 85.7 141,950 Aug-10 20 104,262 56 4 20.0 73,180 16 80.0 133,500 Jul-10 20 131,700 63 3 15.0 103,001 17 85.0 134,900 Jun-10 35 114,000 39 8 22.9 68,357 27 77.1 135,000 May-10 42 118,000 53 9 21.4 77,000 33 78.6 127,000 Apr-10 36 126,250 53 1 2.8 70,000 35 97.2 127,500 Mar-10 35 129,000 49 5 14.3 84,000 30 85.7 135,000 Feb-10 18 111,000 55 5 27.8 36,175 13 72.2 122,900 Jan-10 18 106,000 64 2 11.1 80,875 16 88.9 106,000 Dec-09 25 105,000 49 5 20.0 52,000 20 80.0 121,500 Clarus MarketMetrics® 2 of 2 01/13/2012 Information not guaranteed. © 2012 - 2013 Terradatum and its suppliers and licensors (www.terradatum.com/about/licensors.td). www.TaylorRealEstateAustin.com | Direct: 512.796.4447 | Fax: 512.628.7720 | 2525 Wallingwood Bldg. 7C Austin, TX 78746 6 of 20
  • 7. Blake Taylor Taylor Real Estate Under Contract Properties by Month Dec-09 vs. Dec-11: The number of Under Contract properties is up 5% Dec-09 vs. Dec-11 Dec-09 Dec-11 Change % 22 23 1 +5% MLS: ACTRIS Period: 2 years (monthly) Price: All Construction Type: All Bedrooms: All Bathrooms: All Lot Size: All Property Types: Residential: (House, Condo, Townhouse, Half Duplex, Modular) Sq Ft: All MLS Areas: 2N Clarus MarketMetrics® 1 of 2 01/13/2012 Information not guaranteed. © 2012 - 2013 Terradatum and its suppliers and licensors (www.terradatum.com/about/licensors.td). www.TaylorRealEstateAustin.com | Direct: 512.796.4447 | Fax: 512.628.7720 | 2525 Wallingwood Bldg. 7C Austin, TX 78746 7 of 20
  • 8. Blake Taylor Taylor Real Estate Under Contract Properties by Month Dec-09 vs. Dec-11: The number of Under Contract properties is up 5% Full Market Bank Properties Non-Bank Properties Time Period # Properties Median Price Average DOM # Properties % Bank Median Price # Properties % Non-Bank Median Price Dec-11 23 121,200 70 7 30.4 97,500 16 69.6 132,495 Nov-11 29 109,900 82 4 13.8 104,900 25 86.2 114,998 Oct-11 26 123,700 85 4 15.4 80,000 22 84.6 129,700 Sep-11 23 111,500 93 5 21.7 88,000 18 78.3 130,950 Aug-11 26 99,921 67 6 23.1 86,450 20 76.9 111,500 Jul-11 37 129,900 77 9 24.3 122,399 28 75.7 137,450 Jun-11 26 147,200 63 1 3.9 116,910 25 96.2 154,500 May-11 24 119,900 55 3 12.5 86,000 21 87.5 126,000 Apr-11 32 138,550 42 2 6.2 68,550 30 93.8 142,500 Mar-11 23 137,800 87 4 17.4 134,900 19 82.6 137,800 Feb-11 19 145,000 90 1 5.3 39,900 18 94.7 147,450 Jan-11 26 124,450 76 10 38.5 92,400 16 61.5 146,000 Dec-10 25 95,000 112 8 32.0 64,900 17 68.0 114,714 Nov-10 16 104,450 104 5 31.2 69,900 11 68.8 147,900 Oct-10 26 122,200 66 3 11.5 79,900 23 88.5 129,900 Sep-10 24 117,450 75 5 20.8 61,900 19 79.2 119,999 Aug-10 23 129,000 64 4 17.4 85,900 19 82.6 139,900 Jul-10 19 132,900 59 3 15.8 34,900 16 84.2 136,950 Jun-10 20 109,900 60 3 15.0 79,900 17 85.0 139,000 May-10 18 109,950 38 7 38.9 72,270 11 61.1 149,500 Apr-10 50 128,000 46 5 10.0 49,995 45 90.0 130,900 Mar-10 50 129,900 46 6 12.0 86,350 44 88.0 137,450 Feb-10 27 129,900 61 5 18.5 105,000 22 81.5 134,500 Jan-10 23 118,000 75 4 17.4 59,250 19 82.6 119,900 Dec-09 22 103,395 43 4 18.2 51,308 18 81.8 112,498 Clarus MarketMetrics® 2 of 2 01/13/2012 Information not guaranteed. © 2012 - 2013 Terradatum and its suppliers and licensors (www.terradatum.com/about/licensors.td). www.TaylorRealEstateAustin.com | Direct: 512.796.4447 | Fax: 512.628.7720 | 2525 Wallingwood Bldg. 7C Austin, TX 78746 8 of 20
  • 9. Blake Taylor Taylor Real Estate New Properties by Month Dec-09 vs. Dec-11: The number of New properties is down 28% Dec-09 vs. Dec-11 Dec-09 Dec-11 Change % 25 18 -7 -28% MLS: ACTRIS Period: 2 years (monthly) Price: All Construction Type: All Bedrooms: All Bathrooms: All Lot Size: All Property Types: Residential: (House, Condo, Townhouse, Half Duplex, Modular) Sq Ft: All MLS Areas: 2N Clarus MarketMetrics® 1 of 2 01/13/2012 Information not guaranteed. © 2012 - 2013 Terradatum and its suppliers and licensors (www.terradatum.com/about/licensors.td). www.TaylorRealEstateAustin.com | Direct: 512.796.4447 | Fax: 512.628.7720 | 2525 Wallingwood Bldg. 7C Austin, TX 78746 9 of 20
  • 10. Blake Taylor Taylor Real Estate New Properties by Month Dec-09 vs. Dec-11: The number of New properties is down 28% Full Market Bank Properties Non-Bank Properties Time Period # Properties Median Price # Properties % Bank Median Price # Properties % Non-Bank Median Price Dec-11 18 96,400 5 27.8 44,959 13 72.2 109,900 Nov-11 40 109,250 8 20.0 87,700 32 80.0 120,550 Oct-11 30 110,250 4 13.3 105,700 26 86.7 110,500 Sep-11 33 119,900 2 6.1 81,250 31 93.9 121,500 Aug-11 44 116,000 3 6.8 99,000 41 93.2 117,500 Jul-11 44 129,900 8 18.2 96,250 36 81.8 158,450 Jun-11 53 128,000 11 20.8 85,500 42 79.2 139,500 May-11 47 139,900 3 6.4 119,000 44 93.6 139,900 Apr-11 46 134,750 6 13.0 107,950 40 87.0 139,900 Mar-11 53 114,000 3 5.7 105,000 50 94.3 114,500 Feb-11 27 129,000 0 27 100.0 129,000 Jan-11 43 118,000 7 16.3 116,910 36 83.7 122,750 Dec-10 30 114,500 7 23.3 99,900 23 76.7 119,000 Nov-10 37 112,000 7 18.9 74,900 30 81.1 121,450 Oct-10 30 114,400 6 20.0 78,575 24 80.0 126,200 Sep-10 43 119,500 10 23.3 102,450 33 76.7 129,900 Aug-10 51 114,714 8 15.7 65,900 43 84.3 118,900 Jul-10 46 116,400 7 15.2 89,900 39 84.8 129,900 Jun-10 45 134,900 7 15.6 99,900 38 84.4 138,500 May-10 45 130,000 7 15.6 85,300 38 84.4 132,450 Apr-10 73 137,900 8 11.0 61,132 65 89.0 144,900 Mar-10 62 135,200 3 4.8 79,900 59 95.2 135,900 Feb-10 47 134,900 8 17.0 78,500 39 83.0 149,000 Jan-10 60 132,700 1 1.7 132,500 59 98.3 132,900 Dec-09 25 115,000 5 20.0 52,717 20 80.0 116,950 Clarus MarketMetrics® 2 of 2 01/13/2012 Information not guaranteed. © 2012 - 2013 Terradatum and its suppliers and licensors (www.terradatum.com/about/licensors.td). www.TaylorRealEstateAustin.com | Direct: 512.796.4447 | Fax: 512.628.7720 | 2525 Wallingwood Bldg. 7C Austin, TX 78746 10 of 20
  • 11. Blake Taylor Taylor Real Estate For Sale Properties by Month Dec-09 vs. Dec-11: The number of For Sale properties is down 13% Dec-09 vs. Dec-11 Dec-09 Dec-11 Change % 153 133 -20 -13% MLS: ACTRIS Period: 2 years (monthly) Price: All Construction Type: All Bedrooms: All Bathrooms: All Lot Size: All Property Types: Residential: (House, Condo, Townhouse, Half Duplex, Modular) Sq Ft: All MLS Areas: 2N Clarus MarketMetrics® 1 of 2 01/13/2012 Information not guaranteed. © 2012 - 2013 Terradatum and its suppliers and licensors (www.terradatum.com/about/licensors.td). www.TaylorRealEstateAustin.com | Direct: 512.796.4447 | Fax: 512.628.7720 | 2525 Wallingwood Bldg. 7C Austin, TX 78746 11 of 20
  • 12. Blake Taylor Taylor Real Estate For Sale Properties by Month Dec-09 vs. Dec-11: The number of For Sale properties is down 13% Full Market Bank Properties Non-Bank Properties Time Period # Properties Median Price Average DOM # Properties % Bank Median Price # Properties % Non-Bank Median Price Dec-11 133 114,900 141 21 15.8 89,900 112 84.2 119,450 Nov-11 159 117,500 126 20 12.6 98,250 139 87.4 122,000 Oct-11 178 118,250 129 16 9.0 98,250 162 91.0 123,775 Sep-11 191 122,000 125 17 8.9 94,900 174 91.1 127,500 Aug-11 196 119,450 117 23 11.7 94,900 173 88.3 128,000 Jul-11 201 129,000 111 29 14.4 97,600 172 85.6 133,000 Jun-11 205 128,000 118 25 12.2 105,000 180 87.8 129,900 May-11 192 129,450 120 18 9.4 119,450 174 90.6 129,900 Apr-11 187 126,998 119 17 9.1 116,910 170 90.9 128,000 Mar-11 185 119,900 126 17 9.2 116,910 168 90.8 124,575 Feb-11 159 124,500 138 15 9.4 116,910 144 90.6 124,825 Jan-11 179 124,500 127 26 14.5 109,700 153 85.5 125,000 Dec-10 183 119,000 135 28 15.3 94,500 155 84.7 121,900 Nov-10 187 120,000 130 26 13.9 82,950 161 86.1 125,000 Oct-10 200 121,450 123 25 12.5 84,900 175 87.5 125,000 Sep-10 213 121,900 112 25 11.7 85,300 188 88.3 125,000 Aug-10 212 125,000 104 19 9.0 84,900 193 91.0 129,900 Jul-10 199 130,000 98 17 8.5 99,900 182 91.5 134,950 Jun-10 195 130,000 110 16 8.2 99,900 179 91.8 134,900 May-10 191 130,000 107 16 8.4 84,478 175 91.6 134,900 Apr-10 224 129,900 106 17 7.6 79,900 207 92.4 134,900 Mar-10 212 129,000 112 15 7.1 89,900 197 92.9 130,000 Feb-10 185 125,000 115 17 9.2 99,900 168 90.8 129,900 Jan-10 169 124,414 116 14 8.3 102,450 155 91.7 125,000 Dec-09 153 123,000 131 18 11.8 87,775 135 88.2 125,000 Clarus MarketMetrics® 2 of 2 01/13/2012 Information not guaranteed. © 2012 - 2013 Terradatum and its suppliers and licensors (www.terradatum.com/about/licensors.td). www.TaylorRealEstateAustin.com | Direct: 512.796.4447 | Fax: 512.628.7720 | 2525 Wallingwood Bldg. 7C Austin, TX 78746 12 of 20
  • 13. Blake Taylor Taylor Real Estate Expired Properties by Month Dec-09 vs. Dec-11: The number of Expired properties is up 23% Dec-09 vs. Dec-11 Dec-09 Dec-11 Change % 22 27 5 +23% MLS: ACTRIS Period: 2 years (monthly) Price: All Construction Type: All Bedrooms: All Bathrooms: All Lot Size: All Property Types: Residential: (House, Condo, Townhouse, Half Duplex, Modular) Sq Ft: All MLS Areas: 2N Clarus MarketMetrics® 1 of 2 01/13/2012 Information not guaranteed. © 2012 - 2013 Terradatum and its suppliers and licensors (www.terradatum.com/about/licensors.td). www.TaylorRealEstateAustin.com | Direct: 512.796.4447 | Fax: 512.628.7720 | 2525 Wallingwood Bldg. 7C Austin, TX 78746 13 of 20
  • 14. Blake Taylor Taylor Real Estate Expired Properties by Month Dec-09 vs. Dec-11: The number of Expired properties is up 23% Full Market Bank Properties Non-Bank Properties Time Period # Properties Median Price Average DOM # Properties % Bank Median Price # Properties % Non-Bank Median Price Dec-11 27 110,500 235 4 14.8 42,930 23 85.2 114,900 Nov-11 15 125,990 124 0 15 100.0 125,990 Oct-11 33 109,900 119 0 33 100.0 109,900 Sep-11 20 129,000 130 0 20 100.0 129,000 Aug-11 12 152,000 102 2 16.7 199,999 10 83.3 152,000 Jul-11 12 147,450 112 0 12 100.0 147,450 Jun-11 22 122,500 222 3 13.6 279,900 19 86.4 117,900 May-11 16 144,450 129 1 6.2 129,900 15 93.8 149,900 Apr-11 10 122,450 220 0 10 100.0 122,450 Mar-11 21 109,900 150 2 9.5 105,286 19 90.5 112,000 Feb-11 8 110,250 144 0 8 100.0 110,250 Jan-11 21 144,900 111 1 4.8 154,900 20 95.2 144,400 Dec-10 22 116,450 149 1 4.5 99,900 21 95.5 118,000 Nov-10 18 139,872 136 0 18 100.0 139,872 Oct-10 24 121,450 116 3 12.5 105,000 21 87.5 125,000 Sep-10 19 119,900 123 1 5.3 85,300 18 94.7 126,200 Aug-10 19 148,900 80 0 19 100.0 148,900 Jul-10 19 135,500 77 3 15.8 99,900 16 84.2 141,450 Jun-10 22 129,500 172 3 13.6 279,900 19 86.4 129,000 May-10 23 135,000 113 0 23 100.0 135,000 Apr-10 28 117,450 125 3 10.7 123,000 25 89.3 115,900 Mar-10 11 149,900 150 0 11 100.0 149,900 Feb-10 8 134,900 74 0 8 100.0 134,900 Jan-10 8 139,750 72 1 12.5 80,000 7 87.5 159,500 Dec-09 22 144,950 136 1 4.5 199,900 21 95.5 144,900 Clarus MarketMetrics® 2 of 2 01/13/2012 Information not guaranteed. © 2012 - 2013 Terradatum and its suppliers and licensors (www.terradatum.com/about/licensors.td). www.TaylorRealEstateAustin.com | Direct: 512.796.4447 | Fax: 512.628.7720 | 2525 Wallingwood Bldg. 7C Austin, TX 78746 14 of 20
  • 15. Blake Taylor Taylor Real Estate Supply & Demand by Month Dec-09 vs. Dec-11: The number of for sale properties is down 13% and the number of sold properties has not changed Dec-09 vs. Dec-11 Dec-09 vs. Dec-11 Dec-09 Dec-11 Change % Dec-09 Dec-11 Change % 153 133 -20 -13% 25 25 0 0% MLS: ACTRIS Period: 2 years (monthly) Price: All Construction Type: All Bedrooms: All Bathrooms: All Lot Size: All Property Types: Residential: (House, Condo, Townhouse, Half Duplex, Modular) Sq Ft: All MLS Areas: 2N Clarus MarketMetrics® 1 of 2 01/13/2012 Information not guaranteed. © 2012 - 2013 Terradatum and its suppliers and licensors (www.terradatum.com/about/licensors.td). www.TaylorRealEstateAustin.com | Direct: 512.796.4447 | Fax: 512.628.7720 | 2525 Wallingwood Bldg. 7C Austin, TX 78746 15 of 20
  • 16. Blake Taylor Taylor Real Estate Supply & Demand by Month Dec-09 vs. Dec-11: The number of for sale properties is down 13% and the number of sold properties has not changed # Properties Average DOM # Properties Average DOM Time Period For Sale For Sale Sold Sold Dec-11 133 141 25 68 Nov-11 159 126 29 70 Oct-11 178 129 23 89 Sep-11 191 125 23 62 Aug-11 196 117 34 77 Jul-11 201 111 26 61 Jun-11 205 118 31 50 May-11 192 120 31 62 Apr-11 187 119 20 49 Mar-11 185 126 25 106 Feb-11 159 138 20 86 Jan-11 179 127 18 89 Dec-10 183 135 24 121 Nov-10 187 130 28 64 Oct-10 200 123 23 76 Sep-10 213 112 21 63 Aug-10 212 104 20 56 Jul-10 199 98 20 63 Jun-10 195 110 35 39 May-10 191 107 42 53 Apr-10 224 106 36 53 Mar-10 212 112 35 49 Feb-10 185 115 18 55 Jan-10 169 116 18 64 Dec-09 153 131 25 49 Clarus MarketMetrics® 2 of 2 01/13/2012 Information not guaranteed. © 2012 - 2013 Terradatum and its suppliers and licensors (www.terradatum.com/about/licensors.td). www.TaylorRealEstateAustin.com | Direct: 512.796.4447 | Fax: 512.628.7720 | 2525 Wallingwood Bldg. 7C Austin, TX 78746 16 of 20
  • 17. Blake Taylor Taylor Real Estate The Average Days on Market by Month Dec-09 vs. Dec-11: The average days on market is up 62% Dec-09 vs. Dec-11 Dec-09 Dec-11 Change % 43 70 27 +62% MLS: ACTRIS Period: 2 years (monthly) Price: All Construction Type: All Bedrooms: All Bathrooms: All Lot Size: All Property Types: Residential: (House, Condo, Townhouse, Half Duplex, Modular) Sq Ft: All MLS Areas: 2N Clarus MarketMetrics® 1 of 2 01/13/2012 Information not guaranteed. © 2012 - 2013 Terradatum and its suppliers and licensors (www.terradatum.com/about/licensors.td). www.TaylorRealEstateAustin.com | Direct: 512.796.4447 | Fax: 512.628.7720 | 2525 Wallingwood Bldg. 7C Austin, TX 78746 17 of 20
  • 18. Blake Taylor Taylor Real Estate The Average Days on Market by Month Dec-09 vs. Dec-11: The average days on market is up 62% Time Period Average DOM # UC Units Dec-11 70 23 Nov-11 82 29 Oct-11 85 26 Sep-11 93 23 Aug-11 67 26 Jul-11 77 37 Jun-11 63 26 May-11 55 24 Apr-11 42 32 Mar-11 87 23 Feb-11 90 19 Jan-11 76 26 Dec-10 112 25 Nov-10 104 16 Oct-10 66 26 Sep-10 75 24 Aug-10 64 23 Jul-10 59 19 Jun-10 60 20 May-10 38 18 Apr-10 46 50 Mar-10 46 50 Feb-10 61 27 Jan-10 75 23 Dec-09 43 22 Clarus MarketMetrics® 2 of 2 01/13/2012 Information not guaranteed. © 2012 - 2013 Terradatum and its suppliers and licensors (www.terradatum.com/about/licensors.td). www.TaylorRealEstateAustin.com | Direct: 512.796.4447 | Fax: 512.628.7720 | 2525 Wallingwood Bldg. 7C Austin, TX 78746 18 of 20
  • 19. Blake Taylor Taylor Real Estate Months Supply of Inventory Dec-09 vs. Dec-11: The average months supply of inventory is down 27% Dec-09 vs. Dec-11 Dec-09 Dec-11 Change % 5.0 3.6 -1.3 -27% MLS: ACTRIS Period: 2 years (monthly) Price: All Construction Type: All Bedrooms: All Bathrooms: All Lot Size: All Property Types: Residential: (House, Condo, Townhouse, Half Duplex, Modular) Sq Ft: All MLS Areas: 2N Clarus MarketMetrics® 1 of 2 01/13/2012 Information not guaranteed. © 2012 - 2013 Terradatum and its suppliers and licensors (www.terradatum.com/about/licensors.td). www.TaylorRealEstateAustin.com | Direct: 512.796.4447 | Fax: 512.628.7720 | 2525 Wallingwood Bldg. 7C Austin, TX 78746 19 of 20
  • 20. Blake Taylor Taylor Real Estate Months Supply of Inventory Dec-09 vs. Dec-11: The average months supply of inventory is down 27% # Units For Sale # UC Units UC Average Time Period Last Day of Month During Month MSI DOM Dec-11 83 23 3.6 70 Nov-11 115 29 4.0 82 Oct-11 119 26 4.6 85 Sep-11 148 23 6.4 93 Aug-11 158 26 6.1 67 Jul-11 152 37 4.1 77 Jun-11 157 26 6.0 63 May-11 152 24 6.3 55 Apr-11 145 32 4.5 42 Mar-11 141 23 6.1 87 Feb-11 132 19 6.9 90 Jan-11 132 26 5.1 76 Dec-10 136 25 5.4 112 Nov-10 153 16 9.6 104 Oct-10 150 26 5.8 66 Sep-10 170 24 7.1 75 Aug-10 170 23 7.4 64 Jul-10 161 19 8.5 59 Jun-10 153 20 7.7 60 May-10 150 18 8.3 38 Apr-10 146 50 2.9 46 Mar-10 151 50 3.0 46 Feb-10 150 27 5.6 61 Jan-10 138 23 6.0 75 Dec-09 109 22 5.0 43 Clarus MarketMetrics® 2 of 2 01/13/2012 Information not guaranteed. © 2012 - 2013 Terradatum and its suppliers and licensors (www.terradatum.com/about/licensors.td). www.TaylorRealEstateAustin.com | Direct: 512.796.4447 | Fax: 512.628.7720 | 2525 Wallingwood Bldg. 7C Austin, TX 78746 20 of 20