One Page Budget Breakdown Summary Presentation Report Infographic Ppt Pdf Document

Here we present One Page Budget Breakdown Summary Presentation Report Infographic PPT PDF Document one pager PowerPoint template. The primary objective behind running a business is to make profits, which is partially possible when close watch is kept upon the budget, more specifically the revenue made and expenditure incurred, which is now made achievable by our one page budget breakdown summary template. By making our ready made budget summary PPT template a core part of your business, you will be able to make sure that your expenditures does not overpower your revenues as also your firm sticks around with the decided budget. This amazing budget summary PPT template includes data pertaining to budget breakdown summary of a particular region with projected expenditure and revenue generation in the region. If you need to make any changes to this template, you can surely do so as it offers complete freedom of edits. Grab this One Page Budget Breakdown Summary Presentation Report Infographic PPT PDF Document one pager template now. https://bit.ly/3xmVHDB

Recommended
Recommended
More Related Content
What's hot
What's hot (20)
Similar to One Page Budget Breakdown Summary Presentation Report Infographic Ppt Pdf Document
Similar to One Page Budget Breakdown Summary Presentation Report Infographic Ppt Pdf Document (20)
More from SlideTeam
More from SlideTeam (20)
Recently uploaded
Recently uploaded (20)
One Page Budget Breakdown Summary Presentation Report Infographic Ppt Pdf Document
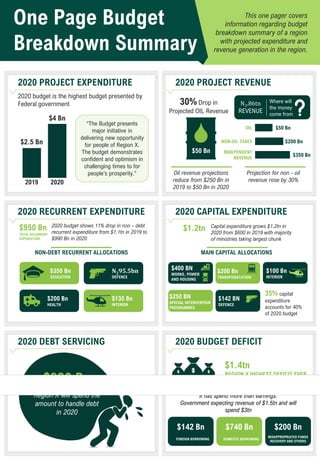
- 1. One Page Budget Breakdown Summary This one pager covers information regarding budget breakdown summary of a region with projected expenditure and revenue generation in the region. 2020 budget is the highest budget presented by Federal government 2020 PROJECT EXPENDITURE “The Budget presents major initiative in delivering new opportunity for people of Region X. The budget demonstrates confident and optimism in challenging times to for people’s prosperity.” $2.5 Bn 2019 $4 Bn 2020 2020 PROJECT REVENUE 30% Drop in Projected OIL Revenue $50 Bn Oil revenue projections reduce from $250 Bn in 2019 to $50 Bn in 2020 Projection for non - oil revenue rose by 30% N3.86tn REVENUE Where will the money come from $350 Bn $200 Bn $50 Bn OIL NON-OIL TAXES INDEPENDENT REVENUE 2020 RECURRENT EXPENDITURE $950 Bn TOTAL RECURRENT EXPENDITURE 2020 budget shows 11% drop in non – debt recurrent expenditure from $1.1tn in 2019 to $990 Bn in 2020 $350 Bn EDUCATION $135 Bn INTERIOR $200 Bn HEALTH N295.5bn DEFENCE NON-DEBT RECURRENT ALLOCATIONS 2020 CAPITAL EXPENDITURE $1.2tn Capital expenditure grows $1.2tn in 2020 from $600 in 2019 with majority of ministries taking largest chunk MAIN CAPITAL ALLOCATIONS 35% capital expenditure accounts for 40% of 2020 budget $142 BN DEFENCE $250 BN SPECIAL INTERVENTION PROGRAMMES $400 BN WORKS, POWER AND HOUSING $200 Bn TRANSPORATATION $100 Bn INTERIOR $990 Bn Region X will spend the amount to handle debt in 2020 2020 DEBT SERVICING $142 Bn $740 Bn $200 Bn $1.4tn REGION X HIGHEST DEFICIT EVER Region X will face deficit budget which means that it has spend more than earnings. Government expecting revenue of $1.5tn and will spend $3tn FOREIGN BORROWING DOMESTIC BORROWING MISAPPROPRIATED FUNDS RECOVERY AND OTHERS 2020 BUDGET DEFICIT
- 2. Instructions to Edit This Page Edit Data & Statistics Edit any Text Customize any Color Edit Data & Statistics Edit any Image Select & Replace any Icons 2. 1. 3. These icons are available at the Icons section on www.slideteam.net This entire One Pager is 100% editable in PowerPoint All Charts are DATA DRIVEN – right click and edit DATA