Engaging Visitors in Innovative Ways: Process, Data and Participation
•
3 gostaram•3,159 visualizações

Learn about the Indianapolis Museum of Art visitor-centered approach.

Recomendados
Recomendados
Mais conteúdo relacionado
Semelhante a Engaging Visitors in Innovative Ways: Process, Data and Participation
Semelhante a Engaging Visitors in Innovative Ways: Process, Data and Participation (20)
Último
Último (20)
Engaging Visitors in Innovative Ways: Process, Data and Participation
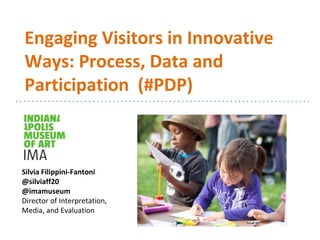
- 1. Engaging Visitors in Innovative Ways: Process, Data and Participation (#PDP) Silvia Filippini-Fantoni @silviaff20 @imamuseum Director of Interpretation, Media, and Evaluation
- 5. Process: • New exhibition development process Data: • Research and evaluation Participation: • Participatory in-gallery experiences • Innovative programming Visitor-oriented approach: #PDP
- 6. Process: New Exhibition Development Model
- 7. • Interdisciplinary core team is created at the start: curator, an interpretation specialist, an evaluator, a designer, and an exhibition manager • Big idea: identification of the main thesis and learning outcomes to inform checklist, layout, interpretive plan, content, title, etc.
- 8. Before
- 9. After
- 10. HIGHER VISITORS’ SATISFACTION BETTER COMMUNICATION OF KEY MESSAGES BETTER INTEGRATION OF INTERPRETIVE TOOLS 40-60% 60% 30-50% 30-50%
- 11. Data: Collecting Visitors’ Feedback
- 12. Methods
- 13. n=576 21% 21% 27% 31% 0% 5% 10% 15% 20% 25% 30% 35% Art Deco Automobiles Duesenbergs Automobile Masterpieces Concept Cars Front-End: Automobile Design
- 14. Visitors’ interests: • Artist’s life (30/40) • Inspiration (30/40) • Process/technique (26/40) • Artist’s or other’s explanation about the meaning behind the work (7/40) Formative: Robert Indiana
- 18. Visual Identity Testing Option 1 Option 2 Option 3
- 19. Summative: Exhibition Evaluations • Have learning outcomes been met? • Are visitors satisfied with their experience? • How do they engage with the art and interpretive tools? • What problems do visitors encounter? • Who visited the exhibition (demographics & psychographics)?
- 20. Participation: In Gallery & Programming
- 26. • 3,922: # of drawings submitted • 30,709: online visits •3% of drawings with comments •1,457 votes: Most popular drawing •Visitors responded to patterns, colors, shape and compositions seen in exhibition Key Results
- 27. • 2,655 drawings left behind • 23% of exhibition visitors made a drawing • 77% inspired by the display • 11% inspired by exhibition • 75% of visitors looked at the drawings Draw a Still Life
- 33. • 3,706: # of autoportraits made • 40% of exhibition visitors created an autoportrait • 51% of exhibition visitors looked at other visitors’ autoportraits •Reinforced the understand that words, numbers, forms, and colors symbolize specific events in Indiana’s life Key Results
- 35. • 71% of exhibition visitors were with other people • 59% of exhibition visitors 45+ used the app • 61% of exhibition visitors used the app • 400+ positive comments “fun”, “engaging”,“easy” Key Results
- 36. Scott Stulen @middlewest @imamuseum Curator of Audience Experiences and Performance Innovative Programming
- 37. Stuart Hyatt: E is for Equinox
- 39. B-movie Bingo
- 40. • Increasing # of facilitators (who visit to engage in a social experience) •Increased exhibition attendance (44,000 in 2013 vs. 81,000 in 2014) •Increased # of members •Change of perception: visitors have responded positively to the museum willingness to engage people in different ways.