1. Jeanette Schwarz Young, CFP®
, CMT, M.S.
Jordan Young, CMT
83 Highwood Terrace
Weehawken, New Jersey 07086
www.OptnQueen.com
January 18, 2015
The Option Queen Letter
By the Option Royals
The Swiss National Bank, on Thursday, allowed the Swiss franc to freely float in the market. It
will no longer be pegged to the euro at 1.20. Remember, this peg was put into place because the
Swiss franc rallied so much that their ability to export was almost wiped out. Thus to help
industry, the Swiss National Bank (SNB) decided to peg their franc to the euro which, did
achieve their goal. This was a much more clever decision that trying to intervene in the currency
market to hold the value of the Swiss franc down, which, in the long run never works anyway.
The franc rallied on the un-peg in the Thursday session and the Swiss market fell. That is the
main overview; the fallout from this action is a disruption of the currency market to such an
extent that some firms may be put out of business. As this week progresses we will begin to see
some of the victims of this action by the SNB. The SNB also increased their charges on deposits
making it more expensive to hold money in a Swiss banks located in Switzerland. The reaction
to this will likely be a migration of funds out of Switzerland to our shores and other places where
the interest rates are not negative. Naturally, gold rallies on any currency disruptions.
What does negative interest rate mean? Yes we hear about it but how many people really
understand it? Negative interest rates are created when you charge an account a fee to deposit
money. Say you put 1000 dollars in a savings account. The bank, in Switzerland is charging you
to hold your money. That charge today is 0.75% of the assets deposited. If that were to happen
here in the USA, the banks would charge depositors a fixed amount based on the deposit made.
Further erosion of the assets are felt by any increases in inflation thus, the return is even more
negative. So why would a bank do this? There are two obvious reasons: one is clearly more
income for the bank and the second is to usher those deposits back into the economy, probably
through a bank vehicle. The velocity of money theory fails badly when money is hoarded in
savings accounts and banks enforce tight money lending policies. Just think about the
consequences.
Our suggestions for this week are to fasten your seatbelt and stay alert. We do believe the some
of the money from Switzerland will be actively engaged in our markets. As to Europe, we are
getting interested in investments in that area.
The S&P rallied 25 handles (points) in the option expiration Friday session. The 5-period
exponential moving average is 2009.58. The top of the Bollinger Band is 2106.18 and the lower
edge is seen at 1980.74. The volume was good in the Friday session, not quite as high as seen in
the Wednesday and Thursday session but quite respectable. Was this surge in the Friday volume
due to options expiration and short covering? That probably had a lot to do with the increased
2. volume. The indicators are all pointing higher and although the market did print a lower low for
the week and a lower high, the action of the market was very positive. Remember also that when
a market retreats for five session, the probability of a rally increases with every day and thus by
the fifth day you can expect to see a reversal of direction. The daily chart of the S&P 500 is
inside the Ichimoku Clouds, but the weekly and the monthly charts are above the clouds. Our
line in the sand remains at 1960.75 below which, we will see the market spill to the downside.
The short-term downtrend line is 2019.12. The downward trending channel lines are 2044.04
and 1954.61; these channel lines are valid not only for the daily chart but also for the weekly
chart. The most frequently traded price in the Friday session was 1978. There is lots of
overhead supply for this index so expect to see a fair amount of selling on rallies. The daily 1%
by 3-box daily point and figure chart continues to look positive, although we could violate an
internal uptrend line on any decent retreat. The 60 minute 0.1% by 3-box chart is also positive.
With regard to this index, we will see some gyrations as the fallout from the SNB’s action to
allow the franc to float free causes some chaos in firms that trade currencies. The chaos in crude
oil continues to weigh on some of the stocks in the index as well. Volatility is returning to the
market which is a good thing for option buyers and sellers but for the average investor will
probably cause some sleepless and anxious moments.
3.
4.
5.
6. The NASDAQ 100 remains solidly in its downtrend. The Friday session had a bulge in volume
but failed to make a higher high on the day. The market rallied 1.21% on the day but not as
much as the S&P 500 which rallied 1.26%. The 5-period exponential moving average is
4136.10. The top of the Bollinger Band is 4358.84 and the lower edge is seen at 4071.50. Both
the stochastic indicator and the RSI have turned to the upside. We traded below the line in the
sand at 4079.75 but reversed on the Friday session and closed far above that line. Remember the
rule, we need to see a violation for two days before we really believe in the action. The
downtrend line is 4156.06 and the down trending channel lines are 420017 and 4004.61. The
NASDAQ 100 is inside the Ichimoku Clouds for the daily time-frame but remains above the
clouds for both the weekly and the monthly time-frames. The most frequently traded price in the
Friday session was 4053.75. The daily 1% by 3-box point and figure chart has a pair of internal
downtrend lines which are concerning. We also have a downside target of 3710.69. The 60
minute 0.1% by 3-box chart is positive. We do put more weight in the shorter chart but this
highlights some of the confusion in the market.
7.
8.
9.
10. The Russell 2000 rallied 1.8% in the Friday session winning the award as the best performing
index in the world of indices that we report on in these notes. The 21.10 handle (point) rally was
on decent volume; still the downside volume was greater in the Thursday session. This index
has been all over the lot, up one day, down two days, and then up on Friday. The stochastic
indicator, our own indicator and the RSI are now pointing higher. The 5-period exponential
moving average is 1169.03. The top of the Bollinger Band is 1223.93 and the lower edge is seen
at 1151.47. The short-term downtrend line is 1180.97. The line in the sand is 1127.80 below
which, this index will slide (remember the two-day rule). The most frequently traded price in the
Friday session was 1143.00. There is a lot of overhead supply so advances will be difficult as
those long at higher levels seek to get out of their positions. The point and figure chart is
positive on this index. There will be less pressure seen on this index because of its
configuration.
11.
12. Crude Oil rallied in the Friday session adding 2.18 handles (points) on the day on somewhat
lighter volume than was seen earlier in the week. It appears that this product is trying to find a
bottom or support. Will it work? We are not sure, we have numbers at 41 plus or minus 2 and
below that at 32.40 area. We are below the Ichimoku Clouds for all time-frames. All the
indicators that we follow herein are pointing higher bouncing away from the oversold levels.
The 5-period exponential moving average is 48.12. The top of the Bollinger Band is 59.56 and
the lower edge is at 44.24. The most frequently traded price, in the Friday session, was 47-
47.30. As this product rallies expect to see sellers trying to get out of their positions. The
shorts will begin to feel uncomfortable should the market trade above 51.01, the downtrend line
and certainly at 52.97 by 58.97 they will be in full short-covering mode would could push the
product higher. On the downside, it gets really scary below 44.64, where the shorts will press
their positions. The 60 minute 0.2% by 3-box chart has an upside target of 51.32 but shows a
market below the downtrend line, at the moment. The daily 1% by 3-box chart confused. We
have a downside target of 37.78 and pair of internal uptrend lines but lots of internal downtrend
lines are on this chart. We recommend standing aside and waiting to see if the low will be
removed before nibbling on this product.
13.
14.
15.
16. Gold rallied in the Friday session ending the week at 1280.03 above the high of the Thursday
session on heavy volume. All of the indicators that we follow herein continue to point higher.
The 5-period exponential moving average is 1251.84. The top of the Bollinger Band is 1264.41
and the lower edge is seen at 1153.73. We are above the Ichimoku Clouds for the daily time-
frame but remain below the clouds for both the weekly and the monthly time-frames. Should
this market retreat there will be support at 1238.9, 1203.6 1160.80 and at 1127.80, below which
look out below. On the upside, 1297.80, 1325, and 1343.10 will contain the rally. The upward
trending channel lines are 1175.62 and 1267.06. Notice we broke above the upper channel line as
well as above the upper Bollinger Band which would indicate to us that either the market will
establish a new channel (not so likely) or that the market will back and fill returning inside the
Bollinger Band and channel lines. The most frequently traded price in the Friday session was
1257.20. The 60 minute 0.2% by 3-box point and figure chart continues to look very positive.
The daily 1% by 3-box point and figure chart is bullish with an upside target of 1358.3. We like
the action in gold but also understand its connection to the instability in the currencies. There are
things that you cannot ignore. That said, gold has been acting well for most of this New Year.
17.
18.
19.
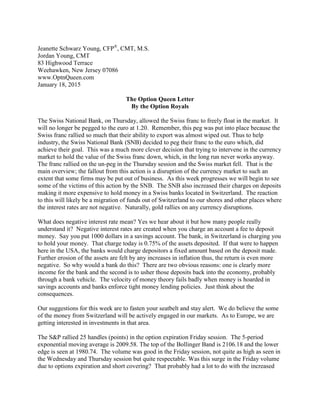
20. The US Dollar Index rallied in the Friday session closing at 93.00. The action seen in the
Thursday session resembled Mrs. Todd’s Wild Ride and left a doji candlestick with a huge range
for the day. Our own indicator and the RSI are both issuing buy-signals. The stochastic
indicator is positioned to issue a buy-signal at overbought level in the next session. We are
overbought for the weekly time-frame although we have been overbought for quite a long time.
The 5-period exponential moving average is 92.516. The top of the Bollinger Band is 93.456
and the lower edge is seen at 91.23. We are above the Ichimoku Clouds for all time-frames. The
action suggests that we will test 94.055 last seen in June of 2010. The upward trending channel
lines are 94.02 and 92.28. The 30 minute 0.05 by 3-box chart has an upside target of 94.5 and a
downside target of 91.65. The 60 minute 0.1% by 3-box chart has an upside target of 94.41.
The most frequently traded price in the Friday session was 92.45. We do notice that this market
seems to be losing some of its momentum. If and when there is a retreat, 91.49 should offer
some good support for the US Dollar. If long, keep your trailing stops tight and don’t fight the
trend of the market. We will have some currency chaos in coming days and there will be more
fallout regarding banks who traded currencies and who just might have short exposure to the free
trading Swiss franc.
25. involves substantial risk of loss and is not suitable for all investors. You should carefully
consider whether trading is suitable for you in light of your circumstances, knowledge, and
financial resources. You may lose all or more of your initial investment.