SlideShare a Scribd company logo
1 of 8
Download to read offline
Chart	Patterns	
	
Chart	 patterns	 are	 the	 basis	 of	 technical	 analysis	 and	 it	 is	 a	 shape	 within	 a	 price	
chart	that	helps	to	suggest	what	prices	would	the	share	has	next	and	based	on	what	
they	have	done	in	the	past.	The	following	are	the	best	chart	patterns,	but	there	is	no	
one	best	chart	pattern	as	they	are	all	used	to	highlight	different	trends	in	a	huge	
variety	 of	 markets.	 Some	 charts	 are	 to	 be	 used	 when	 the	 market	 is	 volatile	 and	
others	are	to	be	used	when	the	market	is	bullish	and	some	others	are	best	when	the	
market	is	bearish	and	therefore	it	should	be	understood	that	there	is	no	one	pattern	
which	is	to	be	considered	as	best	for	every	market	condition.		
	
Use	of	wrong	pattern	or	not	knowing	which	pattern	to	be	used	may	cause	damages	
and	miss	out	an	opportunity	to	profit	and	thus	every	investor	should	understand	the	
best	chart	pattern	for	a	particular	market	in	which	investor	is	in.	Before	getting	into	
the	details	of	different	chart	patterns,	one	should	be	able	to	understand	and	have	an	
idea	about	support	and	resistance	levels.	
	
The	chart	patterns	fall	into	three	categories	namely	continuation	patterns,	reversal	
patterns	and	bilateral	patterns.	A	continuation	patterns	signal	that	an	ongoing	trend	
will	continue,	reversal	chart	patterns	indicate	that	a	trend	is	 about	to	change	the	
general	direction	and	whereas	bilateral	chart	patterns	reveals	that	the	price	could	
move	in	any	direction	which	means	the	market	is	highly	volatile.		
	
These	 chart	 patterns	 are	 merely	 an	 indication	 of	 what	 might	 happen	 to	 an	 asset	
price	but	not	a	guarantee	that	a	market	will	move	in	that	predicted	direction.	
	
1. Head	and	shoulders	
2. Double	top	
3. Double	bottom	
4. Rounding	bottom	
5. Cup	and	handle	
6. Wedges	
7. Pennant	or	flags	
8. Ascending	triangle	
9. Descending	triangle	
10. Symmetrical	triangle	
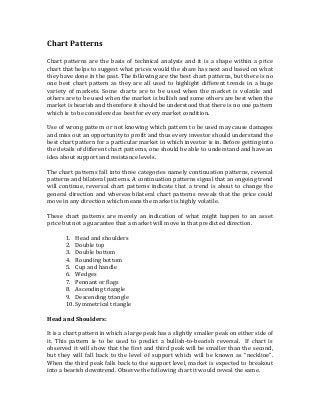
	
Head	and	Shoulders:	
	
It	is	a	chart	pattern	in	which	a	large	peak	has	a	slightly	smaller	peak	on	either	side	of	
it.	 This	 pattern	 is	 to	 be	 used	 to	 predict	 a	 bullish-to-bearish	 reversal.	 	 If	 chart	 is	
observed	it	will	show	that	the	first	and	third	peak	will	be	smaller	than	the	second,	
but	 they	 will	 fall	 back	 to	 the	 level	 of	 support	 which	 will	 be	 known	 as	 โ€œnecklineโ€.		
When	the	third	peak	falls	back	to	the	support	level,	market	is	expected	to	breakout	
into	a	bearish	downtrend.	Observe	the	following	chart	it	would	reveal	the	same.
Double	Top:	
	
The	investors	and	traders	to	find	out	the	trend	reversals	use	this	chart	pattern.	It	is	
usual	in	the	market	that	the	share	price	will	experience	peak	before	reversing	back	
to	the	support	level	and	after	that	it	will	climb	up	once	again	before	it	reverses	back	
permanently;	which	will	be	against	the	prevailing	trend.
Double	Bottom:	
	
This	chart	pattern	will	indicate	a	period	of	selling	to	inform	the	investor	or	trader	
that	the	share	price	will	drop	below	the	support	level,	afterwards	it	will	rise	to	the	
resistance	level	and	again	it	will	drop.	This	trend	will	reverse	and	begin	an	upward	
when	 market	 becomes	 more	 bullish.	 This	 movement	 will	 signifies	 the	 end	 of	
downtrend	and	move	towards	uptrend	and	therefore	this	double	bottom	pattern	is	
a	bullish	reversal	pattern.		


Rounding	Bottom:	
This	pattern	would	reveal	either	a	continuation	or	a	reversal,	as	during	an	upward	
trend	share	price	may	fall	slightly	before	increasing	again	to	say	that	the	market	is	
in	 bullish	 continuation.	 Investor	 or	 trader	 would	 be	 interested	 to	 capitalize	 the	
information	revealed	by	this	pattern	by	buying	halfway	around	the	bottom,	at	the	
low	point	and	again	they	will	take	advantage	of	the	situation	on	the	continuation	
when	it	breaks	the	resistance	level.	The	char	given	below	is	an	example	of	bullish	
reversal	 rounding	 bottom;	 where	 it	 is	 revealed	 that	 if	 the	 share	 price	 is	 in	
downtrend	and	a	rounding	bottom	is	formed	before	the	trend	reversal	and	entered	
a	bullish	uptrend.
Cup	and	Handle:	
	
This	pattern	shows	a	period	of	bearish	market	sentiment	before	the	overall	trend	
continues	in	a	bullish	trend.	In	other	words	this	is	called	as	a	bullish	continuation	
pattern.	The	cup	would	be	similar	to	rounding	bottom	pattern	seen	above	and	the	
handle	is	similar	to	a	wedge	pattern.	After	the	formation	of	rounding	bottom,	the	
price	 of	 share	 enters	 a	 temporary	 retracement	 within	 two	 parallel	 lines	 and	
therefore,	this	will	be	called	as	the	handle;	after	this	the	prices	reverses	out	of	the	
handle	and	continue	with	the	overall	bullish	trend.
Wedges:		
	
This	 wedges	 pattern	 is	 formed	 when	 share	 prices	 movement	 are	 between	 two	
sloping	trend	line;	it	may	be	of	two	trend	lines	namely	rising	and	falling	trend	lines.	
If	it	is	a	rising	trend	line	a	rising	wedge	is	formed	with	two	upward	slanted	lines	of	
support	and	resistance.	Here,	the	line	of	support	is	steeper	than	the	resistance	line,	
to	signal	that	the	share	price	will	decline	more	permanently	as	it	breaks	through	the	
support	level.	A	falling	wedge	occurs	between	two	downward	sloping	levels	and	in	
this	case	the	line	of	resistance	is	steeper	than	the	support	to	indicate	that	the	share	
price	will	rise	and	will	break	through	the	resistance	level.	The	chart	given	below	
would	provide	details	described	above.	Both	wedges	are	reversal	patterns,	as	rising	
wedges	represents	a	bearish	market	and	falling	wedges	represents	a	bullish	market.		


Pennant	or	Flags:	
	
This	 type	 of	 patterns	 is	 created	 after	 the	 share	 price	 experiences	 a	 upward	
movement	and	consolidates	the	position	after	that.	At	the	early	stages,	there	will	be	
a	significant	increase	and	share	prices	will	enter	into	a	series	of	smaller	upward	and	
downward	movements.	This	pattern	can	be	either	bullish	or	bearish	to	represent	a	
continuation	or	a	reversal.	It	may	look	like	a	wedge	pattern	or	a	triangle	pattern	but	
it	 can	 be	 observed	 that	 the	 wedges	 are	 narrower	 than	 pennants	 or	 triangles	 and	
wedges	are	always	ascending	or	descending	whereas	pennants	is	always	horizontal.
Ascending	Triangle:	
	
It	is	a	bullish	continuation	pattern	to	signify	the	continuation	of	upward	movement.	
It	 can	 be	 observed	 from	 the	 chart	 given	 below	 that	 on	 horizontal	 line	 the	 swing	
highs	to	indicate	the	resistance	and	trend	lines	along	the	swing	low	to	indicate	the	
support	line.	This	chart	pattern	will		always	have	two	or	more	similar	peak	highs	to	
allow	for	drawing	a	horizontal	line	to	indicate	the	historic	level	of	resistance	and	
trend	line	indicate	the	overall	upward	movement	of	the	pattern.
Descending	Triangle:	
	
As	against	the	ascending	triangle,	this	chart	pattern	indicates	a	bearish	continuation	
of	 the	 downward	 movement.	 Investor	 or	 traders	 are	 expected	 to	 sell	 the	 shares	
during	a	triangle	to	profit	from	the	falling	market.	This	pattern	moves	lower	and	
breaks	the	support	level	to	indicate	that	sellers	dominate	market.	The	meaning	of	
this	pattern	is	that	the	lower	peaks	are	likely	to	be	present	and	unlikely	to	reverse.		


From	the	above	chart	it	is	seen	that	descending	triangle	can	be	identified	from	the	
horizontal	line	of	support	and	a	downward-sloping	line	of	resistance.	After	a	
particular	point,	the	trend	will	break	through	the	support	and	the	downward	trend	
will	continue	with	no	indication	for	reversal.		
	
Symmetrical	Triangle:	
	
It	 is	 a	 continuation	 pattern	 to	 mean	 that	 the	 market	 will	 usually	 continue	 in	 the	
same	 direction	 as	 the	 overall	 trend	 after	 the	 pattern	 is	 formed.	 It	 can	 be	 either	
bullish	or	bearish	depending	upon	the	market.	Symmetrical	triangle	formed	when	
the	share	prices	converges	with	a	series	of	lower	peaks	and	higher	troughs.	Observe	
the	chart	given	below,	it	can	be	ascertained	that	the	overall	trend	is	bearish,	and	the	
symmetrical	triangle	show	that	there	has	been	a	brief	period	of	upward	reversals.
The	market	will	break	out	in	any	direction,	when	there	is	no	clear	trend	before	the	
formation	of	triangle	pattern	is	formed.	When	it	breaks	on	either	direction	then	the	
symmetrical	triangle	can	be	called	as	bilateral	pattern.	Bilateral	pattern	means	that	
they	are	best	used	in	volatile	markets	when	there	is	no	clear	indication	of	direction	
of	 movement	 of	 prices.	 The	 following	 chart	 would	 provide	 details	 as	 mentioned	
above.

More Related Content

More from SaiLakshmi115

More from SaiLakshmi115 (9)

ROLE OF NBFC IN FINANCIAL INCLUSION
ROLE OF NBFC IN FINANCIAL INCLUSIONROLE OF NBFC IN FINANCIAL INCLUSION
ROLE OF NBFC IN FINANCIAL INCLUSION
ย 
Micro finance- P. SAI PRATHYUSHA ([PONDICHERRY UNIVERSITY)
Micro finance- P. SAI PRATHYUSHA ([PONDICHERRY UNIVERSITY)Micro finance- P. SAI PRATHYUSHA ([PONDICHERRY UNIVERSITY)
Micro finance- P. SAI PRATHYUSHA ([PONDICHERRY UNIVERSITY)
ย 
Issue management intermediaries- P. SAI PRATHYUSHA (PONDICHERRY UNIVERSITY)
Issue management intermediaries- P. SAI PRATHYUSHA (PONDICHERRY UNIVERSITY)Issue management intermediaries- P. SAI PRATHYUSHA (PONDICHERRY UNIVERSITY)
Issue management intermediaries- P. SAI PRATHYUSHA (PONDICHERRY UNIVERSITY)
ย 
Non banking financial company- P. SAI PRATHYUSHA (PONDICHERRY UNIVERSITY)
Non banking financial company- P. SAI PRATHYUSHA (PONDICHERRY UNIVERSITY)Non banking financial company- P. SAI PRATHYUSHA (PONDICHERRY UNIVERSITY)
Non banking financial company- P. SAI PRATHYUSHA (PONDICHERRY UNIVERSITY)
ย 
CREDIT RATING - P. SAI PRATHYUSHA (PONDICHERRY UNIVERSITY)
CREDIT RATING - P. SAI PRATHYUSHA (PONDICHERRY UNIVERSITY)CREDIT RATING - P. SAI PRATHYUSHA (PONDICHERRY UNIVERSITY)
CREDIT RATING - P. SAI PRATHYUSHA (PONDICHERRY UNIVERSITY)
ย 
FACTORING BY P. SAI PRATHYUSHA
FACTORING BY P. SAI PRATHYUSHAFACTORING BY P. SAI PRATHYUSHA
FACTORING BY P. SAI PRATHYUSHA
ย 
COMPANY ANALYSIS-HINDUSTAN UNILEVER LTD
COMPANY ANALYSIS-HINDUSTAN UNILEVER LTDCOMPANY ANALYSIS-HINDUSTAN UNILEVER LTD
COMPANY ANALYSIS-HINDUSTAN UNILEVER LTD
ย 
CAPITAL BUDGETING - NPV , CAPM MODEL, IRR
CAPITAL BUDGETING - NPV , CAPM MODEL, IRRCAPITAL BUDGETING - NPV , CAPM MODEL, IRR
CAPITAL BUDGETING - NPV , CAPM MODEL, IRR
ย 
RESERVE BANK OF INDIA AND ITS FUNCTIONS BY P. SAI PRATHYUSHA
RESERVE BANK OF INDIA AND ITS FUNCTIONS BY P. SAI PRATHYUSHARESERVE BANK OF INDIA AND ITS FUNCTIONS BY P. SAI PRATHYUSHA
RESERVE BANK OF INDIA AND ITS FUNCTIONS BY P. SAI PRATHYUSHA
ย 

Recently uploaded

Recently uploaded (20)

Log your LOA pain with Pension Lab's brilliant campaign
Log your LOA pain with Pension Lab's brilliant campaignLog your LOA pain with Pension Lab's brilliant campaign
Log your LOA pain with Pension Lab's brilliant campaign
ย 
(INDIRA) Call Girl Mumbai Call Now 8250077686 Mumbai Escorts 24x7
(INDIRA) Call Girl Mumbai Call Now 8250077686 Mumbai Escorts 24x7(INDIRA) Call Girl Mumbai Call Now 8250077686 Mumbai Escorts 24x7
(INDIRA) Call Girl Mumbai Call Now 8250077686 Mumbai Escorts 24x7
ย 
Call Girls Koregaon Park Call Me 7737669865 Budget Friendly No Advance Booking
Call Girls Koregaon Park Call Me 7737669865 Budget Friendly No Advance BookingCall Girls Koregaon Park Call Me 7737669865 Budget Friendly No Advance Booking
Call Girls Koregaon Park Call Me 7737669865 Budget Friendly No Advance Booking
ย 
Indore Real Estate Market Trends Report.pdf
Indore Real Estate Market Trends Report.pdfIndore Real Estate Market Trends Report.pdf
Indore Real Estate Market Trends Report.pdf
ย 
The Economic History of the U.S. Lecture 20.pdf
The Economic History of the U.S. Lecture 20.pdfThe Economic History of the U.S. Lecture 20.pdf
The Economic History of the U.S. Lecture 20.pdf
ย 
Solution Manual for Principles of Corporate Finance 14th Edition by Richard B...
Solution Manual for Principles of Corporate Finance 14th Edition by Richard B...Solution Manual for Principles of Corporate Finance 14th Edition by Richard B...
Solution Manual for Principles of Corporate Finance 14th Edition by Richard B...
ย 
High Class Call Girls Nagpur Grishma Call 7001035870 Meet With Nagpur Escorts
High Class Call Girls Nagpur Grishma Call 7001035870 Meet With Nagpur EscortsHigh Class Call Girls Nagpur Grishma Call 7001035870 Meet With Nagpur Escorts
High Class Call Girls Nagpur Grishma Call 7001035870 Meet With Nagpur Escorts
ย 
The Economic History of the U.S. Lecture 30.pdf
The Economic History of the U.S. Lecture 30.pdfThe Economic History of the U.S. Lecture 30.pdf
The Economic History of the U.S. Lecture 30.pdf
ย 
05_Annelore Lenoir_Docbyte_MeetupDora&Cybersecurity.pptx
05_Annelore Lenoir_Docbyte_MeetupDora&Cybersecurity.pptx05_Annelore Lenoir_Docbyte_MeetupDora&Cybersecurity.pptx
05_Annelore Lenoir_Docbyte_MeetupDora&Cybersecurity.pptx
ย 
The Economic History of the U.S. Lecture 23.pdf
The Economic History of the U.S. Lecture 23.pdfThe Economic History of the U.S. Lecture 23.pdf
The Economic History of the U.S. Lecture 23.pdf
ย 
Booking open Available Pune Call Girls Talegaon Dabhade 6297143586 Call Hot ...
Booking open Available Pune Call Girls Talegaon Dabhade  6297143586 Call Hot ...Booking open Available Pune Call Girls Talegaon Dabhade  6297143586 Call Hot ...
Booking open Available Pune Call Girls Talegaon Dabhade 6297143586 Call Hot ...
ย 
Pooja 9892124323 : Call Girl in Juhu Escorts Service Free Home Delivery
Pooja 9892124323 : Call Girl in Juhu Escorts Service Free Home DeliveryPooja 9892124323 : Call Girl in Juhu Escorts Service Free Home Delivery
Pooja 9892124323 : Call Girl in Juhu Escorts Service Free Home Delivery
ย 
Call Girls Service Nagpur Maya Call 7001035870 Meet With Nagpur Escorts
Call Girls Service Nagpur Maya Call 7001035870 Meet With Nagpur EscortsCall Girls Service Nagpur Maya Call 7001035870 Meet With Nagpur Escorts
Call Girls Service Nagpur Maya Call 7001035870 Meet With Nagpur Escorts
ย 
Solution Manual for Financial Accounting, 11th Edition by Robert Libby, Patri...
Solution Manual for Financial Accounting, 11th Edition by Robert Libby, Patri...Solution Manual for Financial Accounting, 11th Edition by Robert Libby, Patri...
Solution Manual for Financial Accounting, 11th Edition by Robert Libby, Patri...
ย 
High Class Call Girls Nashik Maya 7001305949 Independent Escort Service Nashik
High Class Call Girls Nashik Maya 7001305949 Independent Escort Service NashikHigh Class Call Girls Nashik Maya 7001305949 Independent Escort Service Nashik
High Class Call Girls Nashik Maya 7001305949 Independent Escort Service Nashik
ย 
Booking open Available Pune Call Girls Wadgaon Sheri 6297143586 Call Hot Ind...
Booking open Available Pune Call Girls Wadgaon Sheri  6297143586 Call Hot Ind...Booking open Available Pune Call Girls Wadgaon Sheri  6297143586 Call Hot Ind...
Booking open Available Pune Call Girls Wadgaon Sheri 6297143586 Call Hot Ind...
ย 
Stock Market Brief Deck (Under Pressure).pdf
Stock Market Brief Deck (Under Pressure).pdfStock Market Brief Deck (Under Pressure).pdf
Stock Market Brief Deck (Under Pressure).pdf
ย 
The Economic History of the U.S. Lecture 25.pdf
The Economic History of the U.S. Lecture 25.pdfThe Economic History of the U.S. Lecture 25.pdf
The Economic History of the U.S. Lecture 25.pdf
ย 
Best VIP Call Girls Noida Sector 18 Call Me: 8448380779
Best VIP Call Girls Noida Sector 18 Call Me: 8448380779Best VIP Call Girls Noida Sector 18 Call Me: 8448380779
Best VIP Call Girls Noida Sector 18 Call Me: 8448380779
ย 
02_Fabio Colombo_Accenture_MeetupDora&Cybersecurity.pptx
02_Fabio Colombo_Accenture_MeetupDora&Cybersecurity.pptx02_Fabio Colombo_Accenture_MeetupDora&Cybersecurity.pptx
02_Fabio Colombo_Accenture_MeetupDora&Cybersecurity.pptx
ย 

Chart patterns BY P. Sai Prathyusha (1ST M.COM BUSINESS FINANCE)