SlideShare a Scribd company logo
1 of 1
Phase Objectives Key Activities Possible Tools and Techniques Key Deliverables
Document the problem
statement and establish the
charter. Demonstrate
alignment with the Business
metrics and strategies.
Determine Customer
requirements and
performance standards.
 Select Team with
Champion
 Develop problem
statement
 Develop Charter
 Create SIPOC
 Address gap between VOC
and process
 Estimate financial benefits
 Problem Statements
 Project Charter
 SIPOC map
 COPQ
 Communication Plan
Develop a reliable and valid
measurement system of the
business process to
effectively evaluate the
success of meeting
customer requirements.
 Obtain Customer
requirements
 Create overall project plan
 Develop measurement
plan & compile project
metrics
 Determine defect tracking
requirements
 Assess baseline
performance-estimate
process capability
 Measurement Systems
Analysis
 Process Description
 Project Plan & Timeline
 Metrics and collection plan
 Baseline Performance results
 Process capability analysis
 Lean Tools Assessment
 Measurement Systems
Analysis
 Process model – ‘as is’
Utilization of data
techniques to gain insight
into process. Divide data
into groups based on key
characteristics and assess
the root causes of errors
and poor performance.
Determine where to focus
efforts for improvement.
 Conduct statistical tests
 Hypothesis testing
 Pareto chart
 Scatter Plot
 Multi-vari chart
 Box plot
 ANOVA
 Describe findings – identify
potential root causes
 Validate findings
 Data relationships
 Validated Key Input Variables
(KPIVs) & Key Output Variables
(KPOVs)
 Prioritize sources of variation
 root causes
 Identify & communicate potential
improvements
 Summarize benefits &
annualized financial benefits
Identify key change
opportunities and
proactively test for
optimization. Develop
implementation and
communication plan
including a change
management approach to
assist the organization in
adaptation of the
improvements.
 Design of Experiments –
describe purpose & build
test/ analysis strategy
 Evaluate and Confirm
results
 Analyze KPIVs
 Create action plan for
implementation including
change management and
communication needs
 Buy-in assessment
 Quantified relationship between key
input and key output variables
 Defined process improvements
including impacts and benefits
 Implementation Plan
 Process model – ‘Should be’
 Impacted Employees are Trained
Definition of optimal process
settings and conditions with
specified metrics.
Implementation of
improvements with a control
plan to assess & maintain
gains.
 Implement improvements
 Evaluate results
 Integrate & manage
improvements in work
processes
 Complete closure activities
 Document process change
 Control plan
 Determine new process capability
 Leverage opportunities for replication
 Communicate results
 Financial audit
 Hand-off to process owner
Define
Measure
Analyze
Improve
Control
1
Six Sigma Process Improvement Foundational Steps
1
Migration e-Pro Process Improvement
Project Charter
Project Description Error corrections and clarification of benefits are generating
rework throughout the migration and case installation
processes, accounting for 20% of the total number of e-Pro
change transactions. It is estimated that the volume of error
and rework will grow proportionally as the number of
accounts migrating by 1/1/2004 increases, driving a
proportionate increase in cost and potentially dissatisfying
customers.
Start Date April 1, 2003
Completion Date
Scheduled to be completed by September 5, 2003
Baseline Metrics For 1/1/03 migrated accounts:
National Accounts
- Average number of change transactions: 14.3, of which
2.9 are due to error and rework
- Average hours of rework: 309 hours
Regional Accounts
- Average number of change transactions: 8.0, of which
1.6 are due to error and rework
- Average hours of rework: 137 hours
Primary Metrics 1. Total e-Pro change transactions
2. Percentage of change transactions due to error and
benefits clarification
3. Average rework hours per error and benefits clarification
Secondary Metrics none
Goal Reduce error and rework in the migration process by 50%
starting with 1/1/04 migrating accounts
Customer Customer migration survey results
Financial CODND (Cost of Doing Nothing Differently)
4
th
Qtr 2003: $500K
Year 2004: $2.5M
Benefits
Internal Productivity Estimated cycle time reduction of 18,868 hours (assuming
195 accounts migrating 1/1/04).
Define April 1 – April 21, 2003
Plan Projects & Metrics April 14 – April 18, 2003
Baseline Project April 21 – May 2
Consider Lean Tools May12 – May 16, 2003
MSA May 19 – June 2, 2003
Wisdom of the Org. June 2 – June 6, 2003
Passive Analysis June 9 – June 20, 2003
Proactive Testing June 23 – August 4, 2003
PhaseMilestones
Control August 4 – September 5, 2003
SUPPLIER INPUT PROCESS OUTPUT CUSTOMER
Sales
Client / Policy Holder
HR Benefits
Coordinator
Client Consultant
Third Party Benefits
Vendor
Member
GO Decision
Policy Renewal Date
Summary of Benefits
Administrative
Requirements
Account
Organizational
Structure
Detail Benefits
Account Data
Loaded in System
Member and
Dependent
Eligibility
Information
Loaded in System
Member ID Card
Client / Policy
Holder
Third Party Benefits
Vendor
Member and
Dependent
Providers
Claim
Call
1. Conduct migration
analysis
2. Complete account
profile
3. Load account
structure in system
4. Set up and validate
account benefits in
system
5. Produce account
eligibility record
6. Load account data
in product claim
engines
0Subgroup 10 20 30 40
0
10
20
30
IndividualValue
Mean=10.98
UCL=26.81
LCL=-4.854
0
10
20
MovingRange
1
R=5.952
UCL=19.45
LCL=0
Total e-Pro Change Transactions by Account fromSep 2002 thru Mar 2003
ID Task Name
1 DEFINE PHASE
12 MEASURE PHASE
13 Plan Project and Metrics
22 Baseline the Project
23 Select KPOV metric to track process output
24 Estimate process capability /perf ormance at the 30,000-f oot-lev el
25 Categorical failures
26 Create pareto chart
27 Rescope project to a large Pareto category
28 Repeat Baseline the Project steps 23 through 27
29 Non categorical failures
30 Rev ise estimate f or COPQ/CODND
31 Project status update with executiv e sponsor
32 Consider Lean Tools
39 Conduct Measurement Systems Analysis (MSA)
40 Ensure data integrity
41 Perf orm Gauge R&R
42 Improv e gauge
43 Project status update with executiv e sponsor
44 Wisdom of the Organization
55 ANALYZE PHASE
56 Use v isualization of data techniques to gain insight to processes
57 Conduct inf erential statistical tests and conf idence interv al calculations on indiv idual KPOVs
58 Conduct appropriate sample size calculations
59 Conduct hy pothesis tests
60 Describe statistical f indings to others using v isualization of data techniques
61 Implement agreed-to process improv ement f indings
62 Project status update with executiv e sponsor
63 IMPROVE PHASE
65 d13 d
18 d
18 d
18 d
20 d
20 d
20 d
23 d
23 d
23 d
27 d
76 d33 d
69 d38 d
38 d
40 d
43 d
69 d48 d
61 d48 d
53 d
60 d53 d
60 d53 d
60 d53 d
60 d53 d
53 d
58 d
62 d
63 d
02 09 16 23 30 06 13 20 27 04 11 18 25 01 08 15 22 29 06 13 20 27 03 10 17 24 31 07 14 21 28 05
March April May June July August September Octob
Conduct
Analysis
Create Implementation
Guide
Expert Team
Meeting
Draft
EPRO
Draft
e-
PRO
Release e-PRO
Record
e-
PRO
Impl.
Guid
e
Update
EPRO
OK For
Release
to Vendor
Track
Systems
Loads
IMPLEMENTATION
ERW
From
Eligibilit
y
GO
Decisio
n
SALE
S
Set Up Client ID in
End State
Structure
Request
Codes
STRUCTURE
Complete
Structure
Inspection/Verify
with e-PRO
Get
Underwriting
Approval
Yes
No OK? Yes
No
Go back to
Rates
Structur
e in
CDB
No
Yes
Release
ATC
To Vendor
OK?
Review
Draft e-
PRO
Request/Receive
Codes
Enrollmen
t File
CLIENT /
CUSTOMERClient
Input
To Sales
Run Legislative
Tool
Check vs. e-
PRO
e-PRO
Redo?
Yes
No
Yes
OK?
Review
Draft
e-PRO
Create
Codes
Legislative Tool
Review
BPC &
Class
Codes
To
Structure
BENEFITS
TS
ID Claim
Scenarios
Load Data into
Downstream
Systems
OK?
Yes
No
Data
Engines
Loaded
(e.g ATC,
DocGen,
etc)
Test Scenarios
Check vs. e-
PRO
OK?
No
Yes
Fix Claim
Errors
No
No
VOB
Yes
EPRO
Rework
CDB
From
Vendor
Member
cancelle
d
in
Legacy
Reformat
Client
Eligibility Data
Review
Draft
EPRO
ELIGIBILITY
Receive Enrollment
Data
Match &
Merge
Load data in
CEO
Are
errors
resolve
d?
Fix Errors
YesNo Cancel
Member in
Legacy
Create
ERW
ERW
Eligibility
In CED
VENDO
R
(ID
CARDS)
ID
Card
s
From
Benefit
s
Get
Underwriting
Approval
ERW To
Implementatio
n
ERW To
Implementatio
n
Create Client ID
Client
ID
To
Structure,
Benefits,
and
Eligibility
Migration
Structure
Mapping Job
Aid
GO
Decision
To
Structure,
Benefits,
and
Eligibility
e-PRO
Rework
EPRO
Rework?
SMT linking
legacy
structure to
end state
To
Eligibility
CAIP
Processes shaded in green are specific to
migration
Processes out of scope, but critical to
Employer Services
Employer Services functional areas
OUT OF SCOPE
PROCESS STEPS
Production
Migration
Support
Cancel
Legacy
Structure
Elig.
Rework
e-Pro
Rework
Rework Loops highlighted in Red
10
100
50
0
Contracting
T4-T1
100500
60
50
40
30
20
10
0
T1-T2a w orkdays
Frequency
PMHS
Overpayment
Process Data / Materials
PeopleTechnology
Ÿ Auth / Referral Info missing/incomplete/incorrect
Ÿ OI Info missing/incomplete/incorrect
Ÿ Member Eligibility Info missing/incomplete/
incorrect
Ÿ Benefit Info missing/incomplete/incorrect
Ÿ Provider Fee Schedule Info missing/incomplete/
incorrect
Ÿ Provider/Vendor TIN/SSN Info missing/
incomplete/incorrect
Ÿ Additional Information Necessary to Process
Claim
Ÿ Transaction/Codeset data excluded at gateway
Ÿ Standard Operating Procedures (SOPs)
Ÿ Claim Audit Process >$5K
Ÿ Second/Third Party Internal Review
(Medical Management, Claim Benefit
Build)
Ÿ iTrack - drives usage of paper reports to
sort older claims
Ÿ Skill Level of Processor
Ÿ Accessiblity of Site Coach/Training Staff
Ÿ Aggressive Productivity goals conflict with low
quality requirements
Ÿ Rushed Training Schedule
Ÿ Lack of up-training / reinforcement training
Ÿ Best Practice / Skill Training not conducted
Ÿ OJT training on SOP usage
Ÿ System Error During Processing
Ÿ Data Fallout
Ÿ Aurhorization Mis-Match
Ÿ System Restrictions - LPI Manual Calc
Ÿ Data Set Up Issues (eligibility, provider, benefits)
Ÿ Timeliness of Batch Processing
Ÿ Bank Acct Set-Up Delays
Ÿ Customer Touchpoints Delays
Ÿ Inappropriate assignment or missing hold codes
Ÿ Provider Mis-Match
Ÿ Transaction Limitations on data collected at
gateway
Manual Adjudication &
PMHS Provider Selection
- Manual
End
Manually check
provider/ vendor
on claim system
Check provider
data and claim
data against iView
image
Mismatch?
Manually try to find
correct data
Found data
Correct data &
verify COB
Service request to
appropriate area
YES
NO
YES
iTrack
Verify in claim
screen and follow
COB Checklist
Attempt to
adjudicate claim
NO
Claim processed
Hold codes that
require further
research
NO
Re-open the claim
YES
Process will
depend on Hold
Code & SOP/ Job
Aid
CIRF
Attempt to resolve
all Hold Codes at a
line level
Resolve service
requests
Adjudicate claim
(manual or
systematic)
End
ID Task Name
1 DEFINE PHASE
12 MEASURE PHASE
13 Plan Project and Metrics
22 Baseline the Project
23 Select KPOV metric to track process output
24 Estimate process capability /perf ormance at the 30,000-f oot-lev el
25 Categorical failures
26 Create pareto chart
27 Rescope project to a large Pareto category
28 Repeat Baseline the Project steps 23 through 27
29 Non categorical failures
30 Rev ise estimate f or COPQ/CODND
31 Project status update with executiv e sponsor
32 Consider Lean Tools
39 Conduct Measurement Systems Analysis (MSA)
40 Ensure data integrity
41 Perf orm Gauge R&R
42 Improv e gauge
43 Project status update with executiv e sponsor
44 Wisdom of the Organization
55 ANALYZE PHASE
56 Use v isualization of data techniques to gain insight to processes
57 Conduct inf erential statistical tests and conf idence interv al calculations on indiv idual KPOVs
58 Conduct appropriate sample size calculations
59 Conduct hy pothesis tests
60 Describe statistical f indings to others using v isualization of data techniques
61 Implement agreed-to process improv ement f indings
62 Project status update with executiv e sponsor
63 IMPROVE PHASE
65 d13 d
18 d
18 d
18 d
20 d
20 d
20 d
23 d
23 d
23 d
27 d
76 d33 d
69 d38 d
38 d
40 d
43 d
69 d48 d
61 d48 d
53 d
60 d53 d
60 d53 d
60 d53 d
60 d53 d
53 d
58 d
62 d
63 d
02 09 16 23 30 06 13 20 27 04 11 18 25 01 08 15 22 29 06 13 20 27 03 10 17 24 31 07 14 21 28 05
March April May June July August September Octob
PMHS
# of Audits
7,321
04/05/2003
# $'s
Under 300 4% Under 1,030,680$
Over 676 9% Over 2,303,562$
No $ Error 914 12% No $ Error -$
No Error 5,431 74% No Error -$
7,321 3,334,243$
A)SEVERITY B)OCCURRENCE
Probability
C)DETECTION
Probability
RISK
PRIORITY
NUMBER ACTIONTO IMPROVE
Rate 1-10 Rate 1-10 Rate 1-10 RPN
10=Most
Severe
10=Highest
Probability
10=Lowest
Probability AxBxC A B C
Provider Mis-Match 10 8 9 720
Provider Data Incorrect/Incomplete 9 8 9 648
Data Fallout 9 6 10 540
Data Set Up Issues 9 6 10 540
Provider Fee Schedule Unclear 9 6 9 486
OI Information Needed 9 6 6 324
System Restrictions 6 6 9 324
Hold Codes 9 3 10 270
FAILUREMODE
ProcessName: PMHS Claim Processing
Date: 6/30/2003 Revision Level: 3
REVISEDVALUES
0Subgroup 10 20 30 40
0
10
20
30
IndividualValue
Mean=10.98
UCL=26.81
LCL=-4.854
0
10
20
MovingRange
1
R=5.952
UCL=19.45
LCL=0
Total e-Pro Change Transactions by Account fromSep 2002 thru Mar 2003

More Related Content

What's hot

Internal Audit effectiveness
Internal Audit effectivenessInternal Audit effectiveness
Internal Audit effectivenessKaran Puri
 
Navigating the new Trust Services Criteria
Navigating the new Trust Services CriteriaNavigating the new Trust Services Criteria
Navigating the new Trust Services CriteriaMcKonly & Asbury, LLP
 
Process Audit and ISO
Process Audit and ISOProcess Audit and ISO
Process Audit and ISOSadafhazel
 
Internal Audit Best Practices for Safety, Environment, and Quality Audits
Internal Audit Best Practices for Safety, Environment, and Quality AuditsInternal Audit Best Practices for Safety, Environment, and Quality Audits
Internal Audit Best Practices for Safety, Environment, and Quality AuditsNimonik
 
Sas 70 Readiness
Sas 70 ReadinessSas 70 Readiness
Sas 70 Readinessmpotorti
 
六合彩-香港六合彩
六合彩-香港六合彩六合彩-香港六合彩
六合彩-香港六合彩weige
 
香港六合彩
香港六合彩香港六合彩
香港六合彩cctv
 
IATF 16949: 2016
IATF 16949: 2016IATF 16949: 2016
IATF 16949: 2016Nimonik
 
IATF 16949 Webinar Slides 3.7.17
IATF 16949 Webinar Slides 3.7.17IATF 16949 Webinar Slides 3.7.17
IATF 16949 Webinar Slides 3.7.17Sara Gulo
 
Implementation of SAs, Audit Process Flow
Implementation of SAs, Audit Process FlowImplementation of SAs, Audit Process Flow
Implementation of SAs, Audit Process FlowSurashree Sahasrabudhe
 
Maximo Oil and Gas 7.6.1 HSE: Overview
Maximo Oil and Gas 7.6.1 HSE: Overview Maximo Oil and Gas 7.6.1 HSE: Overview
Maximo Oil and Gas 7.6.1 HSE: Overview Helen Fisher
 
Audit guidance for Federal PKI certfication authorities
Audit guidance for Federal PKI certfication authorities Audit guidance for Federal PKI certfication authorities
Audit guidance for Federal PKI certfication authorities David Sweigert
 
Karen Purtell Resume_022616
Karen Purtell Resume_022616Karen Purtell Resume_022616
Karen Purtell Resume_022616Karen Purtell
 

What's hot (19)

Internal Audit effectiveness
Internal Audit effectivenessInternal Audit effectiveness
Internal Audit effectiveness
 
Navigating the new Trust Services Criteria
Navigating the new Trust Services CriteriaNavigating the new Trust Services Criteria
Navigating the new Trust Services Criteria
 
SFC Plan of engagement
SFC Plan of engagementSFC Plan of engagement
SFC Plan of engagement
 
Process Audit and ISO
Process Audit and ISOProcess Audit and ISO
Process Audit and ISO
 
005 benchmarking-kpi's
005 benchmarking-kpi's005 benchmarking-kpi's
005 benchmarking-kpi's
 
Internal Audit Best Practices for Safety, Environment, and Quality Audits
Internal Audit Best Practices for Safety, Environment, and Quality AuditsInternal Audit Best Practices for Safety, Environment, and Quality Audits
Internal Audit Best Practices for Safety, Environment, and Quality Audits
 
Sas 70 Readiness
Sas 70 ReadinessSas 70 Readiness
Sas 70 Readiness
 
Managing Earnings at Asset Light 3PLs
Managing Earnings at Asset Light 3PLsManaging Earnings at Asset Light 3PLs
Managing Earnings at Asset Light 3PLs
 
T410 iso 19011
T410 iso 19011T410 iso 19011
T410 iso 19011
 
六合彩-香港六合彩
六合彩-香港六合彩六合彩-香港六合彩
六合彩-香港六合彩
 
香港六合彩
香港六合彩香港六合彩
香港六合彩
 
Iso final
Iso finalIso final
Iso final
 
IATF 16949: 2016
IATF 16949: 2016IATF 16949: 2016
IATF 16949: 2016
 
IATF 16949 Webinar Slides 3.7.17
IATF 16949 Webinar Slides 3.7.17IATF 16949 Webinar Slides 3.7.17
IATF 16949 Webinar Slides 3.7.17
 
Implementation of SAs, Audit Process Flow
Implementation of SAs, Audit Process FlowImplementation of SAs, Audit Process Flow
Implementation of SAs, Audit Process Flow
 
Iatf 16949 training
Iatf 16949 trainingIatf 16949 training
Iatf 16949 training
 
Maximo Oil and Gas 7.6.1 HSE: Overview
Maximo Oil and Gas 7.6.1 HSE: Overview Maximo Oil and Gas 7.6.1 HSE: Overview
Maximo Oil and Gas 7.6.1 HSE: Overview
 
Audit guidance for Federal PKI certfication authorities
Audit guidance for Federal PKI certfication authorities Audit guidance for Federal PKI certfication authorities
Audit guidance for Federal PKI certfication authorities
 
Karen Purtell Resume_022616
Karen Purtell Resume_022616Karen Purtell Resume_022616
Karen Purtell Resume_022616
 

Similar to Six Sigma Process Improvement Foundational Steps

Measure Customer and Business Feedback to Drive Improvement
Measure Customer and Business Feedback to Drive ImprovementMeasure Customer and Business Feedback to Drive Improvement
Measure Customer and Business Feedback to Drive ImprovementTechWell
 
Improve phase lean six sigma tollgate template
Improve phase   lean six sigma tollgate templateImprove phase   lean six sigma tollgate template
Improve phase lean six sigma tollgate templateSteven Bonacorsi
 
Improve phase lean six sigma tollgate template
Improve phase   lean six sigma tollgate templateImprove phase   lean six sigma tollgate template
Improve phase lean six sigma tollgate templateSteven Bonacorsi
 
Karens Portfolio 2000 2010
Karens Portfolio 2000 2010Karens Portfolio 2000 2010
Karens Portfolio 2000 2010Karen_Sampson
 
CWIN17 san francisco-william belding-innovation through insights 2017-12-07
CWIN17 san francisco-william belding-innovation through insights 2017-12-07CWIN17 san francisco-william belding-innovation through insights 2017-12-07
CWIN17 san francisco-william belding-innovation through insights 2017-12-07Capgemini
 
Lc Presentation
Lc PresentationLc Presentation
Lc Presentationreachab7
 
Inside the Enterprise Case Studies of Customer Apps
Inside the Enterprise Case Studies of Customer AppsInside the Enterprise Case Studies of Customer Apps
Inside the Enterprise Case Studies of Customer Appsdreamforce2006
 
How to Build & Execute Successful Roadmaps by Amazon Sr PM
How to Build & Execute Successful Roadmaps by Amazon Sr PMHow to Build & Execute Successful Roadmaps by Amazon Sr PM
How to Build & Execute Successful Roadmaps by Amazon Sr PMProduct School
 
Evm intro. slide deck 13 may 2018
Evm intro. slide deck 13 may 2018Evm intro. slide deck 13 may 2018
Evm intro. slide deck 13 may 2018Roger H. Mandel
 
Value Stream Mapping Project Template by Operational Excellence Consulting
Value Stream Mapping Project Template by Operational Excellence ConsultingValue Stream Mapping Project Template by Operational Excellence Consulting
Value Stream Mapping Project Template by Operational Excellence ConsultingOperational Excellence Consulting
 
Building continuous auditing capabilities
Building continuous auditing capabilitiesBuilding continuous auditing capabilities
Building continuous auditing capabilitiesWafaa N. AbuSadah
 
QM-037-Using DFSS tool
QM-037-Using DFSS toolQM-037-Using DFSS tool
QM-037-Using DFSS toolhandbook
 
Six_Sigma_Report_Template_v2 (2).pptx
Six_Sigma_Report_Template_v2 (2).pptxSix_Sigma_Report_Template_v2 (2).pptx
Six_Sigma_Report_Template_v2 (2).pptxPhngPhmTrung
 
Continuous Auditing
Continuous AuditingContinuous Auditing
Continuous Auditingmcoello
 
KI_res_24_yrs_exp_big_6
KI_res_24_yrs_exp_big_6KI_res_24_yrs_exp_big_6
KI_res_24_yrs_exp_big_6keith inman
 
Sample audit plan
Sample audit planSample audit plan
Sample audit planMaher Manan
 
Rpa conference new delhi
Rpa conference new delhiRpa conference new delhi
Rpa conference new delhigaurav
 

Similar to Six Sigma Process Improvement Foundational Steps (20)

Project initiation
Project initiationProject initiation
Project initiation
 
Measure Customer and Business Feedback to Drive Improvement
Measure Customer and Business Feedback to Drive ImprovementMeasure Customer and Business Feedback to Drive Improvement
Measure Customer and Business Feedback to Drive Improvement
 
Improve phase lean six sigma tollgate template
Improve phase   lean six sigma tollgate templateImprove phase   lean six sigma tollgate template
Improve phase lean six sigma tollgate template
 
Improve phase lean six sigma tollgate template
Improve phase   lean six sigma tollgate templateImprove phase   lean six sigma tollgate template
Improve phase lean six sigma tollgate template
 
Karens Portfolio 2000 2010
Karens Portfolio 2000 2010Karens Portfolio 2000 2010
Karens Portfolio 2000 2010
 
CWIN17 san francisco-william belding-innovation through insights 2017-12-07
CWIN17 san francisco-william belding-innovation through insights 2017-12-07CWIN17 san francisco-william belding-innovation through insights 2017-12-07
CWIN17 san francisco-william belding-innovation through insights 2017-12-07
 
Lc Presentation
Lc PresentationLc Presentation
Lc Presentation
 
Inside the Enterprise Case Studies of Customer Apps
Inside the Enterprise Case Studies of Customer AppsInside the Enterprise Case Studies of Customer Apps
Inside the Enterprise Case Studies of Customer Apps
 
How to Build & Execute Successful Roadmaps by Amazon Sr PM
How to Build & Execute Successful Roadmaps by Amazon Sr PMHow to Build & Execute Successful Roadmaps by Amazon Sr PM
How to Build & Execute Successful Roadmaps by Amazon Sr PM
 
Project Metrics & Measures
Project Metrics & MeasuresProject Metrics & Measures
Project Metrics & Measures
 
Evm intro. slide deck 13 may 2018
Evm intro. slide deck 13 may 2018Evm intro. slide deck 13 may 2018
Evm intro. slide deck 13 may 2018
 
Value Stream Mapping Project Template by Operational Excellence Consulting
Value Stream Mapping Project Template by Operational Excellence ConsultingValue Stream Mapping Project Template by Operational Excellence Consulting
Value Stream Mapping Project Template by Operational Excellence Consulting
 
Building continuous auditing capabilities
Building continuous auditing capabilitiesBuilding continuous auditing capabilities
Building continuous auditing capabilities
 
QM-037-Using DFSS tool
QM-037-Using DFSS toolQM-037-Using DFSS tool
QM-037-Using DFSS tool
 
Six_Sigma_Report_Template_v2 (2).pptx
Six_Sigma_Report_Template_v2 (2).pptxSix_Sigma_Report_Template_v2 (2).pptx
Six_Sigma_Report_Template_v2 (2).pptx
 
Continuous Auditing
Continuous AuditingContinuous Auditing
Continuous Auditing
 
KI_res_24_yrs_exp_big_6
KI_res_24_yrs_exp_big_6KI_res_24_yrs_exp_big_6
KI_res_24_yrs_exp_big_6
 
Sample audit plan
Sample audit planSample audit plan
Sample audit plan
 
DMAIC Components
DMAIC ComponentsDMAIC Components
DMAIC Components
 
Rpa conference new delhi
Rpa conference new delhiRpa conference new delhi
Rpa conference new delhi
 

Six Sigma Process Improvement Foundational Steps

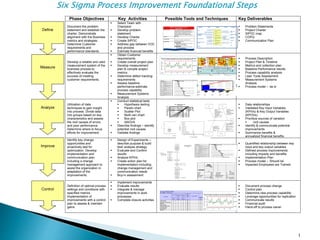
  • 1. Phase Objectives Key Activities Possible Tools and Techniques Key Deliverables Document the problem statement and establish the charter. Demonstrate alignment with the Business metrics and strategies. Determine Customer requirements and performance standards.  Select Team with Champion  Develop problem statement  Develop Charter  Create SIPOC  Address gap between VOC and process  Estimate financial benefits  Problem Statements  Project Charter  SIPOC map  COPQ  Communication Plan Develop a reliable and valid measurement system of the business process to effectively evaluate the success of meeting customer requirements.  Obtain Customer requirements  Create overall project plan  Develop measurement plan & compile project metrics  Determine defect tracking requirements  Assess baseline performance-estimate process capability  Measurement Systems Analysis  Process Description  Project Plan & Timeline  Metrics and collection plan  Baseline Performance results  Process capability analysis  Lean Tools Assessment  Measurement Systems Analysis  Process model – ‘as is’ Utilization of data techniques to gain insight into process. Divide data into groups based on key characteristics and assess the root causes of errors and poor performance. Determine where to focus efforts for improvement.  Conduct statistical tests  Hypothesis testing  Pareto chart  Scatter Plot  Multi-vari chart  Box plot  ANOVA  Describe findings – identify potential root causes  Validate findings  Data relationships  Validated Key Input Variables (KPIVs) & Key Output Variables (KPOVs)  Prioritize sources of variation  root causes  Identify & communicate potential improvements  Summarize benefits & annualized financial benefits Identify key change opportunities and proactively test for optimization. Develop implementation and communication plan including a change management approach to assist the organization in adaptation of the improvements.  Design of Experiments – describe purpose & build test/ analysis strategy  Evaluate and Confirm results  Analyze KPIVs  Create action plan for implementation including change management and communication needs  Buy-in assessment  Quantified relationship between key input and key output variables  Defined process improvements including impacts and benefits  Implementation Plan  Process model – ‘Should be’  Impacted Employees are Trained Definition of optimal process settings and conditions with specified metrics. Implementation of improvements with a control plan to assess & maintain gains.  Implement improvements  Evaluate results  Integrate & manage improvements in work processes  Complete closure activities  Document process change  Control plan  Determine new process capability  Leverage opportunities for replication  Communicate results  Financial audit  Hand-off to process owner Define Measure Analyze Improve Control 1 Six Sigma Process Improvement Foundational Steps 1 Migration e-Pro Process Improvement Project Charter Project Description Error corrections and clarification of benefits are generating rework throughout the migration and case installation processes, accounting for 20% of the total number of e-Pro change transactions. It is estimated that the volume of error and rework will grow proportionally as the number of accounts migrating by 1/1/2004 increases, driving a proportionate increase in cost and potentially dissatisfying customers. Start Date April 1, 2003 Completion Date Scheduled to be completed by September 5, 2003 Baseline Metrics For 1/1/03 migrated accounts: National Accounts - Average number of change transactions: 14.3, of which 2.9 are due to error and rework - Average hours of rework: 309 hours Regional Accounts - Average number of change transactions: 8.0, of which 1.6 are due to error and rework - Average hours of rework: 137 hours Primary Metrics 1. Total e-Pro change transactions 2. Percentage of change transactions due to error and benefits clarification 3. Average rework hours per error and benefits clarification Secondary Metrics none Goal Reduce error and rework in the migration process by 50% starting with 1/1/04 migrating accounts Customer Customer migration survey results Financial CODND (Cost of Doing Nothing Differently) 4 th Qtr 2003: $500K Year 2004: $2.5M Benefits Internal Productivity Estimated cycle time reduction of 18,868 hours (assuming 195 accounts migrating 1/1/04). Define April 1 – April 21, 2003 Plan Projects & Metrics April 14 – April 18, 2003 Baseline Project April 21 – May 2 Consider Lean Tools May12 – May 16, 2003 MSA May 19 – June 2, 2003 Wisdom of the Org. June 2 – June 6, 2003 Passive Analysis June 9 – June 20, 2003 Proactive Testing June 23 – August 4, 2003 PhaseMilestones Control August 4 – September 5, 2003 SUPPLIER INPUT PROCESS OUTPUT CUSTOMER Sales Client / Policy Holder HR Benefits Coordinator Client Consultant Third Party Benefits Vendor Member GO Decision Policy Renewal Date Summary of Benefits Administrative Requirements Account Organizational Structure Detail Benefits Account Data Loaded in System Member and Dependent Eligibility Information Loaded in System Member ID Card Client / Policy Holder Third Party Benefits Vendor Member and Dependent Providers Claim Call 1. Conduct migration analysis 2. Complete account profile 3. Load account structure in system 4. Set up and validate account benefits in system 5. Produce account eligibility record 6. Load account data in product claim engines 0Subgroup 10 20 30 40 0 10 20 30 IndividualValue Mean=10.98 UCL=26.81 LCL=-4.854 0 10 20 MovingRange 1 R=5.952 UCL=19.45 LCL=0 Total e-Pro Change Transactions by Account fromSep 2002 thru Mar 2003 ID Task Name 1 DEFINE PHASE 12 MEASURE PHASE 13 Plan Project and Metrics 22 Baseline the Project 23 Select KPOV metric to track process output 24 Estimate process capability /perf ormance at the 30,000-f oot-lev el 25 Categorical failures 26 Create pareto chart 27 Rescope project to a large Pareto category 28 Repeat Baseline the Project steps 23 through 27 29 Non categorical failures 30 Rev ise estimate f or COPQ/CODND 31 Project status update with executiv e sponsor 32 Consider Lean Tools 39 Conduct Measurement Systems Analysis (MSA) 40 Ensure data integrity 41 Perf orm Gauge R&R 42 Improv e gauge 43 Project status update with executiv e sponsor 44 Wisdom of the Organization 55 ANALYZE PHASE 56 Use v isualization of data techniques to gain insight to processes 57 Conduct inf erential statistical tests and conf idence interv al calculations on indiv idual KPOVs 58 Conduct appropriate sample size calculations 59 Conduct hy pothesis tests 60 Describe statistical f indings to others using v isualization of data techniques 61 Implement agreed-to process improv ement f indings 62 Project status update with executiv e sponsor 63 IMPROVE PHASE 65 d13 d 18 d 18 d 18 d 20 d 20 d 20 d 23 d 23 d 23 d 27 d 76 d33 d 69 d38 d 38 d 40 d 43 d 69 d48 d 61 d48 d 53 d 60 d53 d 60 d53 d 60 d53 d 60 d53 d 53 d 58 d 62 d 63 d 02 09 16 23 30 06 13 20 27 04 11 18 25 01 08 15 22 29 06 13 20 27 03 10 17 24 31 07 14 21 28 05 March April May June July August September Octob Conduct Analysis Create Implementation Guide Expert Team Meeting Draft EPRO Draft e- PRO Release e-PRO Record e- PRO Impl. Guid e Update EPRO OK For Release to Vendor Track Systems Loads IMPLEMENTATION ERW From Eligibilit y GO Decisio n SALE S Set Up Client ID in End State Structure Request Codes STRUCTURE Complete Structure Inspection/Verify with e-PRO Get Underwriting Approval Yes No OK? Yes No Go back to Rates Structur e in CDB No Yes Release ATC To Vendor OK? Review Draft e- PRO Request/Receive Codes Enrollmen t File CLIENT / CUSTOMERClient Input To Sales Run Legislative Tool Check vs. e- PRO e-PRO Redo? Yes No Yes OK? Review Draft e-PRO Create Codes Legislative Tool Review BPC & Class Codes To Structure BENEFITS TS ID Claim Scenarios Load Data into Downstream Systems OK? Yes No Data Engines Loaded (e.g ATC, DocGen, etc) Test Scenarios Check vs. e- PRO OK? No Yes Fix Claim Errors No No VOB Yes EPRO Rework CDB From Vendor Member cancelle d in Legacy Reformat Client Eligibility Data Review Draft EPRO ELIGIBILITY Receive Enrollment Data Match & Merge Load data in CEO Are errors resolve d? Fix Errors YesNo Cancel Member in Legacy Create ERW ERW Eligibility In CED VENDO R (ID CARDS) ID Card s From Benefit s Get Underwriting Approval ERW To Implementatio n ERW To Implementatio n Create Client ID Client ID To Structure, Benefits, and Eligibility Migration Structure Mapping Job Aid GO Decision To Structure, Benefits, and Eligibility e-PRO Rework EPRO Rework? SMT linking legacy structure to end state To Eligibility CAIP Processes shaded in green are specific to migration Processes out of scope, but critical to Employer Services Employer Services functional areas OUT OF SCOPE PROCESS STEPS Production Migration Support Cancel Legacy Structure Elig. Rework e-Pro Rework Rework Loops highlighted in Red 10 100 50 0 Contracting T4-T1 100500 60 50 40 30 20 10 0 T1-T2a w orkdays Frequency PMHS Overpayment Process Data / Materials PeopleTechnology Ÿ Auth / Referral Info missing/incomplete/incorrect Ÿ OI Info missing/incomplete/incorrect Ÿ Member Eligibility Info missing/incomplete/ incorrect Ÿ Benefit Info missing/incomplete/incorrect Ÿ Provider Fee Schedule Info missing/incomplete/ incorrect Ÿ Provider/Vendor TIN/SSN Info missing/ incomplete/incorrect Ÿ Additional Information Necessary to Process Claim Ÿ Transaction/Codeset data excluded at gateway Ÿ Standard Operating Procedures (SOPs) Ÿ Claim Audit Process >$5K Ÿ Second/Third Party Internal Review (Medical Management, Claim Benefit Build) Ÿ iTrack - drives usage of paper reports to sort older claims Ÿ Skill Level of Processor Ÿ Accessiblity of Site Coach/Training Staff Ÿ Aggressive Productivity goals conflict with low quality requirements Ÿ Rushed Training Schedule Ÿ Lack of up-training / reinforcement training Ÿ Best Practice / Skill Training not conducted Ÿ OJT training on SOP usage Ÿ System Error During Processing Ÿ Data Fallout Ÿ Aurhorization Mis-Match Ÿ System Restrictions - LPI Manual Calc Ÿ Data Set Up Issues (eligibility, provider, benefits) Ÿ Timeliness of Batch Processing Ÿ Bank Acct Set-Up Delays Ÿ Customer Touchpoints Delays Ÿ Inappropriate assignment or missing hold codes Ÿ Provider Mis-Match Ÿ Transaction Limitations on data collected at gateway Manual Adjudication & PMHS Provider Selection - Manual End Manually check provider/ vendor on claim system Check provider data and claim data against iView image Mismatch? Manually try to find correct data Found data Correct data & verify COB Service request to appropriate area YES NO YES iTrack Verify in claim screen and follow COB Checklist Attempt to adjudicate claim NO Claim processed Hold codes that require further research NO Re-open the claim YES Process will depend on Hold Code & SOP/ Job Aid CIRF Attempt to resolve all Hold Codes at a line level Resolve service requests Adjudicate claim (manual or systematic) End ID Task Name 1 DEFINE PHASE 12 MEASURE PHASE 13 Plan Project and Metrics 22 Baseline the Project 23 Select KPOV metric to track process output 24 Estimate process capability /perf ormance at the 30,000-f oot-lev el 25 Categorical failures 26 Create pareto chart 27 Rescope project to a large Pareto category 28 Repeat Baseline the Project steps 23 through 27 29 Non categorical failures 30 Rev ise estimate f or COPQ/CODND 31 Project status update with executiv e sponsor 32 Consider Lean Tools 39 Conduct Measurement Systems Analysis (MSA) 40 Ensure data integrity 41 Perf orm Gauge R&R 42 Improv e gauge 43 Project status update with executiv e sponsor 44 Wisdom of the Organization 55 ANALYZE PHASE 56 Use v isualization of data techniques to gain insight to processes 57 Conduct inf erential statistical tests and conf idence interv al calculations on indiv idual KPOVs 58 Conduct appropriate sample size calculations 59 Conduct hy pothesis tests 60 Describe statistical f indings to others using v isualization of data techniques 61 Implement agreed-to process improv ement f indings 62 Project status update with executiv e sponsor 63 IMPROVE PHASE 65 d13 d 18 d 18 d 18 d 20 d 20 d 20 d 23 d 23 d 23 d 27 d 76 d33 d 69 d38 d 38 d 40 d 43 d 69 d48 d 61 d48 d 53 d 60 d53 d 60 d53 d 60 d53 d 60 d53 d 53 d 58 d 62 d 63 d 02 09 16 23 30 06 13 20 27 04 11 18 25 01 08 15 22 29 06 13 20 27 03 10 17 24 31 07 14 21 28 05 March April May June July August September Octob PMHS # of Audits 7,321 04/05/2003 # $'s Under 300 4% Under 1,030,680$ Over 676 9% Over 2,303,562$ No $ Error 914 12% No $ Error -$ No Error 5,431 74% No Error -$ 7,321 3,334,243$ A)SEVERITY B)OCCURRENCE Probability C)DETECTION Probability RISK PRIORITY NUMBER ACTIONTO IMPROVE Rate 1-10 Rate 1-10 Rate 1-10 RPN 10=Most Severe 10=Highest Probability 10=Lowest Probability AxBxC A B C Provider Mis-Match 10 8 9 720 Provider Data Incorrect/Incomplete 9 8 9 648 Data Fallout 9 6 10 540 Data Set Up Issues 9 6 10 540 Provider Fee Schedule Unclear 9 6 9 486 OI Information Needed 9 6 6 324 System Restrictions 6 6 9 324 Hold Codes 9 3 10 270 FAILUREMODE ProcessName: PMHS Claim Processing Date: 6/30/2003 Revision Level: 3 REVISEDVALUES 0Subgroup 10 20 30 40 0 10 20 30 IndividualValue Mean=10.98 UCL=26.81 LCL=-4.854 0 10 20 MovingRange 1 R=5.952 UCL=19.45 LCL=0 Total e-Pro Change Transactions by Account fromSep 2002 thru Mar 2003