SlideShare a Scribd company logo
1 of 6
Download to read offline
47
Abstract
The aim of the Resource Efficient Dairying (RED) trial
is to measure the productivity, economic and
environmental effects of different feed inputs and
management processes on a dairy farm. This is a long-
term systems trial located at Scott Farm (Dexcel Research
Farm) established on 1st June 2001 and expected to
continue until 2006. Trial design was based on six systems
that have an allowance of up to 200 kg nitrogen (N)/ha
(excluding the low input treatment). They are: low input
(no N fertiliser, heifers grazed-on and 2.3 cows/ha);
control (3 cows/ha); standoff (3 cows/ha); low
supplement input (5 t dry matter (DM) maize silage/ha,
3.8 cows/ha); moderate supplement input (10 t DM maize
silage/ha; 5.2 cows/ha); and high supplement input (15 t
DM maize silage + 5 t soymeal/ha; 6.9 cows/ha). The
last two systems have irrigation available to boost pasture
production. All systems were designed to operate at a
common comparative stocking rate (CSR) of 85 kg
liveweight (LW)/t DM. Two seasons’ data have shown
that increasing the stocking rate (SR) by 1.5 cows/ha
from 3.8 to 5.3 cows/ha, plus extra feed, increased output
by 90 and 184 kg milksolids (MS)/total ha in the two
years, when the extra area required to supply the extra
feed is included in the calculation of kg MS/ha. However
the further increase to 6.9 cows/ha plus extra feed
produced less MS/total ha than the system stocked at 3.8
cows/ha. Calculations of economic farm surplus (EFS)
and return on assets (ROA) reveal that when the payout
is $3.50/kg MS the low input system is competitive
irrespective of land price ($18000 or $37000/ha) or
supplement cost (18 c or 24 c/kg DM). Conversely at a
higher payout of $4.50/kg MS the treatment
supplementedwith10tmaizesilageDM/haiscompetitive
over the range of land prices and supplement costs tested.
Keywords: dairy cows, economic evaluation, maize
silage, milksolids, nitrogen fertiliser, stocking rate
Introduction
Farmers have developed a range of dairy production
systems suitable to the strategic plans for their farms,
which is often governed by the physical aspects and
climate of the area. Systems include low input, self-
contained; grazing dry stock off-farm; increasing feed
grown on-farm with the aid of irrigation, cropping or N
fertiliser; and importing feed from off-farm sources. The
higher input systems have developed where:
Resource Efficient Dairying trial: measurement criteria for farm systems
over a range of resource use
R.N. JENSEN, D.A. CLARK and K.A. MACDONALD
Dexcel, PB 3221, Hamilton
rodger.jensen@dexcel.co.nz
• Marginal returns on extra milk production are greater
than marginal cost of extra feed
• They allow more profitable use of existing land, cows,
plant, and labour
• Farmers wish to avoid the risk and cost associated
with buying more land
• Farmers wish to reduce production variation between
seasons
• Farmers wish to acquire additional Fonterra shares.
Milksolids/ha is the product of SR, expressed as cows
per hectare, and MS per cow, and increasing either or
both will increase MS per hectare, provided that sufficient
feed per hectare is provided to avoid the negative
relationship between SR and production/cow
(McMeekan 1961). Supplement brought onto the farm
will support high MS production per cow and per ha at
the high SRs needed to achieve high levels of pasture
utilisation (Stockdale 1995).
Supplement input to a system can be used to control
pasture residuals and maintain pasture conditions for
optimal growth (Van der Poel 1997). In addition,
supplements allow for a higher SR that would increase
pasture utilisation and extend lactation thereby achieving
high MS responses to supplements (Deane 1999).
Supplements will increase the total farm feed supply,
and may prevent periods of underfeeding of the cows,
which would otherwise have occurred at the higher
stocking rate. The MS/cow response can be optimised
by high breeding worth (BW) cows, which give higher
responses to extra feed at higher yields per cow than low
BW cows (Macdonald et al. 2005).
The RED trial was designed to monitor the effects on
MS production, economic performance and
environmental impacts of increasing feed inputs into
pastoral based dairy systems.
Materials and methods
The six experimental farmlets are located at Dexcel’s
Scott Research Farm, Newstead,Hamilton.All treatments
are designed to offer a CSR of 85 kg LW/t total DM, the
level at which EFS is optimised (Speight 2002). Feed
inputs and SR/ha (ha of home pasture) are shown in
Table 1. The CSR is based on an average LW of 500 kg
per cow. Treatment herds of 21 Holstein-Friesian cows
were established on 1st June 2001, and were balanced
for age, expected calving date,LW, condition score,BW
and somatic cell count.Annual culling allows for 25%
48 Proceedings of the New Zealand Grassland Association 67: 47–52 (2005)
replacements entering each herd per year. Treatment B
has a standoff pad that is utilised in late-winter and early-
spring, under a set of decision rules intended to decrease
nitrate leaching from the farmlet paddocks, and to
minimise pugging damage and protect soil structure.
Treatment C has four replacement yearling heifers grazed
on the farmlet.
The pastures were sown in May 2000 with 18 kg/ha
Bronsyn perennial ryegrass (Lolium perenne), 1.5 kg/
ha Grasslands Sustain white clover (Trifolium repens)
and 1.5 kg/ha Aran white clover (Trifolium repens).All
treatments except treatment C receive up to 200 kg N/ha
annually.
Pasture mass is assessed visually each week, and
calibrated against actual mass cut from ten quadrats (each
0.2 m2
), four post-grazing and six pre-grazing. The
quadrats are cut to ground level with an electric handpiece,
washed and oven dried for 48 hours at 105°C. Pasture
and supplement are sampled monthly for feed quality
analysis by near infrared spectrometry (NIRS).
System efficiencies, feed utilisation (FU, kg DM eaten/
kg DM grown) and feed conversion efficiency (FCE, kg
MS/t DM eaten) were calculated. The calculation was
based on pasture mass grown (from visual estimation)
and MS production. Factorial energy requirements were
summed for each treatment based on cow LW and
production level (McDonald et al. 1995). The energy
content (MJ ME/kg DM) of the respective treatments
(obtained from NIRS analysis) was used to define the
quantity of DM required (Jensen et al. 2005).
Milk yield/cow was measured by weekly herd tests,
with samples analysed to determine crude protein, fat
and lactose concentration using a Milkoscan 133B
analyser (Foss Electric, Denmark). For treatments D, E,
and F the calculated area required to grow the maize
silage and the soybean used were added to the farmlet
area of pasture to give total area required to support the
cows on that farmlet. Milksolids yields for these
treatments were calculated as MS/cow x cows/total area
(area of farmlet plus cropped area).
Live weight and condition score of each cow were
measured fortnightly at the morning milking. Cow health
was closely monitored throughout the trial, and a
proactive animal husbandry policy applied across all
herds (e.g. in-line dispensing of bloat oil and zinc for
prevention of bloat and facial eczema respectively,during
susceptible periods). For the supplemented herds, a
ration-balancing model based on NRC data (NRC 1987)
was used to ensure that cows were offered appropriate
mineral and protein supplements to complement the maize
silage. However, soybean meal as a protein supplement
was given only to treatment F.
Financial evaluation of the treatments was based on
EFS (Dexcel Farm Facts 7-3 2003/2004). Variables
related to the systems have been applied to the EFS of
the base system (system A).These were applied in order
of relationships between cow numbers or production
and costs from the Profit Watch database (Prewer pers.
comm.) (e.g. labour, scaled up accorded to SR;
machinery, scaled up accorded to MS production).
Supplements were measured as weight given to the
cows. The maize silage costs were taken from
ProfitWatch data (Leslie 1999) and were either
purchased ($0.24/kg DM/fed) or grown by the dairy
farmer on a runoff ($0.18 /kg DM/fed).
Economic farm surplus analysis does not account for
capital costs or returns, but does include plant
depreciation. Incorporating the capital items for each
system allows the ROA to be calculated (Table 2). All
operational and capital investments are included, with
appreciation/depreciation attached to all resources of the
system (ROA = operational return + capital return).
System sensitivity is tested by using a range of MS
payments, and dividing the resultant EFS by the total
Table 1 Resource efficient dairying trial design, area, SR and predicted feed inputs to achieve intensification
with a common CSR (85 kg LW/t DM).
Treatment Pasture Supplement Area Stocking rate
(t DM/ha) (t DM/ha pasture) (ha) (cows/ha pasture)
A. Control 17.5 0 7.0 3.0
B. Standoff pad 17.5 0 7.0 3.0
C. Low inputa 15.0 0 9.0 2.6
D. Low supplement 17.5 5* 5.5 (+1.1)c
3.8 (3.2)d
E. Moderate supplementb
20.5 10* 4.0 (+2.1) 5.2 (3.4)
F. High supplementb
20.5 20** 3.0 (+3.7) 6.9 (3.1)
a Treatment C has four replacement yearling heifers grazed on the farmlet (2.3 cows/ha, 2.6 allowing for heifers), and receives no N fertiliser.
b Farmlets E and F are irrigated during periods of water deficit.
c Area given as pasture grazed, and area required to grow supplement feed in parenthesis.
d Stocking rate expressed as grazed area, and total area shown in parenthesis.
* Maize silage fed in trolleys in paddock.
**Maize silage (19 t DM/ha/yr) + Soybean meal (1 t DM/ha/yr) fed in trolleys in paddock.
Resource Efficient Dairying trial: measurement criteria for farm systems over a range of resource use (R.N. Jensen et al) 49
feed provision. The regression equation can then be
obtained to define a breakeven MS payment and display
system risk exposure.
Results
Milksolids production/cow ranged from 363 to 427 kg,
forTreatments B and E respectively, as shown in Table
3. Milksolids yield/cow on treatment B was depressed
by the adverse effect of the feed pad management on
pasture quality (Jensen et al. 2004). The actual values
for CSR varied from the planned common values of
85 kg LW/t DM, due to higher than expected pasture
growths, and the resultant productive efficiencies are
shown.
Milksolids productions for each system, calculated
per hectare of pasture, and per total hectare, are shown in
Table 4.
Financial evaluation
Financial evaluation of the systems is presented in Table
5. Analysis has been made for payments of $3.50 and
$4.50 /kg MS, for maize silage costs of $0.18 and $0.24/
Table 2 Effect of dairy system intensification on financial depreciation and appreciation (crop area is excluded).
A B C D E F
Milking plant @ $5/kg MS ($/ha) 5658 5398 5012 7899 11327 13997
Depreciation @6% ($/ha) -339 -324 -301 -474 -680 -840
Machinery depreciation @ 14.78 c/kg MS ($/ha) -167 -160 -148 -234 -335 -414
Total depreciation ($/ha) -507 -483 -449 -707 -1014 -1254
Change compared to control (%) -5 -11 40 100 147
Land value $37340 37340 37340 37340 37340 37340 37340
Land value $18000 18000 18000 18000 18000 18000 18000
Land @ $37340 appreciating at 4% ($/ha/yr) 1494 1494 1494 1494 1494 1494
Land @ $18000 appreciating at 4% ($/ha/yr) 720 720 720 720 720 720
Shares @ $5/kg MS 5658 5398 5012 7899 11327 13997
Share appreciation rate (10%) 566 540 501 790 1133 1400
Cows @ $1020/cow x SR X 2.5% appreciation 76 76 59 98 132 176
Total appreciation (land @ $37340) $/ha/yr 2135 2109 2054 2381 2759 3069
Change compared to control (%) -1 -4 12 29 44
Table 3 Resource efficient dairying trial CSR (kg LW/t DM), MS yield (kg/cow), lactation length (days), FU (%
pasture eaten) and FCE (g MS/kg DM eaten) mean of two years - 2002/2003 & 2003/2004.
Treatment A B C D E F
Actual CSR 75 73 64 85 78 85
MS yield 390 363 424 411 427 416
Lactation length 268 263 274 273 280 271
FU 73 69 66 79 75 79
FCE 80 78 84 82 84 81
Table 4 Maize silage and soybean meal fed (t DM/farmlet/yr), area (ha) required to grow maize silage and
soybean meal (assuming yields of 24 and 4 t DM/ha respectively), MS yield (kg/cow) and MS yield (kg/
ha of pasture and kg/total ha) – mean of 2 years (2002/2003 & 2003/2004).
Treatment A B C D E F
Maize silage fed area (ha) 0 0 0 1.1 2.1 2.6
Soybean fed area (ha) 0 0 0 0 0 1.1
Total area (pasture + crop) 7.05 7.05 8.24 6.59 6.11 6.73
MS yield (kg/cow)* 390a
363a
424c
411b
427c
416b
MS yield (kg/ha of pasture) 1162 1087 987 1573 2215 2867
MS yield (kg/total ha)** 1162 1082 987 1345 1443 1254
* kg MS/cow SED= 14.9, figures with same letters are not significantly different.
** MS yield (kg/total ha) = MS production/actual area required to feed the herd (grazed pasture + cropped area).
50 Proceedings of the New Zealand Grassland Association 67: 47–52 (2005)
kg DM, and land prices of $18000 or $37000/ha. This
analysis is based on pasture area (i.e. cropped area
excluded).
System sensitivity results for the respective treatments
are shown as the return over the total feed provision (c/
kg DM). The trends for these systems as the payout
changes indicate variation in system sensitivity (Figure
1). The analysis clearly shows a variation in system
sensitivity by the difference in regression equations of:
Treatment C: y =5.2568 x –9.1087 (1)
Treatment F: y = 6.3777 x –22.458(2)
Where y = c/kg DM; and x = MS payout ($/kg)
By using equations 1, and 2, with $4.48 as the MS
payment the system feed profit (y) becomes $0.1446
and $0.0613 for treatments C and F respectively
(treatment F has 25.7 t DM/ha of additional feed (18.9 t
DM/ha cf 44.6 t DM/ha). When the feed input is
multiplied by these values the EFS for both systems is
$2738, however at $5.00/kg MS the EFS becomes $3254
and $4210 respectively. The low input system is less
responsive to a shift in payout (multiplier, slope) and
has lower overheads to recoup (adder value, rise).
Discussion
Increasing SR and feed inputs resulted in substantial
increases in MS yield/ha. Yield of MS/ total ha (pasture
+ crop) increased by 24% between Treatment A and E
compared with an increase of 91% when expressed as
MS/ha, of pasture only. Treatment C produced high MS/
cow due to high pasture allowance /cow. However, with
the lowest SR and low FU efficiency (66%), it had the
lowest MS/ha. Of the high input systems (D, E and F),
treatment E had the highest MS/cow, and also a relatively
high MS/ha because of its high SR. Treatment E achieved
high MS/cow and MS/ha through supplement input that
allowed a high FU efficiency of 75% leading to a high
FCE of 84 g MS/kg DM.
These findings agree with the relationship proposed
by Stockdale (1995) that efficient supplement input can
give high pasture utilisation rates and high producing
and efficient cows. For treatment C to obtain the high
DM intake (DMI) required for their level of production,
a high pasture allowance (70 kg DM/cow/day) of highly
digestible pasture (>11 MJ ME/kg DM) (Kolver &
Muller 1998) would be required. The high pasture
Table 5 Economic farm surplus ($/ha) and ROA (%); mean of 2 years from the RED trial (2002/2003 & 2003/
2004) for two sets of costs and returns.
Treatment A B C D E F
A: assumptions $4.50 kg MS, $0.18/kg DM maize silage, and land @ $37000/ha
EFS 2782 2454 2756 3284 3805 2787
ROA 9.1 8.4 9.3 9.5 9.6 7.2
B: assumptions $3.50 kg MS, $0.24/kg DM maize silage, and land $18000/ha
EFS 1613 1340 1760 1439 833 -1308
ROA 8.5 7.6 9.5 7.1 4.4 -1.4
Figure 1 Effect of payout on system feed profit of feed input (EFS/kg DM provision), based on supplement cost
of $0.18/ kg DM. Contrasts two treatments from the RED trial.
Resource Efficient Dairying trial: measurement criteria for farm systems over a range of resource use (R.N. Jensen et al) 51
allowance is evident as this treatment had an average
pasture mass that was consistently above that of the other
treatments. Dalleyet al. (1999) proposed that this would
be associated with an increase in pasture residual levels
from 1.8 t to2.7 t DM/ha to change the allowance from
20 to 70 kg DM/cow/day. Feed utilisation for this
treatment of 66% supports this relationship.
These results confirm the principle that a low SR will
result in high feed allowance/cow, high DMI,high MS
yield/cow, high FCE, low FU, and low MS/ha
(Macdonald et al. 2001). When the SR is increased
together with the use of imported feeds to supplement
pasture, DMI and MS/per cow, FCE and FU can all be
high, and result in high MS/ha.
Economic farm surplus and ROA were maximised
when cost effective supplements were used and the
payout was relatively high. Conversely a low input system
gave the greatest EFS and ROA when supplements were
more expensive, and the payout and land value were
low.
It is evident that the resource use is cost/return sensitive,
and while the analysis shown here is based on two cost/
return relationships it holds true that when the payout is
$3.50/kg MS the low input system is competitive
irrespective of land price ($18000 or $37000/ha) or
supplement cost ($0.18 or $0.24/kg DM). At a higher
payout of $4.50/kg MS, treatment E supplemented with
10 t maize silage/ha had the highest EFS irrespective of
supplement cost. The ROA showed a greater variation
due to land value. When the land value is low ($18000/
ha) the low input system had the highest ROA. When
the land is valued at $37340/ha, and the maize silage is
costed at $0.18/kg DM, treatment E has the highest ROA.
However when the maize silage is costed at $0.24/kg
DM, the ROA is highest for the low input system
(treatment C).
A change in the MS payout has a greater effect on the
EFS as the levels of supplement increase. Sensitivity
analysis showed that the low input system (treatment C)
is less sensitive to changes in MS payout, and has lower
system overheads to recover. This aspect is evident from
the regression equations (equations 1 & 2) in that both
the slope and rise for treatment C is less than F therefore
C will be profitable at lower $/kg MS and has lower
overhead costs to recoup than treatment F ($1.73 and
$3.52/kg MS respective breakeven points). High input
systems, treatments D and E are competitive at higher
MS payout, and these systems are affected less by a
payout change when maize silage cost is held at $0.18 /
kg DM. Return on assets analysis, which was based on
a land value of $18000/ha, follows the same trend as for
system EFS. However, if the land value is increased to
$37000/ha the high input treatment stocked at 5.3 cows/
ha shows a higher return at $4.50/kg MS and maize
silage costed at $0.18/kg DM. Effectively this is
comparing system profitability when the pasture cost
increases from $0.06/kg DM to $0.11/kg DM at land
prices of $18000 and $37340/ha respectively.
Summary
The management of these treatments is generating a wide
range in yields of MS/ha due to the large range in feed
imported to the milking platform. When physical
performance is related to the efficiency of MS production,
treatment E is consistently high in terms of pasture
utilisation and FCE. The low input system, (treatment
C), represents a low financial risk.
These systems are operating across divergent farming
philosophies, and market signals may indicate customer
preferences. The decision by farmers to adopt a particular
system will relate to their personal perspective on
environmental issues and to the economic evaluation of
the system (and others – labour, machinery, risk).
Intensifying dairy systems with higher SRs and more
supplementary feed can increase production up to 3000
kg MS/ha of pasture on the milking platform. When the
area used to grow the maize was included, the MS/ha of
intensive systems was increased by additional maize
silage input (+ 281 kg MS/ha; treatmentA cf E). However,
when the cost/return relationships were analysed,
diminishing returns occurred by intensifying above 5.2
cows/ha and 10 t DM maize silage/ha. The profitability
of these systems depended on the payout; pasture cost
(land price), and maize silage cost. This study highlights
that resources needed to support a system may affect its
viability and this needs to be explored further with
appropriate tools.
ACKNOWLEDGEMENTS
Thanks to Dexcel science, technical and Scott farm staff
and our funders, the Foundation for Research, Science
and Technology.
REFERENCES
Dalley,D.E.; Roche,J.R.; Grainger,C.; Moate, P.J. 1999.
Dry matter intake, nutrient selection and milk
production of dairy cows grazing rainfed perennial
pastures at different herbage allowances in spring.
Australian Journal of Experimental Agriculture 49:
923-931.
Deane, T. 1999. The profitable use of supplementary
feeds in pasture based dairy farm systems. Proceedings
of the Ruakura Dairy Farmers’ Conference 51: 64-
67.
Dexcel Farm Facts 7-3. Economic farm surplus, 2003/
2004. www.dexcel.co.nz/farmfacts.cfm.
Jensen, R.N.; Clark, D.A.; Macdonald, K.A. 2004.
Dairying intensification; production responses and
52 Proceedings of the New Zealand Grassland Association 67: 47–52 (2005)
financial implications. Proceedings of the Agronomy
Society of New Zealand 34: 13-20.
Jensen, R.N.; Beukes, P.; Clark, D.A.; Macdonald,
K.A. 2005. Modelling dairy system efficiencies.
Proceedings of the New Zealand Society of Animal
Production 65: 203-208.
Kolver, E.; Muller, L.D. 1998. Performance and
nutrient intake of high producing Holstein cows
consuming pasture or a total mixed ration. Journal of
Dairy Science 81: 1403-1411.
Macdonald, K.A.; Penno, J.W.; Nicholas, J. K.; Lile,
J.A.; Coulter, M.; Lancaster, J.A.S. 2001. Farm
systems – Impact of stocking rate on dairy farm
efficiency. Proceedings of the New Zealand
Grassland Association 63: 223-227.
Macdonald, K.A.; Thorrold, B.S.; Pryce. J. 2005.
Dexcel Holstein-Friesian strain trial-are all black and
whites created equally? Proceedings of Dairy3
3: 165-
174.
McDonald, P.; Edwards, R.A.; Greenhalgh, J.F.D.;
Morgan, C.A. 1995. Animal Nutrition., Longman
University Press, Singapore.
McMeekan, C.P. 1961. The pros and cons of high stocking
rate. Massey Dairy Farming Annual 13: 9-15.
National Research Council. 1987. Predicting feed intake
of food-producing animals. Subcommittee of Feed
Intake, Committee on Animal Nutrition, Board of
Agriculture, National Research Council. National
Academy Press. Washington DC. U.S.A. 96 pp.
Leslie, M. 1999. ProfitWatch program operation and
advisory definitions and standards for the
measurement of Economic Farm Surplus and
operation of ProfitWatch. Version 1.1. Livestock
ImprovementAdvisory.
Speight, S. 2002. A smarter way of looking at stocking
rate. Proceedings of the Ruakura Farmers’
Conference 54: 6-8.
Stockdale, C.R. 1995. Maize silage as a supplement for
pasture-fed dairy cows in early and late lactation.
Australian Journal of Experimental Agriculture 35:
19-26.
Van der Poel, J. 1997. Balancing the feed budget, a New
Zealand Perspective. Dairy Research Foundation,
University of Sydney. Vol. 2:92-101.

More Related Content

What's hot

Distillers grain protein quality for ruminants
Distillers grain protein quality for ruminantsDistillers grain protein quality for ruminants
Distillers grain protein quality for ruminantsFernando Diaz
 
Optimal nutrition management targets for the transition ewe: Lessons learned ...
Optimal nutrition management targets for the transition ewe: Lessons learned ...Optimal nutrition management targets for the transition ewe: Lessons learned ...
Optimal nutrition management targets for the transition ewe: Lessons learned ...Grey Bruce Farmers Week
 
Leach Bulletin112 milk from forage
Leach Bulletin112 milk from forageLeach Bulletin112 milk from forage
Leach Bulletin112 milk from forageGaëlle Feur
 
Improving whole Farm Forage Utilization for Sheep and Goat
Improving whole Farm Forage Utilization for Sheep and GoatImproving whole Farm Forage Utilization for Sheep and Goat
Improving whole Farm Forage Utilization for Sheep and GoatGrey Bruce Farmers Week
 
Disappearance of infused phytate from the large intestine of dairy heifers
Disappearance of infused phytate from the large intestine of dairy heifersDisappearance of infused phytate from the large intestine of dairy heifers
Disappearance of infused phytate from the large intestine of dairy heifersPartha Ray
 
Validation of the dry matter intake formula of Spartan 3 Ration Evaluator / B...
Validation of the dry matter intake formula of Spartan 3 Ration Evaluator / B...Validation of the dry matter intake formula of Spartan 3 Ration Evaluator / B...
Validation of the dry matter intake formula of Spartan 3 Ration Evaluator / B...nacaa
 
Dairy Production on Pasture: An Introduction to Grass-Based and Seasonal Dair...
Dairy Production on Pasture: An Introduction to Grass-Based and Seasonal Dair...Dairy Production on Pasture: An Introduction to Grass-Based and Seasonal Dair...
Dairy Production on Pasture: An Introduction to Grass-Based and Seasonal Dair...ElisaMendelsohn
 
Effect of dietary phytate on phosphorus digestibility in dairy cows
Effect of dietary phytate on phosphorus digestibility in dairy cowsEffect of dietary phytate on phosphorus digestibility in dairy cows
Effect of dietary phytate on phosphorus digestibility in dairy cowsPartha Ray
 
How Low Can We Go: Nitrogen in Dairy Rations- Mike Van Amburgh
How Low Can We Go: Nitrogen in Dairy Rations- Mike Van AmburghHow Low Can We Go: Nitrogen in Dairy Rations- Mike Van Amburgh
How Low Can We Go: Nitrogen in Dairy Rations- Mike Van AmburghDAIReXNET
 
Littertreat litter2 feed
Littertreat litter2 feedLittertreat litter2 feed
Littertreat litter2 feedDVS BioLife Ltd
 
Commercial poultry nutritio
Commercial poultry nutritioCommercial poultry nutritio
Commercial poultry nutritioDr. Waqas Nawaz
 
FITT Report 13FT11 Grass factory New Zealand- weekly pasture dry matter measu...
FITT Report 13FT11 Grass factory New Zealand- weekly pasture dry matter measu...FITT Report 13FT11 Grass factory New Zealand- weekly pasture dry matter measu...
FITT Report 13FT11 Grass factory New Zealand- weekly pasture dry matter measu...Donald Martin
 
Dr. Michael Lee - Capstone Address - Sustainability Metrics Associated With P...
Dr. Michael Lee - Capstone Address - Sustainability Metrics Associated With P...Dr. Michael Lee - Capstone Address - Sustainability Metrics Associated With P...
Dr. Michael Lee - Capstone Address - Sustainability Metrics Associated With P...John Blue
 
Concept of restricted energy in dairy cattle
Concept of restricted energy in dairy cattle Concept of restricted energy in dairy cattle
Concept of restricted energy in dairy cattle Muhammad Naveed ul Haque
 
Dr. Alison Van Eenennaam - Were Those the Days? Animal Ag Then & Now
Dr. Alison Van Eenennaam - Were Those the Days? Animal Ag Then & NowDr. Alison Van Eenennaam - Were Those the Days? Animal Ag Then & Now
Dr. Alison Van Eenennaam - Were Those the Days? Animal Ag Then & NowJohn Blue
 
Optimizing Production by Managing How Dairy Cows Eat
Optimizing Production by Managing How Dairy Cows EatOptimizing Production by Managing How Dairy Cows Eat
Optimizing Production by Managing How Dairy Cows EatDAIReXNET
 
current trends in research on grain processing technologies
current trends in research on grain processing technologies current trends in research on grain processing technologies
current trends in research on grain processing technologies SureshRamalingam12
 
Profit through adopting technology in dairy herds
Profit through adopting technology in dairy herdsProfit through adopting technology in dairy herds
Profit through adopting technology in dairy herdsJack Britt
 

What's hot (20)

Distillers grain protein quality for ruminants
Distillers grain protein quality for ruminantsDistillers grain protein quality for ruminants
Distillers grain protein quality for ruminants
 
Optimal nutrition management targets for the transition ewe: Lessons learned ...
Optimal nutrition management targets for the transition ewe: Lessons learned ...Optimal nutrition management targets for the transition ewe: Lessons learned ...
Optimal nutrition management targets for the transition ewe: Lessons learned ...
 
Leach Bulletin112 milk from forage
Leach Bulletin112 milk from forageLeach Bulletin112 milk from forage
Leach Bulletin112 milk from forage
 
Improving whole Farm Forage Utilization for Sheep and Goat
Improving whole Farm Forage Utilization for Sheep and GoatImproving whole Farm Forage Utilization for Sheep and Goat
Improving whole Farm Forage Utilization for Sheep and Goat
 
Disappearance of infused phytate from the large intestine of dairy heifers
Disappearance of infused phytate from the large intestine of dairy heifersDisappearance of infused phytate from the large intestine of dairy heifers
Disappearance of infused phytate from the large intestine of dairy heifers
 
Validation of the dry matter intake formula of Spartan 3 Ration Evaluator / B...
Validation of the dry matter intake formula of Spartan 3 Ration Evaluator / B...Validation of the dry matter intake formula of Spartan 3 Ration Evaluator / B...
Validation of the dry matter intake formula of Spartan 3 Ration Evaluator / B...
 
Dairy Production on Pasture: An Introduction to Grass-Based and Seasonal Dair...
Dairy Production on Pasture: An Introduction to Grass-Based and Seasonal Dair...Dairy Production on Pasture: An Introduction to Grass-Based and Seasonal Dair...
Dairy Production on Pasture: An Introduction to Grass-Based and Seasonal Dair...
 
Effect of dietary phytate on phosphorus digestibility in dairy cows
Effect of dietary phytate on phosphorus digestibility in dairy cowsEffect of dietary phytate on phosphorus digestibility in dairy cows
Effect of dietary phytate on phosphorus digestibility in dairy cows
 
How Low Can We Go: Nitrogen in Dairy Rations- Mike Van Amburgh
How Low Can We Go: Nitrogen in Dairy Rations- Mike Van AmburghHow Low Can We Go: Nitrogen in Dairy Rations- Mike Van Amburgh
How Low Can We Go: Nitrogen in Dairy Rations- Mike Van Amburgh
 
Importance of Seven Days Poultry Chicks Weight
Importance of Seven Days Poultry Chicks WeightImportance of Seven Days Poultry Chicks Weight
Importance of Seven Days Poultry Chicks Weight
 
Littertreat litter2 feed
Littertreat litter2 feedLittertreat litter2 feed
Littertreat litter2 feed
 
Factors Affecting Feed Intake in Poultry.
Factors Affecting Feed Intake in Poultry.Factors Affecting Feed Intake in Poultry.
Factors Affecting Feed Intake in Poultry.
 
Commercial poultry nutritio
Commercial poultry nutritioCommercial poultry nutritio
Commercial poultry nutritio
 
FITT Report 13FT11 Grass factory New Zealand- weekly pasture dry matter measu...
FITT Report 13FT11 Grass factory New Zealand- weekly pasture dry matter measu...FITT Report 13FT11 Grass factory New Zealand- weekly pasture dry matter measu...
FITT Report 13FT11 Grass factory New Zealand- weekly pasture dry matter measu...
 
Dr. Michael Lee - Capstone Address - Sustainability Metrics Associated With P...
Dr. Michael Lee - Capstone Address - Sustainability Metrics Associated With P...Dr. Michael Lee - Capstone Address - Sustainability Metrics Associated With P...
Dr. Michael Lee - Capstone Address - Sustainability Metrics Associated With P...
 
Concept of restricted energy in dairy cattle
Concept of restricted energy in dairy cattle Concept of restricted energy in dairy cattle
Concept of restricted energy in dairy cattle
 
Dr. Alison Van Eenennaam - Were Those the Days? Animal Ag Then & Now
Dr. Alison Van Eenennaam - Were Those the Days? Animal Ag Then & NowDr. Alison Van Eenennaam - Were Those the Days? Animal Ag Then & Now
Dr. Alison Van Eenennaam - Were Those the Days? Animal Ag Then & Now
 
Optimizing Production by Managing How Dairy Cows Eat
Optimizing Production by Managing How Dairy Cows EatOptimizing Production by Managing How Dairy Cows Eat
Optimizing Production by Managing How Dairy Cows Eat
 
current trends in research on grain processing technologies
current trends in research on grain processing technologies current trends in research on grain processing technologies
current trends in research on grain processing technologies
 
Profit through adopting technology in dairy herds
Profit through adopting technology in dairy herdsProfit through adopting technology in dairy herds
Profit through adopting technology in dairy herds
 

Viewers also liked

Học trường công lập Singapore
Học trường công lập SingaporeHọc trường công lập Singapore
Học trường công lập SingaporeLe Hung
 
01 26 16 strategic planning slides
01 26 16 strategic planning slides01 26 16 strategic planning slides
01 26 16 strategic planning slidesJoey Pauley, M.A.
 
Hadasit EPO Reply to Pfizer et al IP Opposition Feb 2016
Hadasit EPO Reply to Pfizer et al IP Opposition Feb 2016Hadasit EPO Reply to Pfizer et al IP Opposition Feb 2016
Hadasit EPO Reply to Pfizer et al IP Opposition Feb 2016ms emporda
 
Slideshow powerpoint
Slideshow powerpointSlideshow powerpoint
Slideshow powerpointEselKadir
 
سجنك حرية | قضية قتل الحارس - الحقيقة كاملة
سجنك حرية | قضية قتل الحارس - الحقيقة كاملةسجنك حرية | قضية قتل الحارس - الحقيقة كاملة
سجنك حرية | قضية قتل الحارس - الحقيقة كاملةseg7oryyah
 
به نام خدا
به نام خدابه نام خدا
به نام خداLampesht
 
ISSCR Guidelines for Stem Cell Science and Clinical Translation
ISSCR Guidelines for Stem Cell Science and Clinical TranslationISSCR Guidelines for Stem Cell Science and Clinical Translation
ISSCR Guidelines for Stem Cell Science and Clinical Translationms emporda
 
02- Hope ZWCAD+ Brochure - 2015
02- Hope ZWCAD+ Brochure - 201502- Hope ZWCAD+ Brochure - 2015
02- Hope ZWCAD+ Brochure - 2015Hope India
 
CV of Jianyu Hu (contact info not included)
CV of Jianyu Hu (contact info not included)CV of Jianyu Hu (contact info not included)
CV of Jianyu Hu (contact info not included)Jianyu (Ken) Hu
 
Schedule
ScheduleSchedule
ScheduleU_henry
 
EMGOLDEX - BUSINESS FOR THIS WORLD
EMGOLDEX - BUSINESS FOR THIS WORLDEMGOLDEX - BUSINESS FOR THIS WORLD
EMGOLDEX - BUSINESS FOR THIS WORLDNikunj Chohan
 
Debbie Bieller's Resume 5.1.14
Debbie Bieller's Resume 5.1.14Debbie Bieller's Resume 5.1.14
Debbie Bieller's Resume 5.1.14Debbie Hopkins
 

Viewers also liked (19)

Học trường công lập Singapore
Học trường công lập SingaporeHọc trường công lập Singapore
Học trường công lập Singapore
 
Setiap orang
Setiap orangSetiap orang
Setiap orang
 
NYT Bennington
NYT BenningtonNYT Bennington
NYT Bennington
 
amit
amitamit
amit
 
01 26 16 strategic planning slides
01 26 16 strategic planning slides01 26 16 strategic planning slides
01 26 16 strategic planning slides
 
Hadasit EPO Reply to Pfizer et al IP Opposition Feb 2016
Hadasit EPO Reply to Pfizer et al IP Opposition Feb 2016Hadasit EPO Reply to Pfizer et al IP Opposition Feb 2016
Hadasit EPO Reply to Pfizer et al IP Opposition Feb 2016
 
Slideshow powerpoint
Slideshow powerpointSlideshow powerpoint
Slideshow powerpoint
 
سجنك حرية | قضية قتل الحارس - الحقيقة كاملة
سجنك حرية | قضية قتل الحارس - الحقيقة كاملةسجنك حرية | قضية قتل الحارس - الحقيقة كاملة
سجنك حرية | قضية قتل الحارس - الحقيقة كاملة
 
به نام خدا
به نام خدابه نام خدا
به نام خدا
 
Omtrek puntenverzameling v2
Omtrek puntenverzameling v2Omtrek puntenverzameling v2
Omtrek puntenverzameling v2
 
ISSCR Guidelines for Stem Cell Science and Clinical Translation
ISSCR Guidelines for Stem Cell Science and Clinical TranslationISSCR Guidelines for Stem Cell Science and Clinical Translation
ISSCR Guidelines for Stem Cell Science and Clinical Translation
 
Darshana resume
Darshana resumeDarshana resume
Darshana resume
 
02- Hope ZWCAD+ Brochure - 2015
02- Hope ZWCAD+ Brochure - 201502- Hope ZWCAD+ Brochure - 2015
02- Hope ZWCAD+ Brochure - 2015
 
yasser osama C.V
yasser osama C.Vyasser osama C.V
yasser osama C.V
 
A Snapshot of Minecraft
A Snapshot of MinecraftA Snapshot of Minecraft
A Snapshot of Minecraft
 
CV of Jianyu Hu (contact info not included)
CV of Jianyu Hu (contact info not included)CV of Jianyu Hu (contact info not included)
CV of Jianyu Hu (contact info not included)
 
Schedule
ScheduleSchedule
Schedule
 
EMGOLDEX - BUSINESS FOR THIS WORLD
EMGOLDEX - BUSINESS FOR THIS WORLDEMGOLDEX - BUSINESS FOR THIS WORLD
EMGOLDEX - BUSINESS FOR THIS WORLD
 
Debbie Bieller's Resume 5.1.14
Debbie Bieller's Resume 5.1.14Debbie Bieller's Resume 5.1.14
Debbie Bieller's Resume 5.1.14
 

Similar to nzgrassland_publication_188

IFS act as new resources
 IFS act as new resources IFS act as new resources
IFS act as new resourcesHARISH J
 
Eco-Intensification - the science of organic farming: A guide to climate resi...
Eco-Intensification - the science of organic farming: A guide to climate resi...Eco-Intensification - the science of organic farming: A guide to climate resi...
Eco-Intensification - the science of organic farming: A guide to climate resi...IFOAM
 
Proposed contributions of Africa RISING for AICCRA small ruminant value chain...
Proposed contributions of Africa RISING for AICCRA small ruminant value chain...Proposed contributions of Africa RISING for AICCRA small ruminant value chain...
Proposed contributions of Africa RISING for AICCRA small ruminant value chain...africa-rising
 
Effect of Potato Meal on Broiler Production
Effect of Potato Meal on Broiler ProductionEffect of Potato Meal on Broiler Production
Effect of Potato Meal on Broiler ProductionNazmus Sakib
 
Effect of potato (Solanum tuberosum) meal on broiler production
Effect of potato (Solanum tuberosum) meal on broiler productionEffect of potato (Solanum tuberosum) meal on broiler production
Effect of potato (Solanum tuberosum) meal on broiler productionNazmus Sakib
 
Study of Intake, Growth and Nutrient Utilization of Growing Bulls Fed Forages...
Study of Intake, Growth and Nutrient Utilization of Growing Bulls Fed Forages...Study of Intake, Growth and Nutrient Utilization of Growing Bulls Fed Forages...
Study of Intake, Growth and Nutrient Utilization of Growing Bulls Fed Forages...IJEAB
 
Experiences irrigated forages
Experiences irrigated forages Experiences irrigated forages
Experiences irrigated forages ILRI
 
The inclusion of Leucaena diversifolia in Colombian cattle systems: An econom...
The inclusion of Leucaena diversifolia in Colombian cattle systems: An econom...The inclusion of Leucaena diversifolia in Colombian cattle systems: An econom...
The inclusion of Leucaena diversifolia in Colombian cattle systems: An econom...Tropical Forages Program
 
Sistema con leguminosa_JLU.pdf
Sistema con leguminosa_JLU.pdfSistema con leguminosa_JLU.pdf
Sistema con leguminosa_JLU.pdfRubicel Vidal
 
Reducing enteric methane for improving food security and livelihoods
Reducing enteric methane for improving food security and livelihoodsReducing enteric methane for improving food security and livelihoods
Reducing enteric methane for improving food security and livelihoodsNew Food Innovation Ltd
 
Environmentally sustainable dairy farming in East Africa
Environmentally sustainable dairy farming in East AfricaEnvironmentally sustainable dairy farming in East Africa
Environmentally sustainable dairy farming in East AfricaProDairy E.A. Ltd
 
Integration with livestock
Integration with livestockIntegration with livestock
Integration with livestockFAO
 
GGAA_2013_Conference_v4_6-14-13
GGAA_2013_Conference_v4_6-14-13GGAA_2013_Conference_v4_6-14-13
GGAA_2013_Conference_v4_6-14-13Marion Deerhake
 
Annual Biomass Production, Chemical Composition and In- sacco Degradability o...
Annual Biomass Production, Chemical Composition and In- sacco Degradability o...Annual Biomass Production, Chemical Composition and In- sacco Degradability o...
Annual Biomass Production, Chemical Composition and In- sacco Degradability o...IJEAB
 
Anaerobic Digestion of Animal Wastes: Factors to Consider
Anaerobic Digestion of Animal Wastes: Factors to ConsiderAnaerobic Digestion of Animal Wastes: Factors to Consider
Anaerobic Digestion of Animal Wastes: Factors to ConsiderGardening
 
Residuces in milk and production - Mukesh
Residuces in milk and production -  MukeshResiduces in milk and production -  Mukesh
Residuces in milk and production - MukeshDr. Mukesh Raikwar
 

Similar to nzgrassland_publication_188 (20)

Towards climate smart livestock systems in Tanzania
Towards climate smart livestock systems in TanzaniaTowards climate smart livestock systems in Tanzania
Towards climate smart livestock systems in Tanzania
 
IFS act as new resources
 IFS act as new resources IFS act as new resources
IFS act as new resources
 
Eco-Intensification - the science of organic farming: A guide to climate resi...
Eco-Intensification - the science of organic farming: A guide to climate resi...Eco-Intensification - the science of organic farming: A guide to climate resi...
Eco-Intensification - the science of organic farming: A guide to climate resi...
 
Proposed contributions of Africa RISING for AICCRA small ruminant value chain...
Proposed contributions of Africa RISING for AICCRA small ruminant value chain...Proposed contributions of Africa RISING for AICCRA small ruminant value chain...
Proposed contributions of Africa RISING for AICCRA small ruminant value chain...
 
Effect of Potato Meal on Broiler Production
Effect of Potato Meal on Broiler ProductionEffect of Potato Meal on Broiler Production
Effect of Potato Meal on Broiler Production
 
Effect of potato (Solanum tuberosum) meal on broiler production
Effect of potato (Solanum tuberosum) meal on broiler productionEffect of potato (Solanum tuberosum) meal on broiler production
Effect of potato (Solanum tuberosum) meal on broiler production
 
Study of Intake, Growth and Nutrient Utilization of Growing Bulls Fed Forages...
Study of Intake, Growth and Nutrient Utilization of Growing Bulls Fed Forages...Study of Intake, Growth and Nutrient Utilization of Growing Bulls Fed Forages...
Study of Intake, Growth and Nutrient Utilization of Growing Bulls Fed Forages...
 
Experiences irrigated forages
Experiences irrigated forages Experiences irrigated forages
Experiences irrigated forages
 
The inclusion of Leucaena diversifolia in Colombian cattle systems: An econom...
The inclusion of Leucaena diversifolia in Colombian cattle systems: An econom...The inclusion of Leucaena diversifolia in Colombian cattle systems: An econom...
The inclusion of Leucaena diversifolia in Colombian cattle systems: An econom...
 
Sistema con leguminosa_JLU.pdf
Sistema con leguminosa_JLU.pdfSistema con leguminosa_JLU.pdf
Sistema con leguminosa_JLU.pdf
 
Reducing enteric methane for improving food security and livelihoods
Reducing enteric methane for improving food security and livelihoodsReducing enteric methane for improving food security and livelihoods
Reducing enteric methane for improving food security and livelihoods
 
Environmentally sustainable dairy farming in East Africa
Environmentally sustainable dairy farming in East AfricaEnvironmentally sustainable dairy farming in East Africa
Environmentally sustainable dairy farming in East Africa
 
Integration with livestock
Integration with livestockIntegration with livestock
Integration with livestock
 
Learning Event No. 3, Session 2: Blummel - Crop Improvement. ARDD2012 Rio
Learning Event No. 3, Session 2: Blummel - Crop Improvement. ARDD2012 RioLearning Event No. 3, Session 2: Blummel - Crop Improvement. ARDD2012 Rio
Learning Event No. 3, Session 2: Blummel - Crop Improvement. ARDD2012 Rio
 
brochure_enteric-logos
brochure_enteric-logosbrochure_enteric-logos
brochure_enteric-logos
 
GGAA_2013_Conference_v4_6-14-13
GGAA_2013_Conference_v4_6-14-13GGAA_2013_Conference_v4_6-14-13
GGAA_2013_Conference_v4_6-14-13
 
Annual Biomass Production, Chemical Composition and In- sacco Degradability o...
Annual Biomass Production, Chemical Composition and In- sacco Degradability o...Annual Biomass Production, Chemical Composition and In- sacco Degradability o...
Annual Biomass Production, Chemical Composition and In- sacco Degradability o...
 
Anaerobic Digestion of Animal Wastes: Factors to Consider
Anaerobic Digestion of Animal Wastes: Factors to ConsiderAnaerobic Digestion of Animal Wastes: Factors to Consider
Anaerobic Digestion of Animal Wastes: Factors to Consider
 
Residuces in milk and production - Mukesh
Residuces in milk and production -  MukeshResiduces in milk and production -  Mukesh
Residuces in milk and production - Mukesh
 
P i
P iP i
P i
 

nzgrassland_publication_188

  • 1. 47 Abstract The aim of the Resource Efficient Dairying (RED) trial is to measure the productivity, economic and environmental effects of different feed inputs and management processes on a dairy farm. This is a long- term systems trial located at Scott Farm (Dexcel Research Farm) established on 1st June 2001 and expected to continue until 2006. Trial design was based on six systems that have an allowance of up to 200 kg nitrogen (N)/ha (excluding the low input treatment). They are: low input (no N fertiliser, heifers grazed-on and 2.3 cows/ha); control (3 cows/ha); standoff (3 cows/ha); low supplement input (5 t dry matter (DM) maize silage/ha, 3.8 cows/ha); moderate supplement input (10 t DM maize silage/ha; 5.2 cows/ha); and high supplement input (15 t DM maize silage + 5 t soymeal/ha; 6.9 cows/ha). The last two systems have irrigation available to boost pasture production. All systems were designed to operate at a common comparative stocking rate (CSR) of 85 kg liveweight (LW)/t DM. Two seasons’ data have shown that increasing the stocking rate (SR) by 1.5 cows/ha from 3.8 to 5.3 cows/ha, plus extra feed, increased output by 90 and 184 kg milksolids (MS)/total ha in the two years, when the extra area required to supply the extra feed is included in the calculation of kg MS/ha. However the further increase to 6.9 cows/ha plus extra feed produced less MS/total ha than the system stocked at 3.8 cows/ha. Calculations of economic farm surplus (EFS) and return on assets (ROA) reveal that when the payout is $3.50/kg MS the low input system is competitive irrespective of land price ($18000 or $37000/ha) or supplement cost (18 c or 24 c/kg DM). Conversely at a higher payout of $4.50/kg MS the treatment supplementedwith10tmaizesilageDM/haiscompetitive over the range of land prices and supplement costs tested. Keywords: dairy cows, economic evaluation, maize silage, milksolids, nitrogen fertiliser, stocking rate Introduction Farmers have developed a range of dairy production systems suitable to the strategic plans for their farms, which is often governed by the physical aspects and climate of the area. Systems include low input, self- contained; grazing dry stock off-farm; increasing feed grown on-farm with the aid of irrigation, cropping or N fertiliser; and importing feed from off-farm sources. The higher input systems have developed where: Resource Efficient Dairying trial: measurement criteria for farm systems over a range of resource use R.N. JENSEN, D.A. CLARK and K.A. MACDONALD Dexcel, PB 3221, Hamilton rodger.jensen@dexcel.co.nz • Marginal returns on extra milk production are greater than marginal cost of extra feed • They allow more profitable use of existing land, cows, plant, and labour • Farmers wish to avoid the risk and cost associated with buying more land • Farmers wish to reduce production variation between seasons • Farmers wish to acquire additional Fonterra shares. Milksolids/ha is the product of SR, expressed as cows per hectare, and MS per cow, and increasing either or both will increase MS per hectare, provided that sufficient feed per hectare is provided to avoid the negative relationship between SR and production/cow (McMeekan 1961). Supplement brought onto the farm will support high MS production per cow and per ha at the high SRs needed to achieve high levels of pasture utilisation (Stockdale 1995). Supplement input to a system can be used to control pasture residuals and maintain pasture conditions for optimal growth (Van der Poel 1997). In addition, supplements allow for a higher SR that would increase pasture utilisation and extend lactation thereby achieving high MS responses to supplements (Deane 1999). Supplements will increase the total farm feed supply, and may prevent periods of underfeeding of the cows, which would otherwise have occurred at the higher stocking rate. The MS/cow response can be optimised by high breeding worth (BW) cows, which give higher responses to extra feed at higher yields per cow than low BW cows (Macdonald et al. 2005). The RED trial was designed to monitor the effects on MS production, economic performance and environmental impacts of increasing feed inputs into pastoral based dairy systems. Materials and methods The six experimental farmlets are located at Dexcel’s Scott Research Farm, Newstead,Hamilton.All treatments are designed to offer a CSR of 85 kg LW/t total DM, the level at which EFS is optimised (Speight 2002). Feed inputs and SR/ha (ha of home pasture) are shown in Table 1. The CSR is based on an average LW of 500 kg per cow. Treatment herds of 21 Holstein-Friesian cows were established on 1st June 2001, and were balanced for age, expected calving date,LW, condition score,BW and somatic cell count.Annual culling allows for 25%
  • 2. 48 Proceedings of the New Zealand Grassland Association 67: 47–52 (2005) replacements entering each herd per year. Treatment B has a standoff pad that is utilised in late-winter and early- spring, under a set of decision rules intended to decrease nitrate leaching from the farmlet paddocks, and to minimise pugging damage and protect soil structure. Treatment C has four replacement yearling heifers grazed on the farmlet. The pastures were sown in May 2000 with 18 kg/ha Bronsyn perennial ryegrass (Lolium perenne), 1.5 kg/ ha Grasslands Sustain white clover (Trifolium repens) and 1.5 kg/ha Aran white clover (Trifolium repens).All treatments except treatment C receive up to 200 kg N/ha annually. Pasture mass is assessed visually each week, and calibrated against actual mass cut from ten quadrats (each 0.2 m2 ), four post-grazing and six pre-grazing. The quadrats are cut to ground level with an electric handpiece, washed and oven dried for 48 hours at 105°C. Pasture and supplement are sampled monthly for feed quality analysis by near infrared spectrometry (NIRS). System efficiencies, feed utilisation (FU, kg DM eaten/ kg DM grown) and feed conversion efficiency (FCE, kg MS/t DM eaten) were calculated. The calculation was based on pasture mass grown (from visual estimation) and MS production. Factorial energy requirements were summed for each treatment based on cow LW and production level (McDonald et al. 1995). The energy content (MJ ME/kg DM) of the respective treatments (obtained from NIRS analysis) was used to define the quantity of DM required (Jensen et al. 2005). Milk yield/cow was measured by weekly herd tests, with samples analysed to determine crude protein, fat and lactose concentration using a Milkoscan 133B analyser (Foss Electric, Denmark). For treatments D, E, and F the calculated area required to grow the maize silage and the soybean used were added to the farmlet area of pasture to give total area required to support the cows on that farmlet. Milksolids yields for these treatments were calculated as MS/cow x cows/total area (area of farmlet plus cropped area). Live weight and condition score of each cow were measured fortnightly at the morning milking. Cow health was closely monitored throughout the trial, and a proactive animal husbandry policy applied across all herds (e.g. in-line dispensing of bloat oil and zinc for prevention of bloat and facial eczema respectively,during susceptible periods). For the supplemented herds, a ration-balancing model based on NRC data (NRC 1987) was used to ensure that cows were offered appropriate mineral and protein supplements to complement the maize silage. However, soybean meal as a protein supplement was given only to treatment F. Financial evaluation of the treatments was based on EFS (Dexcel Farm Facts 7-3 2003/2004). Variables related to the systems have been applied to the EFS of the base system (system A).These were applied in order of relationships between cow numbers or production and costs from the Profit Watch database (Prewer pers. comm.) (e.g. labour, scaled up accorded to SR; machinery, scaled up accorded to MS production). Supplements were measured as weight given to the cows. The maize silage costs were taken from ProfitWatch data (Leslie 1999) and were either purchased ($0.24/kg DM/fed) or grown by the dairy farmer on a runoff ($0.18 /kg DM/fed). Economic farm surplus analysis does not account for capital costs or returns, but does include plant depreciation. Incorporating the capital items for each system allows the ROA to be calculated (Table 2). All operational and capital investments are included, with appreciation/depreciation attached to all resources of the system (ROA = operational return + capital return). System sensitivity is tested by using a range of MS payments, and dividing the resultant EFS by the total Table 1 Resource efficient dairying trial design, area, SR and predicted feed inputs to achieve intensification with a common CSR (85 kg LW/t DM). Treatment Pasture Supplement Area Stocking rate (t DM/ha) (t DM/ha pasture) (ha) (cows/ha pasture) A. Control 17.5 0 7.0 3.0 B. Standoff pad 17.5 0 7.0 3.0 C. Low inputa 15.0 0 9.0 2.6 D. Low supplement 17.5 5* 5.5 (+1.1)c 3.8 (3.2)d E. Moderate supplementb 20.5 10* 4.0 (+2.1) 5.2 (3.4) F. High supplementb 20.5 20** 3.0 (+3.7) 6.9 (3.1) a Treatment C has four replacement yearling heifers grazed on the farmlet (2.3 cows/ha, 2.6 allowing for heifers), and receives no N fertiliser. b Farmlets E and F are irrigated during periods of water deficit. c Area given as pasture grazed, and area required to grow supplement feed in parenthesis. d Stocking rate expressed as grazed area, and total area shown in parenthesis. * Maize silage fed in trolleys in paddock. **Maize silage (19 t DM/ha/yr) + Soybean meal (1 t DM/ha/yr) fed in trolleys in paddock.
  • 3. Resource Efficient Dairying trial: measurement criteria for farm systems over a range of resource use (R.N. Jensen et al) 49 feed provision. The regression equation can then be obtained to define a breakeven MS payment and display system risk exposure. Results Milksolids production/cow ranged from 363 to 427 kg, forTreatments B and E respectively, as shown in Table 3. Milksolids yield/cow on treatment B was depressed by the adverse effect of the feed pad management on pasture quality (Jensen et al. 2004). The actual values for CSR varied from the planned common values of 85 kg LW/t DM, due to higher than expected pasture growths, and the resultant productive efficiencies are shown. Milksolids productions for each system, calculated per hectare of pasture, and per total hectare, are shown in Table 4. Financial evaluation Financial evaluation of the systems is presented in Table 5. Analysis has been made for payments of $3.50 and $4.50 /kg MS, for maize silage costs of $0.18 and $0.24/ Table 2 Effect of dairy system intensification on financial depreciation and appreciation (crop area is excluded). A B C D E F Milking plant @ $5/kg MS ($/ha) 5658 5398 5012 7899 11327 13997 Depreciation @6% ($/ha) -339 -324 -301 -474 -680 -840 Machinery depreciation @ 14.78 c/kg MS ($/ha) -167 -160 -148 -234 -335 -414 Total depreciation ($/ha) -507 -483 -449 -707 -1014 -1254 Change compared to control (%) -5 -11 40 100 147 Land value $37340 37340 37340 37340 37340 37340 37340 Land value $18000 18000 18000 18000 18000 18000 18000 Land @ $37340 appreciating at 4% ($/ha/yr) 1494 1494 1494 1494 1494 1494 Land @ $18000 appreciating at 4% ($/ha/yr) 720 720 720 720 720 720 Shares @ $5/kg MS 5658 5398 5012 7899 11327 13997 Share appreciation rate (10%) 566 540 501 790 1133 1400 Cows @ $1020/cow x SR X 2.5% appreciation 76 76 59 98 132 176 Total appreciation (land @ $37340) $/ha/yr 2135 2109 2054 2381 2759 3069 Change compared to control (%) -1 -4 12 29 44 Table 3 Resource efficient dairying trial CSR (kg LW/t DM), MS yield (kg/cow), lactation length (days), FU (% pasture eaten) and FCE (g MS/kg DM eaten) mean of two years - 2002/2003 & 2003/2004. Treatment A B C D E F Actual CSR 75 73 64 85 78 85 MS yield 390 363 424 411 427 416 Lactation length 268 263 274 273 280 271 FU 73 69 66 79 75 79 FCE 80 78 84 82 84 81 Table 4 Maize silage and soybean meal fed (t DM/farmlet/yr), area (ha) required to grow maize silage and soybean meal (assuming yields of 24 and 4 t DM/ha respectively), MS yield (kg/cow) and MS yield (kg/ ha of pasture and kg/total ha) – mean of 2 years (2002/2003 & 2003/2004). Treatment A B C D E F Maize silage fed area (ha) 0 0 0 1.1 2.1 2.6 Soybean fed area (ha) 0 0 0 0 0 1.1 Total area (pasture + crop) 7.05 7.05 8.24 6.59 6.11 6.73 MS yield (kg/cow)* 390a 363a 424c 411b 427c 416b MS yield (kg/ha of pasture) 1162 1087 987 1573 2215 2867 MS yield (kg/total ha)** 1162 1082 987 1345 1443 1254 * kg MS/cow SED= 14.9, figures with same letters are not significantly different. ** MS yield (kg/total ha) = MS production/actual area required to feed the herd (grazed pasture + cropped area).
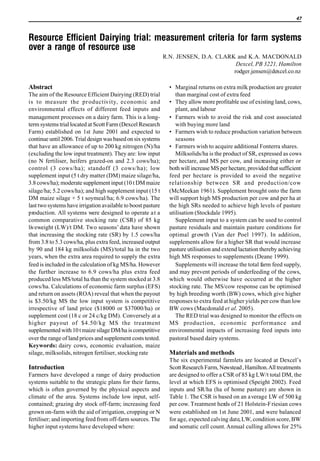
  • 4. 50 Proceedings of the New Zealand Grassland Association 67: 47–52 (2005) kg DM, and land prices of $18000 or $37000/ha. This analysis is based on pasture area (i.e. cropped area excluded). System sensitivity results for the respective treatments are shown as the return over the total feed provision (c/ kg DM). The trends for these systems as the payout changes indicate variation in system sensitivity (Figure 1). The analysis clearly shows a variation in system sensitivity by the difference in regression equations of: Treatment C: y =5.2568 x –9.1087 (1) Treatment F: y = 6.3777 x –22.458(2) Where y = c/kg DM; and x = MS payout ($/kg) By using equations 1, and 2, with $4.48 as the MS payment the system feed profit (y) becomes $0.1446 and $0.0613 for treatments C and F respectively (treatment F has 25.7 t DM/ha of additional feed (18.9 t DM/ha cf 44.6 t DM/ha). When the feed input is multiplied by these values the EFS for both systems is $2738, however at $5.00/kg MS the EFS becomes $3254 and $4210 respectively. The low input system is less responsive to a shift in payout (multiplier, slope) and has lower overheads to recoup (adder value, rise). Discussion Increasing SR and feed inputs resulted in substantial increases in MS yield/ha. Yield of MS/ total ha (pasture + crop) increased by 24% between Treatment A and E compared with an increase of 91% when expressed as MS/ha, of pasture only. Treatment C produced high MS/ cow due to high pasture allowance /cow. However, with the lowest SR and low FU efficiency (66%), it had the lowest MS/ha. Of the high input systems (D, E and F), treatment E had the highest MS/cow, and also a relatively high MS/ha because of its high SR. Treatment E achieved high MS/cow and MS/ha through supplement input that allowed a high FU efficiency of 75% leading to a high FCE of 84 g MS/kg DM. These findings agree with the relationship proposed by Stockdale (1995) that efficient supplement input can give high pasture utilisation rates and high producing and efficient cows. For treatment C to obtain the high DM intake (DMI) required for their level of production, a high pasture allowance (70 kg DM/cow/day) of highly digestible pasture (>11 MJ ME/kg DM) (Kolver & Muller 1998) would be required. The high pasture Table 5 Economic farm surplus ($/ha) and ROA (%); mean of 2 years from the RED trial (2002/2003 & 2003/ 2004) for two sets of costs and returns. Treatment A B C D E F A: assumptions $4.50 kg MS, $0.18/kg DM maize silage, and land @ $37000/ha EFS 2782 2454 2756 3284 3805 2787 ROA 9.1 8.4 9.3 9.5 9.6 7.2 B: assumptions $3.50 kg MS, $0.24/kg DM maize silage, and land $18000/ha EFS 1613 1340 1760 1439 833 -1308 ROA 8.5 7.6 9.5 7.1 4.4 -1.4 Figure 1 Effect of payout on system feed profit of feed input (EFS/kg DM provision), based on supplement cost of $0.18/ kg DM. Contrasts two treatments from the RED trial.
  • 5. Resource Efficient Dairying trial: measurement criteria for farm systems over a range of resource use (R.N. Jensen et al) 51 allowance is evident as this treatment had an average pasture mass that was consistently above that of the other treatments. Dalleyet al. (1999) proposed that this would be associated with an increase in pasture residual levels from 1.8 t to2.7 t DM/ha to change the allowance from 20 to 70 kg DM/cow/day. Feed utilisation for this treatment of 66% supports this relationship. These results confirm the principle that a low SR will result in high feed allowance/cow, high DMI,high MS yield/cow, high FCE, low FU, and low MS/ha (Macdonald et al. 2001). When the SR is increased together with the use of imported feeds to supplement pasture, DMI and MS/per cow, FCE and FU can all be high, and result in high MS/ha. Economic farm surplus and ROA were maximised when cost effective supplements were used and the payout was relatively high. Conversely a low input system gave the greatest EFS and ROA when supplements were more expensive, and the payout and land value were low. It is evident that the resource use is cost/return sensitive, and while the analysis shown here is based on two cost/ return relationships it holds true that when the payout is $3.50/kg MS the low input system is competitive irrespective of land price ($18000 or $37000/ha) or supplement cost ($0.18 or $0.24/kg DM). At a higher payout of $4.50/kg MS, treatment E supplemented with 10 t maize silage/ha had the highest EFS irrespective of supplement cost. The ROA showed a greater variation due to land value. When the land value is low ($18000/ ha) the low input system had the highest ROA. When the land is valued at $37340/ha, and the maize silage is costed at $0.18/kg DM, treatment E has the highest ROA. However when the maize silage is costed at $0.24/kg DM, the ROA is highest for the low input system (treatment C). A change in the MS payout has a greater effect on the EFS as the levels of supplement increase. Sensitivity analysis showed that the low input system (treatment C) is less sensitive to changes in MS payout, and has lower system overheads to recover. This aspect is evident from the regression equations (equations 1 & 2) in that both the slope and rise for treatment C is less than F therefore C will be profitable at lower $/kg MS and has lower overhead costs to recoup than treatment F ($1.73 and $3.52/kg MS respective breakeven points). High input systems, treatments D and E are competitive at higher MS payout, and these systems are affected less by a payout change when maize silage cost is held at $0.18 / kg DM. Return on assets analysis, which was based on a land value of $18000/ha, follows the same trend as for system EFS. However, if the land value is increased to $37000/ha the high input treatment stocked at 5.3 cows/ ha shows a higher return at $4.50/kg MS and maize silage costed at $0.18/kg DM. Effectively this is comparing system profitability when the pasture cost increases from $0.06/kg DM to $0.11/kg DM at land prices of $18000 and $37340/ha respectively. Summary The management of these treatments is generating a wide range in yields of MS/ha due to the large range in feed imported to the milking platform. When physical performance is related to the efficiency of MS production, treatment E is consistently high in terms of pasture utilisation and FCE. The low input system, (treatment C), represents a low financial risk. These systems are operating across divergent farming philosophies, and market signals may indicate customer preferences. The decision by farmers to adopt a particular system will relate to their personal perspective on environmental issues and to the economic evaluation of the system (and others – labour, machinery, risk). Intensifying dairy systems with higher SRs and more supplementary feed can increase production up to 3000 kg MS/ha of pasture on the milking platform. When the area used to grow the maize was included, the MS/ha of intensive systems was increased by additional maize silage input (+ 281 kg MS/ha; treatmentA cf E). However, when the cost/return relationships were analysed, diminishing returns occurred by intensifying above 5.2 cows/ha and 10 t DM maize silage/ha. The profitability of these systems depended on the payout; pasture cost (land price), and maize silage cost. This study highlights that resources needed to support a system may affect its viability and this needs to be explored further with appropriate tools. ACKNOWLEDGEMENTS Thanks to Dexcel science, technical and Scott farm staff and our funders, the Foundation for Research, Science and Technology. REFERENCES Dalley,D.E.; Roche,J.R.; Grainger,C.; Moate, P.J. 1999. Dry matter intake, nutrient selection and milk production of dairy cows grazing rainfed perennial pastures at different herbage allowances in spring. Australian Journal of Experimental Agriculture 49: 923-931. Deane, T. 1999. The profitable use of supplementary feeds in pasture based dairy farm systems. Proceedings of the Ruakura Dairy Farmers’ Conference 51: 64- 67. Dexcel Farm Facts 7-3. Economic farm surplus, 2003/ 2004. www.dexcel.co.nz/farmfacts.cfm. Jensen, R.N.; Clark, D.A.; Macdonald, K.A. 2004. Dairying intensification; production responses and
  • 6. 52 Proceedings of the New Zealand Grassland Association 67: 47–52 (2005) financial implications. Proceedings of the Agronomy Society of New Zealand 34: 13-20. Jensen, R.N.; Beukes, P.; Clark, D.A.; Macdonald, K.A. 2005. Modelling dairy system efficiencies. Proceedings of the New Zealand Society of Animal Production 65: 203-208. Kolver, E.; Muller, L.D. 1998. Performance and nutrient intake of high producing Holstein cows consuming pasture or a total mixed ration. Journal of Dairy Science 81: 1403-1411. Macdonald, K.A.; Penno, J.W.; Nicholas, J. K.; Lile, J.A.; Coulter, M.; Lancaster, J.A.S. 2001. Farm systems – Impact of stocking rate on dairy farm efficiency. Proceedings of the New Zealand Grassland Association 63: 223-227. Macdonald, K.A.; Thorrold, B.S.; Pryce. J. 2005. Dexcel Holstein-Friesian strain trial-are all black and whites created equally? Proceedings of Dairy3 3: 165- 174. McDonald, P.; Edwards, R.A.; Greenhalgh, J.F.D.; Morgan, C.A. 1995. Animal Nutrition., Longman University Press, Singapore. McMeekan, C.P. 1961. The pros and cons of high stocking rate. Massey Dairy Farming Annual 13: 9-15. National Research Council. 1987. Predicting feed intake of food-producing animals. Subcommittee of Feed Intake, Committee on Animal Nutrition, Board of Agriculture, National Research Council. National Academy Press. Washington DC. U.S.A. 96 pp. Leslie, M. 1999. ProfitWatch program operation and advisory definitions and standards for the measurement of Economic Farm Surplus and operation of ProfitWatch. Version 1.1. Livestock ImprovementAdvisory. Speight, S. 2002. A smarter way of looking at stocking rate. Proceedings of the Ruakura Farmers’ Conference 54: 6-8. Stockdale, C.R. 1995. Maize silage as a supplement for pasture-fed dairy cows in early and late lactation. Australian Journal of Experimental Agriculture 35: 19-26. Van der Poel, J. 1997. Balancing the feed budget, a New Zealand Perspective. Dairy Research Foundation, University of Sydney. Vol. 2:92-101.