2. 2
S&P Capital IQ Equity Research
December 10, 2013 2014 European Strategy Outlook
Contents
Executive Summary 3
The Economic Case 4
The Road Is Long, Annual Delta Still Strong 4
Go Forth And Multiply 5
GDP Forecasts Stable And Likely To Be Upgraded 7
Investment Rebound Requires A Couple More Quarters Of Steady Improvements
9
ECB Will Figure Prominently, Has Capacity To Positively Surprise 12
A Chill Eastern Wind … 15
… Insulated By Reform? 17
Banking System Holds The Key 19
Greater Financial Stability 19
Points of Reference: Nordics & US 21
Provisioning Cycle Is Paramount 23
Relative Earnings Momentum Should Drive EU Banks 24
Belated EPS Upgrade Cycle Finally Here 27
10% Earnings Growth in 2014E 27
Biggest Margin Recovery In Cyclical Sectors & Periphery But Beware Traps 29
Themes 31
Financials & Cyclicals 31
Domestic EU > US > EMs 33
Choose Value Over Growth 35
Time To Overweight The Periphery 36
Sectors 39
Current Consensus Forecasts 39
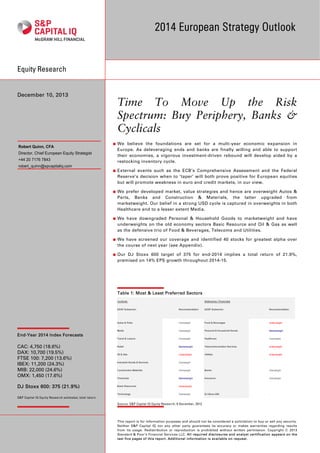
Most Preferred 39
Least Preferred 45
Thoughts On Other Asset Classes 49
Index Targets 51
Appendix - Preferred Stocks 52
Glossary 54
Disclosures/Disclaimers 54
3. 3
S&P Capital IQ Equity Research
December 10, 2013 2014 European Strategy Outlook
Executive Summary
A balance sheet snapshot of European economies reveals the capacity for
future expansion is significant. When viewed through the lens of an income
statement the positive outlook becomes clearer: credit conditions are easing
for both households and non-financial corporates driving a credit impulse
via lower costs of funding ahead of increased lending, retail sales have risen
across most of the big European economies over the past two quarters,
fiscal impulses will be generated across Europe and exports will be
supported by the cyclical improvements in both the US and China. The
largest year-on-year improvements will be visible in the peripheral
economies in our view.
The primary determinants of investment spending are all in place for a 2014
recovery: capacity utilisation levels have rebounded to mid-to-high 70% in a
host of European countries; financing costs have improved markedly and
corporate bank lending standards for corporates eased for the first time
since 2007 in October; and corporate profitability is set to increase.
The Asset Quality Review and subsequent stress test, scheduled for
completion by the end of H1 and Q3 respectively (but not published until
October), will be a defining feature of 2014. The largest banks are likely to
improve their provisioning ahead of the end-2013 cut-off date for analysis;
we are positive on the expected outcomes and we assume 2014 to be the
final year of deleveraging. Loan growth should restart in 2015, in line with
the Nordic and US experiences.
We believe the key event for the EURUSD exchange rate will be when the US
Federal Reserve finally sets a timetable to taper – we believe this could be by
the 18-19 March FOMC meeting.
We forecast 14% EPS growth for the SXXP in both 2014-15. We expect
cyclicals’ earnings to outstrip defensive peers by at least 15ppts over the
next 12 months, allowing the slight overvaluation currently to be quickly
reversed.
We assume that FY/13 EPS stabilises at current levels of EUR21.3. Applying
earnings growth forecasts of 14% for both 2014 and 2015 results in a FY/15
EPS integer of EUR27.7. Given the flow of funds support from other asset
classes and the expected low volatility in economic conditions, we are
sanguine about using a 13.5 times forward multiple, giving us our 375 SXXP
target level for end-2014.
Greatest investment opportunities exist in the peripheral equity markets,
premised on the most spread compression and delta in earnings recovery.
4. 4
S&P Capital IQ Equity Research
December 10, 2013 2014 European Strategy Outlook
The Economic Case
The Road Is Long, Annual Delta Still
Strong
Returns may have felt difficult to digest due to the high beta markets but equities
have been the best performing asset class over the 2012-13 period, averaging
20% per annum in Europe. The period can also be defined by the increasing year-
on-year (y-o-y) delta of GDP growth. This delta is factored into equity prices in the
prior year and hence our belief is that the 2014 upturn is already fully reflected.
This begs the question of what we can expect in 2015? The year-on-year change
will be modestly lower but by that time global GDP is likely to have accelerated to
its highest growth rate for five years. Much like the middle of the 1990s, the stage
is set for a new profits cycle to emerge amid a background where corporates still
caution against a lack of visibility. That period witnessed five consecutive years of
double-digit equity returns; we are currently in the middle of year two.
Chart 1: Equities trade on year-ahead GDP delta
Source: S&P Capital IQ Equity Research; Global Insight; 9 December 2013
The relationship holds true across countries for 2014 and upon factoring in Global
Insight’s, an independent economic consultancy, 2015 GDP growth forecasts the
greatest value opportunities overwhelmingly appear across the periphery.
Of course, once steady-state GDP growth is reached equity performance can and
does climb higher but the pace softens. For example, during 2004-06 global GDP
growth was consistently in a range between 3.5-4% during which time the SXXP
appreciated by 45% in price terms. Forward valuations contributed 5%, earnings
40% (22% revenues, 18% margin expansion). Global GDP could hit a steady-state
growth rate by 2015; in this scenario it is unlikely the European corporate
profitability will have peaked.
‐5.0
‐4.0
‐3.0
‐2.0
‐1.0
0.0
1.0
2.0
3.0
‐50
‐25
0
25
1991 1994 1997 2000 2003 2006 2009 2012 2015
World: Equities (%yy, 1yr fwd, lhs) World: GDP Impulse (chng ppt, incl 2014e)
5. 5
S&P Capital IQ Equity Research
December 10, 2013 2014 European Strategy Outlook
Go Forth And Multiply
We maintain our conviction that 2014 will be the first credible recovery year of
the developed world economies collectively and, crucially, the first of many.
Private sector surveys coupled with a reversal in net fiscal tightening1
points
towards global GDP growth rate above 3.5% from 2.5% currently – the largest y-o-
y delta in growth since 2009 (and 2004 before that). We are entering our third
recovery year in the past decade in Europe, reflecting a period of shortened
business cycles when viewed historically and offering the potential of a
prolonged period of expansion, conditional on a less volatile economic
landscape. Global GDP growth has obviously been stronger than in Europe but
has still been on a declining path since the second quarter of 2010, and hence we
view it more likely than not that growth will positively surprise to the upside.
Chart 2: PMIs suggest global GDP acceleration into 2014
Source: Markit, Bloomberg; 9 December 2013
Be it the shadow banking system or suboptimal political architecture, the recent
past advises against ignoring exogenous shocks. 2014, however, looks light on
banana skins, at least relatively. For a start, the political calendar is clear: US
mid-term elections fall in November 2014 while December 12 of this year and
January 13, 2014 are the next dates scheduled for the US debt ceiling debates;
otherwise, the next key election in Europe is most probably whenever Italy
decides to go back to the polls. These events are unpredictable but the
diminished contagion effect in financial markets alongside a weaker capacity for
influence tactics by Silvio Berlusconi comfort us.
The fact the US Republicans are perceived serial offenders in the eyes of the
voters, judged by their subsequent performances in the polls, leaves their
negotiating position heavily compromised with the mid-terms now months away.
Further, the Continuing Resolution, the remaining bones of contention, has
narrowed given the various piecemeal agreements reached thus far. During all
this, the US economic recovery is broad-based across sectors and ready to
accelerate in 2014 in our view.
1
Year-on-year change in public spending (ie. a fiscal deficit moving from -2% to 1% of
GDP would result in a positive fiscal impulse of +1%)
-6
-3
0
3
6
35
40
45
50
55
60
Mar-04 Mar-06 Mar-08 Mar-10 Mar-12 Mar-14
Global PMI Composite (1qtr lead, lhs) Global GDP Growth (rhs, %y/y)
6. 6
S&P Capital IQ Equity Research
December 10, 2013 2014 European Strategy Outlook
But where does growth come from in Europe? The simple answer is that different
components of an economy grow, or contract, at different rates and the 2014
recovery is as equally attributable to some of those components not making a
negative contribution than others carrying the fight with renewed vigour.
Chart 3: Delta largest in periphery; y-o-y change in 2014/13
GDP growth on current forecasts
Chart 4: Weak credit demand coincident with moribund
economic recovery
Source: S&P Capital IQ Equity Research, Global Insight; 9 December 2013 Source: ECB, Eurostat; 9 December 2013
A balance sheet snapshot of European economies reveals a still-defensive
positioning: household savings are elevated, deleveraging continues and
corporate spending, on rehiring or investment, is on hold. The capacity for future
expansion is significant. An even more positive picture develops when viewed
through the lens of an income statement: credit conditions are easing for both
households and non-financial corporates2
(NFCs) driving a credit impulse via
lower costs of funding ahead of increased lending, retail sales are rising across
most of the big European economies over the past two quarters; fiscal impulses
will be generated in Germany, Italy and the UK3
and exports will be supported by
the cyclical improvements in both the US and China. The largest year-on-year
improvements will be visible in the peripheral economies (chart 3).
The link between these income statement and balance sheet analogies is the
inventory cycle. In Europe, it has explained much of the weakness since 2010 and
will provide the ignition to the economic engine in 2014, in our view. Working
capital demand, modelled as the future change in corporate credit in the ECB’s
quarterly Credit Conditions survey, has rebounded to positive territory for the
first time since the third quarter of 2011.
2
NFC conditions eased in October for the first since 2007
3
Forecast net fiscal tightening for 2014/2013 as a percentage of GDP are 0.7ppts for
European Union. The US is more than double at 1.6ppts according to the IMF.
‐1.0
‐0.5
0.0
0.5
1.0
1.5
2.0
2.5
3.0
Ppts
‐15
‐10
‐5
0
5
10
15
20
25
‐1.5
‐1.0
‐0.5
0.0
0.5
1.0
1.5
Mar‐03 Mar‐05 Mar‐07 Mar‐09 Mar‐11 Mar‐13
Chng in Inventories (% GDP, 2qtr lead, lhs) Future Chng In Corporate Credit Demand (rhs)
7. 7
S&P Capital IQ Equity Research
December 10, 2013 2014 European Strategy Outlook
GDP Forecasts Stable And Likely To Be
Upgraded
Consensus GDP growth forecasts were downgraded heavily throughout 2012, by
roughly a full percentage point (ppt) for both France and Germany, 1.5ppts for
Italy and a whopping 2.5ppts for Spain. 2013 forecasts have been both better and
more divergent: Spain has been upgraded by 0.2ppts since the start of the year
along with the UK, Italy down by 1ppt and France and Germany have recovered
mildly after mid-year downgrades. Current 2014 GDP growth forecasts have been
fairly stable across all the key EZ economies throughout 2013 bar the material
upgrades to the UK in H2 (from 1.6% to 2.3%).
Our S&P Capital IQ European Economics team is slightly below consensus on the
UK, at 2.1% GDP growth for 2014E, but similarly sees it as the strongest 2014
performer followed by Germany with 1.8%. Growth is then seen peaking in the
latter, with biggest year- on-year changes going into 2015 found in France and
Spain. The recent weakness in EZ inflation is viewed as temporary, but the
subdued inflationary pressures are not as the ECB target of ‘close to but below
2%’ will not be challenged until 2016 at the earliest in their view.
Table 2: Main economic forecasts
Source: S&P Ratings; 31 October 2013
An interesting footnote to the prolonged recessionary conditions in Europe is that
most of the peripheral economies endured the first wave (Great Recession, 2008-
09) better than they did the second wave (Eurozone sovereign crisis and
consequent deleveraging). Public sector spending attempted to offset private
sector contraction in the former but alas this dynamic didn’t reverse in the latter,
as it did in the US. As European public sector growth stabilises in 2014, we
anticipate a strengthening private sector rebound as the year progresses with
significant catch-up potential on offer (chart 5).
Oxford Economics currently puts the Eurozone output gap at -4.2%, making it the
largest among the developed world (only just below the UK). Interestingly, the US
output gap of -3.45% is larger than the OECD average of -2.9% and suggests that
the US recovery is still in its early form. Within Europe, Norway is the solitary
Real GDP (% chng) Germany France Italy Spain U.K. Eurozone
2012f 0.7 0.0 -2.5 -1.6 0.1 -0.6
2013f 0.5 0.0 -1.8 -1.5 1.5 -0.7
2014f 1.8 0.7 0.5 0.5 2.1 0.9
2015f 1.7 1.4 0.9 1.1 2.0 1.3
CPI inflation (%)
2012f 2.1 2.2 3.3 2.4 2.8 2.5
2013f 1.6 1.0 1.5 1.8 2.7 1.6
2014f 1.8 1.5 1.6 1.4 2.3 1.6
2015f 1.7 1.4 1.2 1.3 2.0 1.5
Unemployment rate (%)
2012f 5.5 10.3 10.7 25.1 8.0 11.4
2013f 5.4 11.0 12.2 26.7 7.9 12.4
2014f 5.2 11.0 12.5 27.0 7.8 12.5
2015f 5.1 10.3 12.0 26.0 7.5 12.0
8. 8
S&P Capital IQ Equity Research
December 10, 2013 2014 European Strategy Outlook
nation with a positive output gap, of 0.8% (the rest of the Nordics are between -
2.8% and -5%). Germany (-0.9%) has the smallest output gap among the key EZ
members followed by Italy (-2.5%), France (-4.7%) and then Spain (-6.3%).
These unobservable judgements may be treated with a pinch of salt following the
non-alarm bell ringing ahead of the Great Recession although the current lurking
dangers of the shadow banking system are further from the shore by comparison.
Nonetheless, from an equity perspective, output gap forecasts may be a better
sell than buy signal4
and they are clearly not indicating an overheated cycle, in
our view. Another approach to quantifying, or timing, the levels of spare capacity
is the Taylor Rule used by monetary economists (where interest rates are set
based on the dynamic between inflation and GDP growth and the respective gaps
between actual and potential levels). Using IMF assumptions5
on the non-
accelerating rate of unemployment (NAIRU), the optimal interest rates for the
individual economies are: 4.3% (Germany), -0.3% (France), -2.5% (Italy), -12%
(Spain) and -1.6% (UK). Rates markets are currently pricing first BOE and ECB
hikes in Q1 2015. What is evidently clear to us in regards to the latter is monetary
policy will have to be a closer fit to the weaker members of a monetary union
where exit is not allowed than to the stronger performers. Under this framework,
Germany is more likely to overheat than the periphery is to struggle, which
augurs well for our investment horizon.
Chart 5: EU private sector recovery has commenced Chart 6: OECD output gaps
Source: S&P Capital IQ Equity Research Eurostat; 9 December 2013 Source: OECD, Oxford Economics; 9 December 2013
4
We can use the high-frequency PMI series for further illustration: one may buy equities
when the PMIs are around 45, ahead of an economic recovery, and typically be
profitable – hence a good buy signal. The same principle for selling does not apply
when PMIs peak in the high 50s.
5
Germany 7.8%, France 8.9%, Italy 8.2%, Spain 13.5% as of November, 2013
-8.0
-6.0
-4.0
-2.0
0.0
2.0
4.0
6.0
Q1 1996 Q1 1998 Q1 2000 Q1 2002 Q1 2004 Q1 2006 Q1 2008 Q1 2010 Q1 2012
Private Sector GDP (%yy) Public Sector GDP (%yy)
-8
-6
-4
-2
0
2
4
6
Q1 2000 Q1 2002 Q1 2004 Q1 2006 Q1 2008 Q1 2010 Q1 2012
OECD US UK Japan EZ
%
9. 9
S&P Capital IQ Equity Research
December 10, 2013 2014 European Strategy Outlook
Investment Rebound Requires A Couple
More Quarters Of Steady Improvements
Financial crises are synonymous with periods of under-investment as balance
sheets are repaired and credit conditions take longer to normalise. The 2008-09
downturn was most definitely an investment-led (prolonged) recession and gross
fixed capital formation (GFCF) in the Eurozone is currently 16.1% below trend.
The picture is more stark at the national level: Spanish GFCF is 33% below Q1
2008 peak levels, Italy and the UK 25% below and even the mighty Germany is
below peak (-5%).
Chart 7: Gross fixed capital formation rebased by country Chart 8: Greatest catch-up potential in fixed investments
Source: S&P Capital IQ Equity Research; Q1 2008 = 100; 9 December 2013 Source: 9 December 2013
But just because those levels are depressed, is that enough to warrant a rebound
in our forecast horizon? Firstly, it is important to identify the primary
determinants of investment spending: capacity utilisation (CU), costs of finance
and corporate profits. CU levels have recovered to mid-to-high 70% in a host of
European countries and could conceivably cross the 80% threshold in the next 12
months given that our 2014-15 GDP growth forecasts are 0.9% and 1.3%
respectively. Financing costs have improved markedly since President Draghi’s
‘irreversibility of the euro’ speech of July 2012 and have scope to go further.
Peripheral SMEs admittedly are still credit-constrained but their primary cause for
concern in the ECB’s latest Access To Finance survey6
is cited as end demand.
Again, this should incrementally improve as we progress into 2014. Their October
quarterly credit conditions survey showed corporate lending standards turned
positive (i.e. eased) for the first time since 2007 (ignoring the short-lived, flat
reading in mid-2010, chart 10). Corporate lending is weaker currently (-5.2% y-o-y)
than after the Great Recession of 2008-09, moving from a halt in loan growth to
eventual deleveraging. Lastly, our 2014 base case for European equities is
constructed on an earnings rebuild and hence all criteria for an investment
rebound appear in place.
Chart 9 highlights the role of GFCF. It is typically 3-4 times more volatile than the
GDP cycle and hence plays a significant role in the amplitude of the business
cycle.
6
October 2013, semi-annual publication
50
60
70
80
90
100
110
Dec-05 Dec-07 Dec-09 Dec-11
Germany France Italy Spain UK
260
290
320
350
380
410
440
470
Q1 1995 Q1 1997 Q1 1999 Q1 2001 Q1 2003 Q1 2005 Q1 2007 Q1 2009 Q1 2011 Q1 2013
EZ GFCF (Eur, bln) Linear (EZ GFCF (Eur, bln))
16.1%
10. 10
S&P Capital IQ Equity Research
December 10, 2013 2014 European Strategy Outlook
Chart 9: Gross fixed capital formation amplifies the GDP
growth cycle
Chart 10: Deleveraging should be into final year
Source: S&P Capital IQ Equity Research; 9 December 2013 Source: ECB, Eurostat; 9 December 2013
Depressed investment activity levels vary according to the different performances
of the past cycle and if it was overheated or not. The greatest surprise at the
country level is not that the likely bunch of the UK and Iberia are furthest from
their long-term proportion of investment within their economies but that France
is above (chart12). A more detailed cross-section shows France outperforming
Germany across all categories, Iberia ranks bottom in most while Italy’s weakness
is closely matched to the UK’s dynamic. We provide further granularity on the
basket of fixed asset expenditure below:
Dwellings (residential): The hardest hit category in the EZ. Portugal
(-66%), Spain (-46%) and the Netherlands (-35%) stand out as the most
severe adjustments by far and with house price inflation still negative in
all it is likely that none have troughed. The UK (-6%) has been
surprisingly resilient given the strength of house prices over the past
decade while Sweden’s (+25%) later housing boom raises concerns.
Intangibles: Makes up 9.3% of total fixed asset investment and is 7.6%
above average levels in the EZ but weak in the UK (-10%), Finland
(-13.8%) and Spain (-14.8%). IT capex should leverage from the more
traditional capex investments but the rebound will be stronger
elsewhere.
Machinery & Equipment: Makes up approximately 26% of total fixed
asset investment, alongside the other two big heavyweight segments
dwellings and other buildings and structure. Germany, Italy and Sweden
have particularly large weighting.
Other Buildings & Structures: Incorporates government expenditure on
items such as municipal buildings or bridges among other things and the
shape of the country deviation from long-term average mirrors that of
the respective sovereign’s fiscal deficits barring a strong performance in
France. Sweden is above trend, the EZ is 9.5% below and dragged lower
by Spain (-26%) and Portugal (-31%), while the UK is 23% adrift.
-15
-10
-5
0
5
10
15
Q1 1995 Q1 1998 Q1 2001 Q1 2004 Q1 2007 Q1 2010
GDP Growth (%y/y) GFCF (%y/y)
‐10.0
‐5.0
0.0
5.0
10.0
15.0‐20
0
20
40
60
80
Jan‐03 Jan‐05 Jan‐07 Jan‐09 Jan‐11 Jan‐13
ECB NFC Lending Standards Survey (4qtr lead, inverted, lhs) EU Corporate Loans (%y/y, rhs)
Credit conditions tightening
Credit conditions easing
11. 11
S&P Capital IQ Equity Research
December 10, 2013 2014 European Strategy Outlook
From modelling signals from business surveys on economic sentiment, we are
optimistic that European GFCF will accelerate into 2014 and beyond (charts 11).
The impulse is strongest in the UK, Germany and Spain within Europe but Italian
signals instead point towards greater stabilisation.
Chart 11: EU investment spend to accelerate in 2014 Chart 12: Non-residential share of GDP versus long-term
averages lower across Europe
Source: S&P Capital IQ Equity Research; 9 December 2013 Source: Eurostat, 9 December 2013
Europe is not alone in the improving GFCF outlook. The investment impulse in
the US is perhaps even stronger with our model pointing towards a high-single
digit growth rate and beyond over the next four quarters (chart 13). Reassuringly,
the bickering in Congress no longer has the same adverse impact on business
confidence that it did in the preceding quarters before the first ‘fiscal cliff’
negotiations. Our positive model readings are supported by private sector
confidence at elevated levels; Philly Fed Capex Intentions, in tune with the Empire
State and Richmond Fed Capex surveys, was at its second highest reading since
2004 as recently as September, when the Conference Board Consumer Confidence
index is at a six year high too. Both have pulled back since but they remain in
healthy territory and the ISM has accelerated since.
Chart 13: US investment spend to accelerate in 2014 Chart 14: US private sector confidence at multi-year highs
Source: S&P Capital IQ Equity Research; 9 December 2013 Source: Federal Reserve, US Census Bureau; 9 December 2013
60
70
80
90
100
110
120
-16
-12
-8
-4
0
4
8
Mar-96 Mar-99 Mar-02 Mar-05 Mar-08 Mar-11
EU27 GFCF (%y/y, lhs) EU27 Economic Sentiment (1qtr lead, rhs)
% y/y
‐30
‐25
‐20
‐15
‐10
‐5
0
5
% Deviation from Non‐Residential Share of GDP LT Averages
-90
-60
-30
0
30
60
90
-28
-21
-14
-7
0
7
14
21
Jan-00 Jan-03 Jan-06 Jan-09 Jan-12
US GFCF (%y/y, lhs) US ZEW Economic Sentiment (4qtr lead, rhs)
20
40
60
80
100
‐30
‐20
‐10
0
10
20
30
40
Jan‐2009 Jan‐2010 Jan‐2011 Jan‐2012 Jan‐2013
Philly Fed Capex Intentions (lhs) Consumer Confidence (rhs)
12. 12
S&P Capital IQ Equity Research
December 10, 2013 2014 European Strategy Outlook
ECB Will Figure Prominently, Has
Capacity To Positively Surprise
The ECB finds itself in the rare position of cleaning up a mess they weren’t
directly responsible for. This afforded luxury coupled with the transfer towards
the Single Supervisory Mechanism grants the ECB greater scope in tackling the
legacy loan issues of the Eurozone banking system and the risks of
‘zombification‘ of its weaker members.
The Asset Quality Review and subsequent stress test, scheduled for completion
by the end of H1 and Q3 respectively (but not published until October), will be a
defining feature of 2014. It is difficult to determine whether the improving
economic conditions are cyclical or structural in nature at this juncture but the
need for this recovery to grow roots is beyond reproach. The largest banks are
likely to improve their provisioning ahead of the end-2013 cut-off date for
analysis; we are positive on the expected outcomes. The ECB remains vigilant,
evidenced by the surprise rate cut on November 7. Spurred by the disinflationary
trends pervasive in most of the developed world but most acute in peripheral
Europe, the Refi rate cut took 3% off the EURUSD rate.
Chart 15: Excess reserves in EZ banking system continue to
shrink
Chart 16: Euro appreciation as ECB balance sheet shrinks
Source: ECB; 9 December 2013 Source: Bloomberg; 9 December 2013
It is our view that the euro will be weaker versus both USD and GBP over the next
12 months, most likely in the region of 1.20-1.25 for both cross-rates. As we swap
a high volatility economic and financial landscape for a lower one, the euro is
less likely to display the risk-on, procyclical characteristics of recent times. A
strong current account performance will limit the depths of depreciation but
import levels should pick up as EZ consumers and corporates respond to the
more benign economic conditions.
We believe the key event for EURUSD will be when the US Federal Reserve finally
sets a timetable to taper – we believe this could be by the 18-19 March FOMC
meeting, although our US Economics team believe it could be sooner. The dovish
Janet Yellen is set to replace the equally-dovish Chairman Bernanke but one
should not overlook the other changes being made to the Board: seven of the 12
members are rotating in the coming months, most of those known doves. Hence,
7
Long-term refinancing operation
‐400
‐200
0
200
400
600
800
Jan‐08 Jan‐09 Jan‐10 Jan‐11 Jan‐12 Jan‐13
Excess Reserves
EUR (bln)
1,500
1,800
2,100
2,400
2,700
3,000
3,300108
118
128
138
148
Jan-09 Jan-10 Jan-11 Jan-12 Jan-13
Euro TWI (lhs) ECB Balance Sheet (rhs, inverted, €mln)
13. 13
S&P Capital IQ Equity Research
December 10, 2013 2014 European Strategy Outlook
the new ‘Yellen Fed’ is likely to be more hawkish if anything. Either way, the
Fed’s actions are tied to economic developments and, as the economy accelerates
in 2014 as we expect, it is arguable to claim that further stimulus is needed.
Assuming that rounds three and four8
don’t adversely impact the improving
recovery, the Fed’s March round of GDP forecasts are likely to be upgraded9
and
could provide a perfect platform to justify the diminished need for further QE, in
our view.
Chart 17: US Treasury yield adjustment is nearly complete
Source: S&P Capital IQ Equity Research, Bloomberg; 9 December 2013.
Despite the enforced delay to the Fed’s original timetable, most of the market
adjustment has already occurred this year making focus on ‘taper’ less relevant.
Our 10-year US treasury model perfectly captures the distortion of QE between
Q3 11 and now. The market has digested a 100bp move in yields over the past six
months and a further rise, on the shoulders of stronger growth, should not
provoke a repeat of the 22 May equity sell-off. Or perhaps, with no future element
of surprise, it’s less relevant for equities than it is for credit markets10
.
The same logic cannot be applied to the EZ. The reason we believe the ECB will
move deeper into accommodative policy is twofold: it remains on high alert (it is
difficult to envisage the surprise rate cut on November 7 during the Trichet years)
and, put simply, it needs to be.
8
Next key dates for the US debt ceiling debates are December 12, 2013 and January 13,
2014
9
Latest 2014 GDP growth projections are for 2.9%-3.1%
10
The biggest correction occurred in EM bonds, US HY and govvies – the classes that
attracted the largest mutual fund inflows since 2009.
0.0
1.0
2.0
3.0
4.0
5.0
6.0
7.0
8.0
0.0
2.0
4.0
6.0
Dec‐01 Dec‐03 Dec‐05 Dec‐07 Dec‐09 Dec‐11
UST 10yr Yields (%, lhs) Model 10yr Yields (%, rhs)
14. 14
S&P Capital IQ Equity Research
December 10, 2013 2014 European Strategy Outlook
Chart 18: Access to Finance Q4 2013 survey Chart 19: % economy constituted by SMEs
Source: S&P Capital IQ Equity Research; ECB Access To Finace Survey, October 2013. Source: S&P Capital IQ Equity Research, OECD, 2011.
The composition of the EZ economies acts as a potential handbrake on the
recovery, or an accelerator to it. SMEs play a significantly larger role in France
and the periphery than their G7 counterparts (chart 19). This mattered little in
times of plenty but the current stresses are captured neatly in the ECB’s semi-
annual Access to Finance surveys; 50% of Spanish SMEs, for example, remain
credit constrained according to October’s report. A similar story is told in Italy,
Portugal and Ireland. The sovereign-bank-corporate nexus is the thread that ties
all this together: higher sovereign reference yields adversely impact domestic
corporates with weak profits and a debt overhang, driving domestic banks’ NPLs11
higher and compressing already-thin capital buffers and overlaid by higher
funding costs via the sovereign’s credit profile. We have a strong belief that this
nexus shall weaken over the coming 12 months and beyond.
Chart 20: Credit conditions suggest greater confidence in applications
Source: ECB Credit Conditions Survey, October 2013.
11
Non-performing loans
0
10
20
30
40
50
60
Germany France EZ Italy Portugal Spain Ireland
% SMEs That Report Credit Constraints
0
10
20
30
40
50
60
70
Sweden Germany US UK Japan Canada Italy France Spain Portugal
SME Contribution to GDP (%)
-40
-30
-20
-10
0
10
Jul-11 Jan-12 Jul-12 Jan-13 Jul-13
ECB Corporate Loan Demand (last 3mth chng) ECB Consumer Credit Demand (last 3mth chng)
%, net balance
15. 15
S&P Capital IQ Equity Research
December 10, 2013 2014 European Strategy Outlook
The good news should arrive in three forms:
SME’s most pressing problem was and is the lack of end demand, according
to the same Access To Finance survey, and this will sequentially improve
from hereon in, driving internally generated funds.
Improving credit conditions for both households and corporates alongside
cleaner banks’ balance sheets (post AQR, stress tests and forced
recapitalisations) by the end of H2 2014 offer some light at the end of the
tunnel.
The ECB’s relaxation of collateral requirements on SME-related asset-backed
securities, from AAA to A, in July 2013, acknowledges their recognition of the
problem and their unorthodox willingness to offer solutions.
Most market participants usually scoff at the results of bank stress tests, given
that the larger, listed banks are ascribed a clean bill of health and the smaller,
unquoted and de facto face-less banks are highlighted and given most support. If
this turns out to indeed be the case, our positive argument is wholeheartedly
buttressed: second-tier and small banks in the weaker countries are facing the
greatest wholesale funding strains and it is these banks that provide the bulk of
SME lending.
A worthy headline to this chapter is that the EZ era of deleveraging may be in its
final year judging by the results of October’s credit conditions survey. Lending
conditions for non-financial corporates (NFCs) eased for the first time since 2007
(highlighted by a negative reading in chart 10). On a simple relationship, NFC
lending annual growth rates could improve from -5.5% currently to 0% in four
quarters time. The debt overhang will persist in many corners of Europe but
greater success will be garnered from rising collateral and income levels
however. The cessation in total loans shrinkage is a worthy flag for this acute
phase of deleveraging.
A Chill Eastern Wind …
In our view, China represents the biggest downside risk to our European equity
outlook. As both Europe and the US exit their periods of adjustment, China is
perhaps next in sequence to redress the imbalances in its growth model and,
more prosaically, remains more of a known unknown.
The quality of growth in the 2011-13 period has deteriorated dramatically and the
credit intensity of GDP remains elevated due to overheated housing and
investment. The IMF employs a 10% deviation from trend as a threshold for credit
bubbles and China’s credit growth is now 26% above that trend.
16. 16
S&P Capital IQ Equity Research
December 10, 2013 2014 European Strategy Outlook
Chart 21: China credit intensity of GDP Chart 22: China private sector debt to GDP 26ppts above trend
Source: S&P Capital IQ Equity Research; 9 December 2013 Source: Bloomberg; 9 December, 2013. Orange line includes total social financing.
This bubble in housing poses risks but less than the recent western experiences.
Roughly half of Chinese house purchases in recent years have been all-cash
transactions hence a house price crash is less likely to impair the banking system
akin to Ireland, Spain or the UK. This is not to dispute the worsening domestic
asset quality of Chinese banks however; a 56% investment share of GDP can only
be explained by state-directed credit flows in our view. Note that both South
Korea’s and Japan’s investment-led booms during their industrialisation phases
peaked at significantly lower levels12
.
Most European stocks with Chinese industrial exposure have lagged the broader
market throughout 2013, and they will continue to do so in our view. The crux
here, however, is the potential for a China-inspired global slowdown to expose
the current fragility of the European recovery.
12
Korea’s investment share of GDP peaked at 38% in 1991, Japan 36% in 1973
0
3
6
9
12
Q4 1999 Q4 2001 Q4 2003 Q4 2005 Q4 2007 Q4 2009 Q4 2011
Credit Intensity (Unit of Credit Per Unit Of GDP)
Ratio
40
60
80
100
120
140
160
180
Dec‐83 Dec‐86 Dec‐89 Dec‐92 Dec‐95 Dec‐98 Dec‐01 Dec‐04 Dec‐07 Dec‐10 Dec‐1
China Private Sector To GDP (%)
17. 17
S&P Capital IQ Equity Research
December 10, 2013 2014 European Strategy Outlook
Chart 23: Excess capacity evident In PPI Chart 24: China investment share of GDP
Source: S&P Capital IQ Equity Research, Bloomberg; 9 December 2013 Source: Bloomberg; 9 December 2013
… Insulated By Reform?
Reassuringly, in our view the counterbalance to these developments comes from
the China Third Party Plenum (TPP) held on November 9-12. Similar to the 1978
and 1993 TPPs13
, comprehensive market reform programmes were announced
that could radically alter China’s growth potential from its current slowdown. The
relationship between government and the market economy has been the key
problem and while no explicit directives to break up the existing state-owned
enterprises (SOEs), greater emphasis will be placed on redirecting credit away
from inefficient SOEs and towards previously credit-constrained (judging by the
rapid growth of the shadow bank sector) and more efficient private enterprises.
Key sector reform initiatives include:
Rural land – endorsing the rights of farmers, particularly in the
ownership of their land.
Financial – interest rate liberalisation and RMB internationalisation.
Labour – immigrant residency rights (‘Hukou’) will be relaxed in mid-
sized cities, as will be the ‘one child policy’.
Private enterprise – reduce crowding out by SOEs and less approval for
local government projects, in favour of more free trade zones (FTZs).
Local government clampdown – provincial corruption investigations will
now involve the Central Disciplinary Commission, the labour camp
system has been abolished and the interference upon provincial law
courts has been made more difficult.
13
Premier Xiaping focused on deregulating agriculture and liberalising the rural
economy in 1978, and opened up China for business with the outside world in 1993.
‐30
‐15
0
15
30
45
60
‐15
‐10
‐5
0
5
10
15
Apr‐02 Apr‐04 Apr‐06 Apr‐08 Apr‐10 Apr‐12
PPI Industrial Products PPI Raw Materials (%y/y) Exports (3MA, %y/y, rhs)
10
20
30
40
50
Dec‐80 Dec‐85 Dec‐90 Dec‐95 Dec‐00 Dec‐05 Dec‐10
China Japan Korea US EU
% of GDP
18. 18
S&P Capital IQ Equity Research
December 10, 2013 2014 European Strategy Outlook
The language of the Decision Document has been viewed as stronger than
expected by seasoned China observers. Reading between the lines its greater
potency than more recent editions highlights the limited room for manoeuvre of
the current growth model – one which has lacked clear growth drivers since the
Great Recession. The heavy clampdown on the ambitions of local government,
primarily responsible for the rising credit intensity of GDP that we have flagged,
should see the acceleration in credit-to-GDP ease. We think financial sector
reform is a big positive for both the private sector and its banks and also
improves the financial stability outlook.
But just how long will these reforms take to be implemented? SOEs may face
greater competition but there was no discussion on the break-up of the various
monopolies. Likewise, RMB internationalisation could rebalance China’s economy
from investment towards consumption in a near stroke of the pen but it will likely
be enacted in pigeon steps. Hence, from a European equity perspective, the TPP
is enough to raise our view on China-exposed names from underweight to
marketweight but not enough for a more positive view at this juncture. Again, we
remain consumer-focused.
19. 19
S&P Capital IQ Equity Research
December 10, 2013 2014 European Strategy Outlook
Banking System Holds The Key
Greater Financial Stability
2014 will be a historic year for the ECB, culminating in the stewardship of the 128
largest banks in the EZ from November. To put the foundations in place, the ECB
will address both the assets and liabilities of the Eurosystem separately, we
believe. The Asset Quality Review (AQR) is scheduled to run throughout H1 2014
with a key objective of harmonising accounting and regulatory practises across
borders. Current definitions of non-performing loans or those in forbearance are
too heterogeneous, in our view. The recent change in treatment of deferred tax
assets and the inclusion towards common equity capital by the Spanish
regulators has long been accepted by their Italian counterparts is a case in point.
It does offer hope that like-for-like comparisons across Europe will be less opaque
and challenging moving forward.
Capital levels have continued to strengthen for the euro area banks, with the
median core Tier 1 capital ratio increasing to over 11% in Q3 13 up more than
four percentage points over the past four years. Further, the majority of euro area
banks have already reached a 9.5% Basel III fully loaded compliance level for
Global SIFI14
(4.5% Core Tier 1 + 2.5% conservation buffer + 2.5% maximum
Global SIFI buffer) ahead of the 2019 deadline. However, there is continued
uncertainty with regard to the application of risk weightings leading to increased
focus on the leverage ratio. Improvements here have been more modest and euro
area banks are in a weaker position relative to the US even after adjusting for
netting differences between IFRS and US GAAP. With non-performing loans
continuing to rise, there remains the risk of capital measures for banks where
capital ratios are low and profitability is subdued. We believe the ECB’s
Comprehensive Assessment is a key opportunity to increase confidence in banks’
balance sheets to harmonise risk weightings as well as recognition of non-
performing loans and provisioning.
The downside risk in addressing the legacy loan issues, and the consequent
‘zombification’ of economies that haven’t sufficient deleveraged, is capital
dilution to existing shareholders we think. It is a plausible view that raising
capital at the beginning of an economic recovery is a different proposition to
doing so when the world was burning in late 2008 and 2009 and solvency fears
are very real.
Recently, Barclays raised GBP5.8 bln through a rights issue announced at the end
of July 2013 to help cover a GBP12.8 bln capital shortfall to reach a PRA15
leverage ratio of 3% (stressed to include estimated future conduct costs and
write-downs on the banks’ riskiest assets) by June 2014. The remainder is to be
met through further deleveraging, issuance of hybrid debt and retained earnings.
As a result, Barclays pushed out its return on equity target exceeding cost of
equity until 2016. The shares fell 10% in response to the announcement and
subsequently underperformed reflecting concerns around difficult trading
conditions in the investment bank and particularly fixed income trading, further
misconduct provisions and ongoing uncertainty with regard to capital
requirements for the UK banks following a PRA consultation paper implementing
14
Systemically Important Financial Institutions
15
Prudential Regulation Authority
20. 20
S&P Capital IQ Equity Research
December 10, 2013 2014 European Strategy Outlook
CRD IV16
. The last point illustrates both balkanization in regulation and the lack of
visibility over regulation as banks aim to meet moving capital hurdles. The PRA
are due to finalise their paper in the coming weeks which will bring further
clarity.
While leverage ratios in the southern European banks are less of a concern, the
key issue relates to asset quality. Hence, the IMF has also analysed the potential
banking system losses from their corporate exposures, over the cumulative 2014-
15 period in Italy, Portugal and Spain, against their estimated total loss-
absorption capacity (current provisions, future pre-provisions earnings and
capital buffers)17
.
Their conclusions can be summarised as follows:
Spain: EUR104 bln gross corporate loan losses, fully covered by existing
provisions.
Italy: EUR125 bln, which exceeds existing provisions by EUR53 bln but
fully covered by future operating profits (ergo no capital erosion).
Portugal: EUR20 bln, EUR8 bln above existing provisions and similarly
fully covered by future operating profits.
Additional losses for each using their alternative 55% LGD assumption,
from their 45% estimates, are EUR33 bln, EUR28 bln and EUR4.4 bln for
Spain, Italy and Portugal respectively.
Chart 25: Potential losses on corporate loans & banking
system buffers
Chart 26: Total loss absorption capacity of Italian and Spanish
banks under S&P Capital IQ’s coverage
Source: IMF Global Financial Stability Report, October 2013 Source: S&P Capital IQ Equity Research estimates; 9 December 2013.
16
Capital Requirements Directive, applied to European banks by the European
Commission
17
IMF key assumptions include an extension of weak current economic conditions (ie,
ignoring their baseline forecasts for a recovery and a standard Basel loss-given default
(LGD) of 45%.
18
Bank of Italy have undertaken their own analyses
0
20
40
60
80
100
120
140
160
180
Spain Italy Portugal
45% LGD 55% LGD Provisions (Corporate) + FY14‐15 Operating Profits Tier 1 Capital
EUR (bln)
ProvisionsOperating Profits
0
10
20
30
40
50
60
70
Santander BBVA Intesa Sanpaolo Unicredit
Provisions FY14‐15 PTPPP CET1 Capital Tier 1 Capital
EUR (bln)
21. 21
S&P Capital IQ Equity Research
December 10, 2013 2014 European Strategy Outlook
This raises a further concern for Italian and Spanish banks that have responded to
revenue pressures from deleveraging of loan books and rising non-performing
loans in their domestic markets by increasing their exposure to the domestic
sovereign debt. The ECB Financial Stability Report (November 2013) highlights
that aggregate bank exposure to sovereign debt in Italy and Spain now makes up
10% and 9% respectively of total assets – a position that is far higher than the
core European countries and an increase of two and nearly three percentage
points from the position a year earlier. Banks have further benefitted from the
zero risk weighting of local-currency government bonds to improve capital ratios.
While this treatment will apply to the asset quality review, we hope that some
haircuts will be applied in the subsequent stress tests although we await further
clarity and this looks to be a point of contention between Bundesbank and ECB.
When we look at our coverage of banks in Italy, we echo the IMF findings with
coverage levels in Italian banks looking low relative to Spain which has already
gone through its own stress tests last year and increased provisioning on real
estate assets following clean-ups required by Royal Decrees. NPL recognition is
more stringent in Italy but coverage levels at between 40% and 50% for Intesa
and Unicredit are below the 60%-70% range for Banco Santander and BBVA. Pre-
provision profitability is higher in Santander and BBVA supported by their
geographical diversification offsetting problems in their home market. However,
we believe capital levels are stronger in Italy following rights issues at Intesa and
Unicredit over the last two years and valuations are more supportive.
On completion of the AQR, the banks will be stress tested in Q3 14. The chain-
linking of higher quality and higher capital needs is captured by the raised capital
hurdle rate of an 8% common equity tier 1 (CET1) ratio, versus 5% used in the
most recent EBA exercise in 2012. The credibility of these exercises always hinges
on the severity of the adverse scenario, the translation impact on banking books
(sovereign default will not be considered but their price movements will, for
example) and the subsequent co-ordination of recapitalisations. If no private
capital is forthcoming, then national backstops will be put in place. This, of
course, is the precursor to the ECB assuming its role as the Single Supervisory
Mechanism (SSM) in November 2014.
For the sake of completeness, these positive developments are not to be confused
with the schedule for a fully-fledged banking union. The ECB will not have the
authority to wind down any bank deemed to be failing until the Bank Resolution
and Recovery Directive (BRRD) gets passed into law during 2015, and even then a
pan-European resolution is both absent and unfunded. A template for bail-in
hierarchy has been agreed however: equity shareholders will suffer the first
losses, then junior and hybrid bondholders before a sovereign can inject fresh
equity. Theoretically, senior unsecured bondholders and depositors above
deposit guarantee scheme thresholds are also at risk although unlikely.
Points of Reference: Nordics & US
No western nation can claim to be untouched when it comes to banking and
financial crises but changes in structures, both within modern economies and
between them, make comparisons more challenging. The Nordics financial crises
of the early 1990s has been widely trailed given the success of the response
mechanisms used: establishing independent funds to inject capital into the
banking system (Finland), nationalisation (Norway), mergers of weaker banks and
subsequent separation into ‘good’ and ‘bad’ banks alongside blanket guarantees
(Sweden).
22. 22
S&P Capital IQ Equity Research
December 10, 2013 2014 European Strategy Outlook
Chart 27: Nordic bank lending followed two years after the recovery in house prices
Source: S&P Capital IQ Equity Research, IMF Global Financial Stability Report, October 2013
Like the divergences within the current Eurozone it is remiss to cast the Nordic
crises as uniform. Using 1985 as a base date for all, Finland witnessed the
strongest house price boom, climbing 60.5% in real terms before peaking in mid-
1989; prices fell 47.6% subsequently over the following 16 quarters. Swedish
house prices rose 39.7%, peaking later in 1990, before falling 31.1% over the
following 23 quarters. Norway witnessed a 31.4% rise in real house prices that
peaked nearly three years before the other two countries, then inevitably losing
39.6% over the next 23 quarters.
The key takeaway, however, is that bank lending levels didn’t increase from their
trough for eight, 12 and 13 quarters for Finland, Norway and Sweden respectively
(chart 27). During this period bank equity prices rallied in all territories. At this
juncture, the direction is more significant than the magnitude in our view.
Chart 28: US NFC loans versus house price recovery Chart 29: Which was similar to the timeline of the US
experiences of early 1990s and 2000s as well as 2008-10
Source: S&P Capital IQ Equity Research, Bloomberg; NFCs = non-financial corporates; 9
December 2013
Source: S&P Capital IQ Equity Research; NFCs = non-financial corporates; 9 December 2013
The US timeline corroborates the Nordics experience; after the strong official
sector leadership in 2009, solvency and liquidity issues were assuaged and bank
equity prices have more than tripled since that first quarter low. Household
100
150
200
250
300
350
400
1984 1986 1988 1990 1992 1994 1996 1998 2000
Finland Bank Lending Norway Bank Lending Sweden Bank Lending
Rebased
90
110
130
150
170
190
210
800,000
900,000
1,000,000
1,100,000
1,200,000
1,300,000
1,400,000
1,500,000
1,600,000
1,700,000
Mar‐00 Mar‐05 Mar‐10
Total Outstanding Commercial & Industrial Loans (USD, mlns) S&P Case Shiller 20 (rhs)
4yrs for NFC loans to pick up
6qtrs for NFC loans to pick up
7,000
9,000
11,000
13,000
15,000
17,000
400,000
700,000
1,000,000
1,300,000
1,600,000
1,900,000
Mar‐84 Mar‐89 Mar‐94 Mar‐99 Mar‐04 Mar‐09
Total Outstanding Commercial & Industrial Loans (USD, mlns) US GDP (2009 Dollars, SAAR, USD trn, rhs)
10qtrs for NFC loans to pick up
10qtrs for NFC loans to pick up
6qtrs for NFC loans to pick up
23. 23
S&P Capital IQ Equity Research
December 10, 2013 2014 European Strategy Outlook
lending will typically pick up before corporates in any pre-recession due to their
differing objectives: the former will primarily want to take advantage of cheaper
mortgage rates, while the latter will wait for a sustained pick-up in aggregate
demand. Recall it was the household, not the corporate sector that was
overleveraged in the most recent downturn (the reverse was true in 2000) and
consumer spending recovered once house prices found a bottom. By six quarters
later in Q3 2010, total outstanding commercial and industrial loans started
expanding again and managed to retrace the 22% fall by early 2013 (now 7%
above). Analysing the past three US recessions (1990, 2000, 2008), it took 10, 10
and six quarters of improved aggregate demand before corporate lending
restarted. If we apply this time frame to the EZ and pivot it on the recession
ending in Q2 13, corporate lending should increase part way through 2015.
Provisioning Cycle Is Paramount
US banks have seen their EPS quadruple between 2009 and 2012. The US driver
has been the release of provisions – credit growth didn’t appear until 2012. So
what flexibility do European banks have to drive P&L by the release of built-up
provisions?
The appropriate level of provisions held in proportion to pre-tax pre-provision
profits (PTPPP) and total loans (TL) of course varies depending on which stage of
the cycle we are in. The answer can also vary by geography: US provisions to
PTPPP and TLs are 11% and 0.1% respectively as of Q3 2013, in line with the
previous mid-cycle profile. In aggregate, the EZ provisions cycle is consistent
with 2004-06 levels at 20% of PTPPPs and 0.5% of TLs. These are above current
US levels (which interestingly are similar to Europe’s profile in the 1990s).
Chart 30: Italian provisions cycle Chart 31: Spanish provision cycle
Source: S&P Capital IQ Equity Research, Bloomberg; 9 December 2013 Source: S&P Capital IQ Equity Research, Bloomberg; 9 December 2013
Italian and Spanish banks appear best positioned for any acceleration of
provisions into net income, however, provided that the AQR doesn’t delay their
likely peak too much. Italian provisions were 71% of PTPPP and 1.34% of TLs by
Q2 13 versus mid-cycle averages of 20% and 0.4% respectively; for context, the
two largest Italian banks have been collectively averaging EUR 400mln of net
income quarterly since the end of 2011 and a return to normalised provision
0.0
0.2
0.4
0.6
0.8
1.0
1.2
1.4
1.6
0
10
20
30
40
50
60
70
80
90
Dec-90 Dec-94 Dec-98 Dec-02 Dec-06 Dec-10
Provs / PPPTP (%, lhs) Provs / Total Loans (%, rhs)
%
0.0
0.5
1.0
1.5
2.0
2.5
3.0
3.5
4.0
0
10
20
30
40
50
60
70
80
90
Dec-90 Dec-94 Dec-98 Dec-02 Dec-06 Dec-10
Provs / PPPTP (%, lhs) Provs / Total Loans (%, rhs)
24. 24
S&P Capital IQ Equity Research
December 10, 2013 2014 European Strategy Outlook
levels would equate to EUR 8.6bln of provision release assuming static loans.
This would likely take two to three years to complete barring no new recession.
The equivalent analysis for the Spanish banks shows provisions at 59% of PTPPP
and 1.7% of TLs and mid-cycle averages of 20% and 0.5% respectively. Total net
income has averaged EUR1.28 bln over the past six quarters meaning that a
provisions release of EUR13.8 bln could theoretically double current earnings for
11 consecutive quarters. There will inevitably be hiccups in that period but
nonetheless there is credence to current Spanish bank communications that they
do not fear the upcoming AQR.
By comparison, the French provisions cycle is at 30% and 1% (PTPPP, TLs);
German at 52% and 0.6%; and UK at 33% and 0.8%. All of these have peaked
before the Italian and the Spanish cycles but have room for further compression,
in our view.
Relative Earnings Momentum Should
Drive EU Banks
2007: -6%. 2008: -35%. 2009: -24%. 2010: -5%. 2011: -23%. 2012: -22%. If you
haven’t guessed what the sequence is yet, it’s the brutal relative earnings
performance of European banks (SX7P) versus the SXXP. On current consensus
forecasts the next number in the sequence is +15%19
. The issue can perhaps be
rephrased to the sell-side becoming bullish on banks but the buy-side community
have more scarred memories as the sector remains under-owned.
Relative EPS momentum finally turned positive at the start of this year, on the
basis that SXXP downgrades were deeper than that of the sector. Maintaining the
theme of catch-up potential, banks’ EPS levels are 43% below 2007 peak levels
against -20% for the broader market.
Chart 32: Rel EPS momentum turned positive in late 2012 Chart 33: Credit spreads lead higher bank equity EPS by two
quarters
Source: S&P Capital IQ Equity Research, Bloomberg; 9 December 2013 Source: S&P Capital IQ Equity Research; 9 December 2013
19
SX7P 2014E EPS growth of 30%, SXXP 14%, as at 9, December 2013.
40
60
80
100
Dec‐07 Dec‐08 Dec‐09 Dec‐10 Dec‐11 Dec‐12
Earnings Rel Price Rel
2.0
5.0
8.0
‐100
‐50
0
50
100
Jan‐07 Jan‐08 Jan‐09 Jan‐10 Jan‐11 Jan‐12 Jan‐13 Jan‐14
EU Banks 12m Fwd EPS (lhs, %yy) EZ Banks 12m Fwd EPS (lhs, %yy) Euro BBB Corporate Yields (%, inverted, rhs)
25. 25
S&P Capital IQ Equity Research
December 10, 2013 2014 European Strategy Outlook
On a more tangible note, lower funding costs drive net interest margins when
lending picks up and costs20
have fallen 14, 22 and 36 per cent for the Nordic, UK
and EZ banks over the past 12 months. Tightening credit spreads typically lead
bank EPS by two quarters and some of the upgrades have already materialised
(chart 33). We believe there is more to go.
Bank equity performance have also mirrored that of Senior Financials Investment
Grade CDS spreads, themselves 20% below previous cycle averages (chart 34), as
well as yields on Tier 1 bank bonds. We anticipate these tightening further in
2014.
Chart 34: Further CDS compression supports bank equity
performance
Chart 35: Funding costs lower and less fragmented
Source: S&P Capital IQ Equity Research; 9 December 2013 Source: S&P Capital IQ Equity Research, Bloomberg; 9 December 2013
As highlighted in the AQR discussion, it is sometimes folly to suggest that one
subset of banks are in a better position to outperform than others; UK and Swiss
banks, through earlier intervention, stand in better health than most EZ retail
banks. Then, perhaps for that very reason, most got hit with litigation fines
during the Q3 reporting season. Instead, we believe that the outperformance of
the sector will be broad-based although with a preference for French banks.
On a return on equity versus price-to-book basis one could conclude that Spanish
banks are expensive but we believe most are appropriately priced given their
profitability metrics.
20
Calculated using central bank base rates plus average CDS spreads across leading
domestic banks
0
100
200
300
40040.0
60.0
80.0
100.0
120.0
Jan‐11 May‐11 Sep‐11 Jan‐12 May‐12 Sep‐12 Jan‐13 May‐13 Sep‐13
Bank Equity Perf (lhs) Senior Financials IG CDS Spreads (rhs)
0
100
200
300
400
500
600
Jan‐10 Jul‐10 Jan‐11 Jul‐11 Jan‐12 Jul‐12 Jan‐13 Jul‐13
UK Banks EZ Banks Nordic Banks
bps
26. 26
S&P Capital IQ Equity Research
December 10, 2013 2014 European Strategy Outlook
Chart 36: ROE vs P/B
Source: S&P Capital IQ Equity Research; 9 December 2013.
Our Banks team expect French banks to undergo material 2014/2015
improvements due to less pressure on both deleveraging and asset quality,
allowing greater focus on profitability. We expect return on equity for the big
three French banks21
to improve by an average 185 bps by the end of 2015. Using
the slope of the relationship in chart 36, a 1.85 percentage point move would
equate to a re-rating from 0.9xTB to 1.1x – a 20% move.
21
BNP Paribas (BNPP FP, Strong Buy), Societe Generale (GLE FP, Buy), Credit Agricole
(CA FP, Hold)
Italy
Spain (rhs)
UK
France
Germany
Swiss
Sweden
0
2
4
6
8
10
12
14
0.4 0.6 0.8 1.0 1.2 1.4 1.6 1.8
ROE, %
P/B
27. 27
S&P Capital IQ Equity Research
December 10, 2013 2014 European Strategy Outlook
Belated EPS Upgrade Cycle Finally
Here
SXXP forward EPS forecasts peaked at EUR25 back in January 2011. 11 long
quarters later and the current forward EPS integer is down to EUR21.3 against a
backdrop of central bank-induced rising equity prices. Rising valuations have
hence explained most of the rally thus far. We are comfortable with 2014E/15E P/E
current valuations of 13.1 and 11.7 times as we believe we are on the cusp of a
material, multi-year earnings recovery.
10% Earnings Growth in 2014E
Our simple PMI model, where the composite leads SXXP forward EPS by eight
months, points towards an integer of EUR24.2 by the end of 2014 –13.6% higher
than current levels with risks skewed to the upside, in our view. The PMI is a
diffusion index where a calibrated reading above 50 signifies economic expansion
in the private sector (it excludes government expenditure). For corporate
earnings, however, 52 is a more significant threshold as it is at this level that we
have typically witnessed EPS upgrades. It is common in recoveries to see the PMI
series in the 55-60 range, such as in the UK currently, as inventory cycles unwind
and restocking occurs within industrial channels, and we believe there is scope
for 2014 to witness an improvement from November’s EZ reading of 51.7 in the
absence of exogenous shocks. It is for this reason that we believe risks are
skewed to the upside.
We overlay this regression model by analysing producer price inflation and unit
labour cost (ULC) trends. Our alternative model focuses on the dispersion
between the two and suggests earnings growth between 12%-16% over the next
24 months (chart 37). The model uses OECD’s forecasts of 0.9%, 0.4% and 1.5%
annual changes in ULCs over 2013-15 as inputs and the latest PPI reading of -1.4%
y-o-y. PPI troughed at -5%, -3% and -2% in 2004, 2009 and 2012 respectively and
typically lags the GDP cycle by two quarters (as does the PPI-ULC cycle but with a
wider range). On this timetable, we expect to see PPI increasing from this point
onwards and also view this as providing scope for a multi-year earnings recovery.
It would also mark 2014 as the first year that consensus earnings, currently for
13% EPS growth, are achieved since pre-crisis.
We assume that FY/13 EPS stabilise at current levels of EUR21.3. Applying
earnings growth forecasts of 14% for both 2014 and 2015 results in a FY/15 EPS
integer of EUR27.7. Given the flow of funds support from other asset classes and
the expected low volatility in economic conditions, we are sanguine about using a
13.5 times forward multiple, giving us our 375 SXXP target price for end-2014.
28. 28
S&P Capital IQ Equity Research
December 10, 2013 2014 European Strategy Outlook
Chart 37: EZ EPS model inflection point Chart 38: PMI composite leads SXXP fwd EPS by eight months
Source: S&P Capital IQ Equity Research; 9 December 2013. Assumes PPI of 1.2%, 3% and
ULC of 0.4%, 1.5% in 2014-15.
Source: S&P Capital IQ Equity Research; 9 December 2013
The threshold for margin expansion varies by region but it is typically a 1% GDP
growth rate in Europe. Extending the analyses from above, profit margins
empirically expand the most when ULCs are falling; the converse is true when
labour inflation exceeds 2% y-o-y. The OECD forecasts used for our EZ EPS model
show ULCs growing 1.5% in 2015.
The margin cycle appears to have troughed in Europe following the Q3 13
reporting season, one which was defined by a weaker-than-expected top line and
more resilient earnings. Trailing EBIT margins are currently 5.6%, 60 bps above
the trough of the past three quarters. Two observations leap out of from chart 39:
one that the gap between US and EU profitability is large and likely to mean
revert and two, that profitability is not wholly depressed as one might think.
Current levels are consistent with the peak of 2011 and are 200 and 450 bps above
the previous two recessions. Record peak margins in 2007 look challenging but
fears of an artificially-boosted profit profile should be grounded versus the
current US performance, where margins have matched 2006-07 levels largely in
the absence of a credit cycle. Our margin proxy model points towards 70 bps
expansion at the EBIT level in FY 14 to 6.3%
‐12
‐8
‐4
0
4
8
‐50
‐25
0
25
50
Mar‐07 Mar‐09 Mar‐11 Mar‐13 Mar‐15
EPS growth (%y/y, lhs) PPI ex C ‐ ULC Inflation (rhs)
Forecast
30
35
40
45
50
55
60
65
13
18
23
28
Mar‐07 Mar‐09 Mar‐11 Mar‐13
SXXP Fwd EPS (EUR, 8m lead, lhs) EZ PMI Composite (rhs)
29. 29
S&P Capital IQ Equity Research
December 10, 2013 2014 European Strategy Outlook
Chart 39: EU vs US EBIT margins Chart 40: EZ cyclicals EPS a beneficiary of a weaker euro
Source: S&P Capital IQ Equity Research, Bloomberg; 9 December 2013 Source: S&P Capital IQ Equity Research; 9 December 2013
Narrowing the gap between the US and Europe will be made easier when the
EURUSD rate weakens, as we expect it to once some confirmation on ‘taper’ is
given. EZ cyclicals would benefit disproportionately from such a scenario (Chart
40).
Biggest Margin Recovery In Cyclical
Sectors & Periphery But Beware Traps
We view Basic Resources (supply and cost inflation concerns), Oil & Gas
(expected oil price weakness and cost inflation), Telcos (persistent shrinking of
earnings capacity) and Utilities (depressed European power prices, excess
capacity) as structurally challenged rather than simply facing cyclical headwinds.
It would be unrealistic to expect any sizeable contribution to a European
profitability recovery, even if they may see some top-line recovery. Hence our
anticipated SXXP margin recovery is capped at only 30 bps. We expect the largest
contribution to come from Banks; current 6% ROE is lower than the entire
previous cycle and even the nadir of the 1993 recession. The long-term average is
just over 11%, which is a target outside our forecast horizon but low-hanging fruit
exist given how highly geared the sector is to a domestic European recovery.
Among the cyclicals, Travel & Leisure, Technology and Construction & Materials
have most catch-up potential, in our view.
0
3
6
9
Jan‐95 Jan‐98 Jan‐01 Jan‐04 Jan‐07 Jan‐10 Jan‐13
MSCI Europe S&P 500
% 112
117
122
127
132
137
142
14790
100
110
120
130
140
150
160
Jun‐09 Jun‐10 Jun‐11 Jun‐12 Jun‐13
EZ Cyc/Def EPS (index, lhs) TWI Euro (index, inverted, rhs)
30. 30
S&P Capital IQ Equity Research
December 10, 2013 2014 European Strategy Outlook
Chart 41: Current net profit margins versus trend by sector Chart 42: Current EBIT margins versus trend by sector
Source: S&P Capital IQ Equity Research; 9 December, 2013 Source: S&P Capital IQ Equity Research; 9 December, 2013
Adjusting to a cross-country lens, where market composition can muddy the
water, Italy (MIB) and Spain (IBEX) rank most depressed on both EBIT and net
profit margins. Recall that, unlike Spain, Italy didn’t feast on a credit cycle. The
UK and French markets also score weakly. The export champions DAX and OMX
have a smaller discount to previous cycle margins than the SXXP but still trade
on a discount nonetheless. The Swiss and US markets stand out with modest
premiums.
Chart 43: Current net profit margins versus trend by country Chart 44: Current EBIT margins versus trend by country
Source: S&P Capital IQ Equity Research, Bloomberg; 9 December 2013 Source: S&P Capital IQ Equity Research, Bloomberg; 9 December 2013
What is consistent are the stronger profitability performances of the all mid-cap
indices versus their domestic large cap equivalents. Note that these indices are
typically less exposed to Financials.
‐140
‐120
‐100
‐80
‐60
‐40
‐20
0
20
147%
Premium/Discount To 2003‐07 Net Profit Margins (%)
‐80
‐60
‐40
‐20
0
20
40
Premium/Discount To 2003‐07 EBIT Margins (%)
‐100
‐80
‐60
‐40
‐20
0
20
40
MDAX S&P 500 SMI FTSE 250 OMX DAX Stoxx 600 FTSE 100 Euro Stoxx CAC 40 CM100 IBEX FTSE MIB
Premium/Discount To 2003‐07 Net Profit Margins (%)
‐60
‐40
‐20
0
20
CM100 SMI MDAX S&P 500 FTSE 250 DAX OMX FTSE Italia
MC
CAC 40 Stoxx 600 FTSE 100 Euro Stoxx IBEX FTSE MIB
Premium/Discount To 2003‐07 EBIT Margins (%)
31. 31
S&P Capital IQ Equity Research
December 10, 2013 2014 European Strategy Outlook
Themes
Financials & Cyclicals
We are overweight on both Banks and Insurers as well as the majority of cyclicals
over defensives, all premised on significant earnings recoveries. We caution
however that we are either marketweight or underweight on what we deem ‘old
economy’ cyclicals: Oil & Gas, Basic Resources and Chemicals.
Financial stocks have climbed steadily since late June 2012, in our view in
response to Draghi’s game-changing speech, gaining over 54% in absolute price
terms and 19% relative. EZ banks in particular have re-rated: to 0.8x tangible book
value from 0.5x. We believe there is more to go. Financials’ EPS outturns remain
35% below the SXXP since the end of 2007 (chart 45), over 50% in absolute terms,
and we expect this to close over the coming years, as highlighted in the earlier
chapters.
Cyclicals’ EPS are similarly below 2007 levels (-10%), but given the depressed
nature of SXXP earnings inclusive of Financials, they are 13% above relatively.
This outperformance was booked between 2010-11, however, and thereon both
defensives and financials have witnessed stronger relative EPS momentum.
Chart 45: Relative EPS trends by group Chart 46: Cyc/Def EPS versus EZ composite PMI
Source: S&P Capital IQ Equity Research; relative to SXXP; 9 December, 2013 Source: S&P Capital IQ Equity Research; 9 December, 2013
This may be about to reverse judging by the current PMI composite trajectory
(chart 46). The latter typically leads the cyclical/defensive EPS dynamic by three
quarters and suggests 30% earnings outperformance in that period. Current
consensus 2014E EPS growth forecasts average 21% for Cyclicals and nearly 6%
for Defensives, equating to a 15 percentage point spread. In addition, those
forecasts include some that will be difficult to attain, in our view, particularly
22.7% for Basic Resources and 13.5% for Oil & Gas. The SXXP is currently pricing
in 13.6% EPS growth in 2014, with Utilities the only sector with negative earnings
growth. Cyclical sectors are expected to deliver the greatest earnings recovery
‐40
‐30
‐20
‐10
0
10
20
30
40
Dec‐07 Dec‐08 Dec‐09 Dec‐10 Dec‐11 Dec‐12
Financials Rel EPS Cyclicals Rel EPS Defensives Rel EPS
%
‐60
‐40
‐20
0
20
40
60
80
100
35
40
45
50
55
60
65
Jun‐06 Jun‐08 Jun‐10 Jun‐12
EZ PMI Comp (lhs) Europe Cyc/ Def Fwd EPS (%yy, 3q lag, rhs)
Cyclicals outperform defensives
32. 32
S&P Capital IQ Equity Research
December 10, 2013 2014 European Strategy Outlook
and all bar Media have higher growth forecasts than defensives (table 3). Drilling
down, defensives are premised on a modestly higher revenue rebound but
operating margins are less depressed than many of their cyclical peers.
In regards to prices and investor positioning, our cyclical-defensive dynamic fits
well with movements in the CESI indices (chart 47). These daily indices move in
sync with the monthly PMIs and have behaved more range-bound with the latter
in close proximity to the 50 threshold levels. We expect them to move higher in
2014. Cyclicals have re-rated modestly above their relative long-term average
levels and hence their prices are no longer depressed. Their greatest attraction
however lies in the fact that the strength of their earnings recovery will reduce
this slight over-valuation quickly in our view.
Chart 47: Cyclicals have moved in line with fundamentals Chart48: Cyc/Def valuations no longer depressed
Source: S&P Capital IQ Equity Research; 9 December 2013 Source: S&P Capital IQ Equity Research; 9 December 2013
The structure, age and competitiveness of each industry can be different and
hence they trade within different valuation ranges. Large pockets of European
equities are expensive when measured against depressed earnings but much
cheaper against book values. Hence, we recalibrate different valuation metrics
(P/E, P/B and EV/Sales) to gauge how over- or under-valued they may be via the
number of standard deviations above or below their long-term norms.
In an attempt to gain greatest clarity, sectors will have to be above or below all
three measures to be definitively classified as either expensive or cheap. In terms
of the cyclical-defensive debate, the results are neutral: Chemicals, Industrial
Goods & Services, Media and Technology are expensive, as are Food &
Beverages, Healthcare, Personal & Household Goods and Retail.
78
82
86
90
94
98
‐100
‐50
0
50
100
Jan‐12 Apr‐12 Jul‐12 Oct‐12 Jan‐13 Apr‐13 Jul‐13 Oct‐13
CESI EZ (lhs) Europe Cyc/ Def (rebased, rhs)
Cyclicals outperform defensives
0.55
0.65
0.75
0.85
0.95
Jul‐10 Jan‐11 Jul‐11 Jan‐12 Jul‐12 Jan‐13 Jul‐13
Cyclicals Forward PE rel to Defensives
Cyclicals re‐rating
Avg: 0.75
33. 33
S&P Capital IQ Equity Research
December 10, 2013 2014 European Strategy Outlook
Table 3: Sector scorecard
Source: S&P Capital IQ Equity Research; operating leverage and valuation metrics measured between 2005-2013 ytd; 9
December, 2013
Domestic EU > US > EMs
We continue to prefer EZ domestic plays as well as US exposure but remain wary
of EM exposed names. Performance has been inconsistent throughout the
quarters of 2013: the US-exposed basket was the standout performer in Q1 as
both Domestic EU- and EM-exposed buckets posted negative returns; these
continued in Q2 for EMs and EU stocks rebounded to close the gap on the US
basket, which had plateaued, before ending the year very strongly (30.3% ytd,
Table 4). We believe that this order will be repeated in 2014.
The China basket climbed 6.5% this year and consensus forecasts are for over
20% EPS growth next year, an attractive combination for some no doubt. We are
unsure how these earnings will be achieved given the reliance on the Miners and
Mining equipment and Luxury Goods revenues weren’t depressed this year.
Instead the EZ domestic Cyclicals basket highlights many of the trends we have
discussed: most expensive P/E on depressed earnings, at 15.5x 2014E, and 1.4x
P/B 2014E being the cheapest. We are confident that these valuations will be
reduced by a growing earnings base.
EBIT Margin
Improvement
Operating
Leverage
EPS Revenues (y/y, bps) PE PB EV/Sales
Autos & Parts 21.5 5.3 37 -0.1 0.6 0.3 0.8
Basic Resources 22.1 5.5 97 1.1 -0.9 -1.4 0.4
Chemicals 12.4 2.8 89 1.6 1.7 2.1 1.1
Construction & Materials 18.2 2.2 70 1.7 -0.2 -0.3 0.8
Industrial Goods & Services 15.1 4.4 74 1.4 1.0 1.6 1.2
Media 10.4 2.1 79 2.9 1.5 2.0 1.2
Oil & Gas 13.0 0.9 99 0.6 -1.0 -1.0 0.6
Travel & Leisure 31.4 3.9 98 1.0 1.6 -0.3 0.1
Technology 45.5 1.4 295 2.0 0.8 1.1 0.6
21.1 3.2 104 1.4 0.6 0.5 0.8
Food & Beverages 9.3 4.7 61 1.5 0.8 1.8 1.3
Healthcare 8.2 3.7 82 0.9 0.2 0.8 0.9
Personal & Household Goods 11.3 6.1 64 1.1 2.0 2.1 1.5
Retailers 10.0 4.8 18 1.8 1.0 0.4 1.1
Telcoms -0.4 -0.3 53 1.8 1.4 -0.2 1.0
Utilities -4.2 1.1 -25 0.6 -0.9 -1.3 0.7
5.7 3.4 42 1.3 0.8 0.6 1.1
DJ Stoxx 600 13.5 3.3 65 1.8 -0.1 -0.8 0.7
2014 Growth (%) Valuations (StDev Above/Below Avgs)
34. 34
S&P Capital IQ Equity Research
December 10, 2013 2014 European Strategy Outlook
Chart 49: Long-term relative performance by key
geographies
Table 4: Fundamentals by basket
Source: S&P Capital IQ Equity Research, Bloomberg; relative to SXXP, 9 December 2013 Source: S&P Capital IQ Equity Research, Bloomberg; 9 December 2013
The superior growth impulse from EMs during the last cycle is unlikely to be
repeated. GDP growth profiles are still higher vis-à-vis developed market (DM)
economies but a strong USD environment has significant adverse implications for
both EM economies and European revenues generated from them.
Chart 50: EM currencies performance since ‘taper’
announcement
Chart 51: EM financial conditions a negative
Source: S&P Capital IQ Equity Research; 9 December, 2013 Source: S&P Capital IQ Equity Research; 9 December, 2013
In the same period, hard currencies uniformly appreciated against the USD: the
yen by 1.3%, euro by 4%, Swiss franc 5.4% and sterling by 6%. We believe that
these will unwind over the next 12 months but the pace will likely differ between
them. For example, we expect the euro to depreciate quicker than the cable rate.
-30
-20
-10
0
10
20
30
40
Jan-06 Jan-07 Jan-08 Jan-09 Jan-10 Jan-11 Jan-12 Jan-13
BRICs US Exposure Domestic EU
%
Theme Perf YTD(%) P/E P/B ROE Revenue Growth (%) EPS Growth (%)
China Exposure 6.5 14.0 1.9 10.2 4.6 20.3
EZ Domestic Cycs 30.3 15.5 1.4 4.6 2.3 14.6
UK Domestic 26.0 13.7 2.1 5.7 5.9 13.0
US Exposure 22.1 14.7 2.2 13.6 4.0 15.9
Stoxx 600 16.6 13.4 1.8 8.9 3.1 13.5
SXXPCyclicals 17.9 13.8 2.2 13.7 3.7 16.7
SXXPDefensives 16.4 15.0 2.9 17.6 3.1 5.0
MSCIGrowth 14.9 15.7 2.6 6.0 5.0 18.1
MSCIValue 16.3 11.4 1.4 10.1 1.9 9.4
2014E
‐20
‐15
‐10
‐5
0
5
% Performance Since Fed Taper Announcement (May 22)
‐1.8
‐1.2
‐0.6
0
0.6
1.2
1.8
Dec‐12 Mar‐13 Jun‐13 Sep‐13
US Financial Conditions Asia ex Japan Financial Conditions EZ Financial Conditions
Tighter Financial Conditions
Easier Financial ConditionsIndex
35. 35
S&P Capital IQ Equity Research
December 10, 2013 2014 European Strategy Outlook
Choose Value Over Growth
The argument of value over growth is often blurred, in our view as different
language is used to describe the same thing. It is predominantly determined by
top-and bottom-slicing of market constituents by their ranked price-to-book
values and hence sector representation varies significantly. Continental Europe is
historically market-cap weighted towards value stocks, versus higher
representation towards growth stocks in the US. Within Europe, a preference for
growth would exclude our conviction call on Financials and invest instead in the
defensive growth subset which we believe will underperform as their elevated
valuation premiums unwind. Ergo, based on our supersector recommendations,
we favour value over growth.
Chart 52: Value more attractive when volatility ebbs Chart 53: Value typically outperforms during rising bond yields
Source: S&P Capital IQ Equity Research; 9 December, 2013 Source: S&P Capital IQ Equity Research; 9 December, 2013
Volatility and yield levels are primary determinants of the relative performance
between value and growth styles, as evidenced by the relationships with the
VStoxx volatility index (chart 52) and US Treasury 10-year yields (chart 53). What
is distinctive is the identical performances of the styles globally: since 2000, the
difference between US and European performances of their respective
growth/value dynamic is a solitary percentage point. Since Q2 2007, growth has
outperformed value by 31% in Europe and 26% in the US. We think this will
unwind.
An extension of this style analysis is to consider the investment position of
higher quality names, loosely determined by the strong financial flexibility of a
healthy balance sheet and consistent top-line sales momentum. These stocks
matched the peaks and troughs of the 2003-09 cycle according to our cousins in
S&P Capital IQ Alpha Factor Library (an independent division of McGraw-Hill
Financial) but have outperformed by 62% since the end of 2011. We expect this to
unwind over the coming 12 months.
0
10
20
30
40
50
60
70
0.5
0.6
0.7
0.8
Jun‐03 Jun‐05 Jun‐07 Jun‐09 Jun‐11 Jun‐13
EU Growth / Value (lhs) V2X (price, rhs)
Growth outperforms value
Ratio
0
1
2
3
4
5
6
70.5
0.6
0.7
0.8
Jun‐03 Jun‐05 Jun‐07 Jun‐09 Jun‐11 Jun‐13
EU Growth / Value (lhs) UST 10Yr Yields (%, inverted, rhs)
Ratio
36. 36
S&P Capital IQ Equity Research
December 10, 2013 2014 European Strategy Outlook
Time To Overweight The Periphery
Of the major global markets, the FTSE MIB and IBOVESPA indices offer the
deepest value from a 2014E P/E to EPS growth snapshot (chart 54). A common
reaction function is question if either resemble a value trap? 2013 year-to-date
performance is a key distinction between them; Italy, up 12.5% in local terms, is
in keeping with the pack of European markets while Brazil, down 16%, is one of
the worst performers globally.
Chart 54: 2014E P/E versus EPS growth Chart 55: 2014E ROE versus P/B
Source: S&P Capital IQ Equity Research; 9 December 2013 Source: S&P Capital IQ Equity Research; 9 December 2013
National markets are more consistently priced on a ROE / Price to Book basis
(chart 55). US, Swiss and Nordic markets are more highly valued for their
profitability while the periphery markets, and French in close proximity, score
lowest.
But what is the likelihood of a ROE recovery, and does the current weakness
augur for future profits? Starting at the European-level, the SXXP exhibited ROE
levels between 14%-15% between 2006-08 before troughing around 8% during
2009. Current levels of 8.9% are consistent with the 2004 recovery and we note
that US ROE has returned to pre-2007 levels without extended bank lending.
Italian ROE levels are the weakest at 3.8% but Spanish profitability has taken the
biggest dive from an overheated pre-crisis 22% to 6.8% currently. Now, both
Italian and Spanish markets have some of the highest exposure to Financials in
the world with 31% and 33% respectively (behind China at 42%). 2013 may have
seen the beginning of rising bond yields but it has not been uniform; it has been
concentrated on previous safe havens and the more distressed sovereigns, and
corporates, have seen continued risk compression throughout the year. Italian
and Spanish spreads are still wide versus Bunds and we anticipate this to tighten
further in 2014. Under this scenario, one would expect Financials to gain an
advantage via cheaper cost of funds as well as Utilities. Recall too that the SME-
heavy, credit-constrained peripheral economies will see a trickle-down effect if
Banks have easier financial conditions. This could provide an upside lever to the
current depressed non-financial ROE 10.7% in Italy and 11.1% in Spain.
CAC 40
DAX
IBEX 35
FTSE MIB
OMX 30
SMI
Euro Stoxx 50 Pr
S&P 500
NIKKEI 225
IBOVESPA
ASX 200
FTSE 250
MDAX
CAC Mid 60
FTSE Italia Mid Cap
S&P 400
FTSE 100
SXXP
S&P 600
SHCOMP
7
10
13
16
19
0 10 20 30
2014 PEs
2014E EPS Growth (%)
CAC 40
DAX
IBEX 35
FTSE MIB
OMX 30
SMI
Euro Stoxx 50 Pr
S&P 500
NIKKEI 225
IBOVESPA
ASX 200
FTSE 250
MDAX
CAC Mid 60
FTSE Italia Mid Cap
S&P 400
FTSE 100
SXXP
S&P 600
SHCOMP
0.5
1.5
2.5
0 5 10 15
2014E P/B
2014E ROE (%)
37. 37
S&P Capital IQ Equity Research
December 10, 2013 2014 European Strategy Outlook
By comparison, the DAX has had far less volatile movements in ROE levels (it
also has the lowest exposure to Financials): averaging 12% during 2005-08 versus
11.2% currently. CAC40 is similarly light in Financials exposure and although less
cyclical than the DAX, exhibited a higher 2005-08 ROE profile of 18% before
trending down to 9.2% presently. For most ease of comparison, we can group the
markets into regional baskets of Core (CAC, DAX), Northern (FTSE100, SMI, OMX)
and Periphery (MIB, IBEX). Now we can clearly see that Core ROE levels are more
consistent and less disturbed; Northern and Periphery markets had similar ROE
profiles leading up to the Great Recession but it is the Periphery that is clearly
distressed now (chart 56).
Chart 56: ROE evolution of Core, Northern and Periphery Chart 57: Peripheral margins deteriorated post EZ sovereign
crisis, not Great Recession
Source: S&P Capital IQ Equity Research; 10 December, 2013. Core = CAC and DAX;
Northern = FTSE100, SMI, OMX; Periphery = FTSEMIB, IBEX.
Source: S&P Capital IQ Equity Research; 9 December, 2013
Another distinctive feature has been the differing timelines of net and operating
profit margins. Government measures for Banks to improve the quality of their
balance sheets, via the implementation of Royal Decrees and introduction of
SAREB (the ‘bad bank’) led to a more expedient downturn in ROE levels in Spain
and, to a lesser extent, Italy. Operating margins, more representative of the
broader market and before any exceptional items are included, maintained their
strong profile until the middle of 2011 when they fell by more than a third (chart
57). Hence the Eurozone sovereign crisis offers the greater explanation to the
peripheral equity underperformance and we can safely assume that the worst of
that crisis is behind us.
2
6
10
14
18
22
Jun-05 Jun-07 Jun-09 Jun-11 Jun-13
Core Northern Periphery
%
5.0
10.0
15.0
20.0
Jun-05 Jun-07 Jun-09 Jun-11 Jun-13
Core Northern Periphery
%
38. 38
S&P Capital IQ Equity Research
December 10, 2013 2014 European Strategy Outlook
Chart 58: Periphery Still Adrift Other EU Equities (rebased) Chart 59: Peripheral Govt Spreads Likely To Tighten Further
Source: S&P Capital IQ Equity Research; 9 December, 2013 Source: S&P Capital IQ Equity Research; spreads versus 10year Bunds; 9 December, 2013
Recent peripheral equity performance has been strong, up 21% in H2 thus far, but
don’t let that leave the impression that an opportunity has been missed.
Peripheral markets are only 25% above their Q1 2009 lows; the equivalent returns
for Core and Northern markets are 92% and 79% respectively. Equity risk premia
remain high for global equities and their likely compression will provide a
support vis-à-vis other asset classes. This is most pronounced in the Periphery;
for example, government spreads are still 80 bps above pre-EZ sovereign
crisis/post Great Recession levels (chart 59).
The IBEX and FTSE MIB have moved in lock-step over the past four years. Within
Spanish equities, cyclicals remain depressed and have failed to outperform
defensives that would be consistent with cyclical improvements in the economy
(chart 60). Government bond yields of 4.1% have typically translated into Spanish
financials trading at 2.3x book value. Those valuations may be both punchy and
premature given the issues of asset quality and ECB dependence but current book
values of only 1.1x are pricing in an awful lot of bad news.
Chart 60: Spanish cyclicals have catch-up potential Chart 61: As do Spanish financials
Source: S&P Capital IQ Equity Research, Markit; 9 December, 2013 Source: S&P Capital IQ Equity Research; 9 December, 2013
40
60
80
100
120
140
160
180
200
Jun-05 Jun-07 Jun-09 Jun-11 Jun-13
Core Northern Periphery
Price (rebased)
0
100
200
300
400
500
600
Mar‐03 Mar‐05 Mar‐07 Mar‐09 Mar‐11 Mar‐13
Italy Spain
Spreads
37
39
41
43
45
47
49
51
53
0.6
0.7
0.8
0.9
1.0
1.1
Jan‐10 Jul‐10 Jan‐11 Jul‐11 Jan‐12 Jul‐12 Jan‐13 Jul‐13
Cyclicals/Defensives: Perf (lhs) PMI Spain Composite (rhs)
Ratio
2
3
4
5
6
7
80.0
0.5
1.0
1.5
2.0
2.5
3.0
3.5
Jan‐02 Jan‐04 Jan‐06 Jan‐08 Jan‐10 Jan‐12
Financials P/B (lhs) 10yr Govt Yields (%, inverted, rhs)
39. 39
S&P Capital IQ Equity Research
December 10, 2013 2014 European Strategy Outlook
Sectors
Current Consensus Forecasts
One of the underlying themes of this outlook is addressing depressed earnings
with discounted book values. On 2014 earnings basis, Food & Beverages and
Telecoms appear most expensive with Autos & Parts, Banks, Oil & Gas and Basic
Resources the cheapest. Interestingly, irrelevant of their cyclical or defensive
profile, many supersectors are clustered together (including Healthcare, Industrial
Goods & Services and Retailers, circled in chart 62). All of this group bar
Industrials Goods and Services are more expensive than the SXXP but offer less
earnings growth.
Technology stands out as the most expensive supersector on a price-to-book
basis (chart 63), with most fairly valued when measured against 2014 return on
equity forecasts. Greatest value opportunities appear to be in Autos & Parts,
Banks and Insurers, Basic Resources, Oil & Gas and Utilities.
Chart 62: 2014E P/E versus EPS Growth Chart 63: 2014E ROE versus P/B
Source: S&P Capital IQ Equity Research; 9 December, 2013 Source: S&P Capital IQ Equity Research; 9 December, 2013
Most Preferred
We retain our positive view that Automobile & Parts will be a direct beneficiary of
the domestic European growth impulse and its current sector outperformance has
further room to grow. It has high operational leverage versus peers, is a more
profitable industry than in previous cycles encapsulated by greater production
harmonisation between product ranges and spurred on a very strong euro in the
past cycle. Our view of future EURUSD weakness will provide an accelerator to
the sector’s EPS profile. Car production levels are less than half of 2003 levels in
France and Italy, partly because of the structural overcapacity issues within
Europe but also due to the depressed household sector. The mass market OEMs
have greatest exposure in these weaker markets but they too appear to have
found a bottom in profits as November adjusted sales figures were reasonable in
Basic Res
Retailers
Media
F&B
Insurers
Fin Svs Chem
Const & Mats
Pers & HHGs
Oil & Gas
Ind G&S
T&LHealthcare
Telcos
Autos
SXXP
7
10
13
16
0 10 20 30
2014 PEs
2014E EPS Growth (%)
Tech: 18.7x, 183%
Banks: 11x, 76%
Basic Res
Retailers
Media
F&B
Banks
Insurers
Fin Svs
Chem
Const & Mats
Pers & HHGs
Oil & Gas
Ind G&S
T&L
Healthcare
Tech
Util
Telcos
Autos
SXXP
0.8
1.8
2.8
0 10 20 30
2014E P/B
2014E ROE (%)
40. 40
S&P Capital IQ Equity Research
December 10, 2013 2014 European Strategy Outlook
Italy, France and Spain. The premium OEMs, which have lagged for large parts of
the year in share price terms, are gathering sales momentum with management
looking to reduce the normal fortnight plant closures over the Christmas period.
Chart 64: Returning consumer confidence driving auto sales Chart 65: Car production levels (% from 2003 levels)
Source: S&P Capital IQ Equity Research; 9 December, 2013 Source: S&P Capital IQ Equity Research, OICA; 9 December, 2013
Media continues to invest more heavily towards digitalisation, resulting in an
incrementally higher ROE profile. With global GDP growth accelerating in 2014,
and likely to be upgraded in our view, current consensus EPS growth forecasts of
10% look low. We favour the agencies and broadcasters of the more defensive
publishers.
Total advertising revenues are between -1% and 2% from their 2007 levels in the
big economies of France, Germany and UK but are a staggering 19% and 42%
below in Italy and Spain respectively. Magnaglobal forecasts that annual growth
in total advertising revenues in North America will accelerate from 0.7% at the
end of 2013 to 5.6% one year out and swing from -0.1% to 2.5% in Europe. Given
the sensitivities to the economic cycle, we believe the current global forecast of
4.5% will be revised up.
Chart 66: Ad agencies superior EPS profile (rebased) Chart 67: Media is 2x geared into GDP cycle
Source: S&P Capital IQ Equity Research; 9 December, 2013 Source: S&P Capital IQ Equity Research, Magnaglobal; 9 December, 2013
‐30
‐20
‐10
0
10
20
30
‐40
‐30
‐20
‐10
0
10
Jan‐05 Jan‐07 Jan‐09 Jan‐11 Jan‐13
EU Consumer Confidence (lhs) EU New Car Registrations (%yy, rhs)
‐70
‐60
‐50
‐40
‐30
‐20
‐10
0
10
Germany US UK Spain France Italy
Car Production Levels (% from 2003)
80
90
100
110
120
Dec-11 Jun-12 Dec-12 Jun-13
Broadcasters Ad Agencies Publishers
‐15
‐10
‐5
0
5
10
15
‐6
‐3
0
3
6
Dec‐99 Dec‐01 Dec‐03 Dec‐05 Dec‐07 Dec‐09 Dec‐11 Dec‐13
Global GDP Growth (%y/y, lhs) Global Advertising Spend (%y/y, rhs)
41. 41
S&P Capital IQ Equity Research
December 10, 2013 2014 European Strategy Outlook
We upgrade Construction & Materials to overweight from marketweight on the
combination of a visible EPS recovery and still attractive valuations. The sector is
highly geared into a domestic European recovery and has high operational
leverage. European construction confidence has rebounded impressively in H2
2013 and is now at a five-year high, against production levels 23% below the pre-
crisis peak. Similarly, forward EPS are 44% below such levels but we expect this
to narrow as consensus estimates get upgraded (chart 68). Price to book values
of 1.6x is comfortably below the long-term average and can be expected to re-
rate above during a fully-fledged recovery.
Chart 68: Construction & Materials EPS Recovery Chart 69: Construction & Materials P/B Below LT Average
Source: S&P Capital IQ Equity Research, Bloomberg; 9 December, 2013 Source: S&P Capital IQ Equity Research, Bloomberg; 9 December, 2013
Weakness in Basic Resources prices have reflected their overexposure to China.
The recently announced reforms are viewed as positive and hence reduce our
fears of a significant Chinese slowdown and higher volatility. The caveat however
is that structural reforms take longer to feed through than cyclical government
measures and Basic Resources remain exposed in the interim.
Industrial metals typically have an inverse relationship with USD and our
expectations of a secular USD bull run will be a significant headwind: Basic
Resources share prices have had a 79% correlation with the copper price over the
past 24 months. It will be challenging for the copper price given current LME
inventories are elevated at over 411,000 metric tonnes. To put this in context,
these inventories were 48,875 tonnes at the beginning of the last cycle in 2004.
‐50
‐40
‐30
‐20
‐10
0
10
20
30
‐45
‐40
‐35
‐30
‐25
‐20
Oct‐08 Oct‐09 Oct‐10 Oct‐11 Oct‐12 Oct‐13
EU Construction Confidence (lhs) Construction & Materials EPS (%yy, rhs)
0.0
1.0
2.0
3.0
Jan-03 Jan-05 Jan-07 Jan-09 Jan-11 Jan-13
SXOP Fwd Price To Book
42. 42
S&P Capital IQ Equity Research
December 10, 2013 2014 European Strategy Outlook
Chart 70: Copper inventories approaching multi-year highs Chart 71: Strong USD cycle a headwind for industrial metals
Source: S&P Capital IQ Equity Research, LME, Bloomberg; 9 December, 2013 Source: S&P Capital IQ Equity Research, CRB, Bloomberg; 9 December, 2013
We anticipate a material upturn in gross fixed capital formation in both Europe
and the US in 2014, as previously outlined. Our overweight position on Industrial
Goods & Services captures this but recent relative performance trends do not.
The sector is not cheap, as the sector scorecard showed it is above last cycle’s
short-term and longer-term valuation metrics. However, these have only adjusted
to the greater cost discipline and hence higher profitability profile. We continue
to favour the secular growth story in commercial aerospace as well as industrial
conglomerates and professional services.
Chart 72: Industrials ‘priced for imperfection’ Chart 73: ROE profile has shifted higher
Source: S&P Capital IQ Equity Research, Bloomberg; 9 December, 2013 Source: S&P Capital IQ Equity Research, Bloomberg; 9 December, 2013
0
200,000
400,000
600,000
800,000
1,000,000
Dec-95 Dec-98 Dec-01 Dec-04 Dec-07 Dec-10 Dec-13
LME Warehouse Copper Stocks (inverted, tonnes, rhs)
June: 665k
65
75
85
95300
500
700
900
1100
Dec-05 Dec-08 Dec-11
CRB Metals (lhs) DXY Index (inverted, rhs)
USD Strengthening
‐20
‐15
‐10
‐5
0
5
10
‐20
‐10
0
10
20
30
Jan‐05 Jan‐07 Jan‐09 Jan‐11 Jan‐13
SXNP Rel Perf (6m lead, %yy, lhs) EZ GFCF Growth (%y/y, rhs)
10
12
14
16
18
20
22
Mar-09 Mar-10 Mar-11 Mar-12 Mar-13
Industrial Goods & Services ROE
%
43. 43
S&P Capital IQ Equity Research
December 10, 2013 2014 European Strategy Outlook
Healthcare remains our preferred defensive sector. The structural issues of the
patent cycle are now behind us and our analysts as most confident about the
pipeline of large-cap pharma for many years, particularly Phase two. From a
higher level, the US remains the largest market and hence USD sensitivity is
significant (chart 75). Our expectations for a multi-year appreciation of the
USDEUR rate, signalled by the Fed’s announcement on tapering their asset
purchases, should aid sector outperformance. Additionally, while the sector will
underperform in the early recovery stages, we estimate that it tends to catch up
once the ISM Manufacturing New Orders have peaked. November’s reading of
60.6 is in peak territory in our view.
Chart 74: Peak in ISM Manufacturing New Orders Typically
A Positive
Chart 75: Healthcare would benefit from a strong USD cycle
Source: S&P Capital IQ Equity Research, Bloomberg; 9 December, 2013 Source: S&P Capital IQ Equity Research, Bloomberg; 9 December, 2013
Travel & Leisure continues to exhibit a superior earnings profile in relation to the
SXXP. The sector composition ranges from gambling to recreational activities but
the two key drivers, airlines and hotels, both have the potential to see EPS
upgrades in 2014. Airlines will be a direct beneficiary of our expectations for
weak oil prices while revenue per room trends should improve on the
combination of higher business and household expenditure.
Chart 76: T&L relative EPS momentum impressive (rebased) Chart 77: Airlines benefit from weak oil prices
Source: S&P Capital IQ Equity Research, Bloomberg; 9 December, 2013 Source: S&P Capital IQ Equity Research, Bloomberg; 9 December, 2013
-50
-25
0
25
5020
30
40
50
60
70
Jan-02 Jan-04 Jan-06 Jan-08 Jan-10 Jan-12
US ISM Mfg New Orders (lhs) Healthcare Rel Perf (%yy, inverted, rhs)
-50
-25
0
25
50
-20
-10
0
10
20
30
Jan-05 Jan-07 Jan-09 Jan-11 Jan-13
USD TWI (%yy, lhs) Healthcare Rel Perf (%yy, rhs)
70
80
90
100
110
120
Dec‐07 Dec‐08 Dec‐09 Dec‐10 Dec‐11 Dec‐12
Earnings Rel Price Rel
‐40
‐20
0
20
40
60
80
100‐80
‐60
‐40
‐20
0
20
40
60
80
100
Jan‐01 Jan‐04 Jan‐07 Jan‐10 Jan‐13
WTI (%12m, inverted, lhs) Airlines Rel Perf (%12m, rhs)