SlideShare uma empresa Scribd logo
1 de 70
Baixar para ler offline
Major Procedures Mortality
CABG, Valve, and Valve+CABG Procedures Combined1
Participant 30863
STS Period Ending 09/30/2017
2017 is a partial year: Jan 2017 - Sept 2017
Participant 30863 Like Group STS
2015 2016 2017 2017 2017
Number of Cases - 33 143 74,094 164,896
Mortality Summary
In-hospital Mortality ................................... - 3.0% 1.4% 2.2% 2.0%
Operative Mortality ................................... - 3.0% 2.1% 2.9% 2.6%
Mortality Risk-Adjustment2
In-hospital Mortality
Odds Ratio ............................................ - 1.07 0.79 1.27 1.00
Lower 95% Confidence Limit .............. - 0.44 0.39 1.14 -
Upper 95% Confidence Limit .............. - 2.60 1.61 1.41 -
O/E Ratio ............................................... - 1.60 0.54 1.10 1.00
Lower 95% Confidence Limit .............. - 0.09 0.01 1.05 -
Upper 95% Confidence Limit .............. - 8.13 1.42 1.16 -
Risk-adjusted Rate ................................ - 3.1% 1.1% 2.2% 2.0%
Operative Mortality
Odds Ratio ............................................ - 1.02 0.81 1.30 1.00
Lower 95% Confidence Limit .............. - 0.46 0.42 1.18 -
Upper 95% Confidence Limit .............. - 2.26 1.57 1.43 -
O/E Ratio ............................................... - 1.24 0.62 1.11 1.00
Lower 95% Confidence Limit .............. - 0.07 0.07 1.08 -
Upper 95% Confidence Limit .............. - 6.40 1.42 1.17 -
Risk-adjusted Rate ................................ - 3.0% 1.6% 2.8% 2.5%
1
Includes all 7 Major Procedure Categories (CABG, AVR, AVR+CABG, MVR, MVR+CABG,
MVP, MVP+CABG)
2
Refer to the Report Overview for information on risk-adjustment methodology
Risk-adjustment is not performed on time periods of less than 6 months
Major Procedures -- 7
Major Procedures -- 8
Isolated CABG Procedures
Data Summary
Participant 30863
STS Period Ending 09/30/2017
2017 is a partial year: Jan 2017 - Sept 2017
Participant 30863 Like Group STS
2015 2016 2017 2017 2017
Number of Cases - 32 116 54,881 116,231
Demographics
Age (years)
Mean ..................................................... - 72.7 69.1 65.6 65.6
Median ................................................... - 72.5 70.0 66.0 66.0
25th
Percentile ....................................... - 68.5 63.0 59.0 59.0
75th
Percentile ....................................... - 78.0 76.0 73.0 73.0
Age >= 65 years old .............................. - 87.5% 66.4% 56.7% 56.5%
Gender, Female ........................................ - 9.4% 25.9% 24.5% 24.5%
Missing .................................................. - 0.0% 0.0% 0.0% 0.0%
Race1
Caucasian ............................................. - 93.8% 97.4% 83.3% 82.7%
Black ...................................................... - 0.0% 0.0% 6.6% 7.4%
Asian ..................................................... - 0.0% 0.0% 3.7% 3.5%
Native American .................................... - 3.1% 2.6% 0.8% 0.6%
Native Hawaiian/Pacific Islander ........... - 0.0% 0.0% 0.5% 0.5%
Other ..................................................... - 0.0% 1.7% 3.8% 3.4%
Multiple Races ....................................... - 0.0% 2.6% 1.2% 0.9%
Missing / Not Documented .................... - 3.1% 0.9% 2.5% 2.9%
Pt. Declined to Disclose2
....................... - 3.1% 0.9% 0.5% 0.6%
Hispanic or Latino or Spanish Ethnicity .... - 28.1% 36.2% 9.2% 7.4%
Missing/ Not Documented ..................... - 6.3% 0.9% 4.1% 4.1%
Body Mass Index3
Underweight (BMI < 18.5) ...................... - 0.0% 0.9% 0.7% 0.7%
Normal (BMI 18.5 - 24.9) ....................... - 28.1% 18.1% 17.3% 17.7%
Overweight (BMI 25.0 - 29.9) ................ - 28.1% 37.1% 37.0% 36.9%
Obese I (BMI 30.0 - 34.9) ...................... - 34.4% 31.0% 26.9% 27.0%
Obese II (BMI 35.0 - 39.9) ..................... - 9.4% 7.8% 11.7% 11.6%
Morbid Obesity (BMI 40.0+) ................... - 0.0% 5.2% 6.3% 6.0%
Missing Height ....................................... - 0.0% 0.0% 0.1% 0.1% 1
Data presented in the report represent the individual response rates for each race category
Missing Weight ...................................... - 0.0% 0.0% 0.1% 0.1% shown; summing the individual non-caucasian categories will not result in the same rates as
shown in the graph since non-caucasian, as defined for the graph, does not include races or
ethnicities reported in combination with caucasian
2
Option added in v2.81
3
BMI = Weight(kg) / Height(m)2
CABG -- 9
Isolated CABG Procedures
Data Summary
Participant 30863
STS Period Ending 09/30/2017
2017 is a partial year: Jan 2017 - Sept 2017
Participant 30863 Like Group STS
2015 2016 2017 2017 2017
Comorbidities
Diabetes Mellitus ...................................... - 46.9% 51.7% 49.4% 49.3%
Diet Control ........................................ - 0.0% 1.7% 2.9% 2.8%
Oral Control ........................................ - 12.5% 14.7% 22.4% 22.3%
Insulin Control .................................... - 25.0% 34.5% 18.0% 18.2%
Other SQ Medication Control1
............ - 0.0% 0.0% 0.4% 0.4%
Other Control ...................................... - 0.0% 0.0% 0.1% 0.1%
Missing Control ................................... - 13.3% 1.7% 0.9% 0.8%
Missing .................................................. - 3.1% 0.9% 0.2% 0.2%
Hypertension ............................................ - 71.9% 87.9% 89.4% 89.4%
Missing .................................................. - 3.1% 0.9% 0.2% 0.2%
Dyslipidemia ............................................. - 71.9% 79.3% 89.6% 90.2%
Missing .................................................. - 3.1% 3.4% 0.3% 0.3%
Family History of CAD .............................. - 50.0% 44.8% 23.3% 20.6%
Missing .................................................. - 9.4% 24.1% 4.3% 4.4%
Current/Recent Cigarette Smoker ............ - 9.4% 21.6% 22.6% 22.0%
Smoker, Current Status Unknown1
........ - 6.3% 0.9% 0.5% 0.5%
Missing .................................................. - 6.3% 11.2% 0.6% 0.6%
Chronic Lung Disease
Mild ........................................................ - 3.1% 12.9% 10.1% 9.5%
Moderate ............................................... - 3.1% 11.2% 5.2% 4.6%
Severe ................................................... - 0.0% 6.9% 4.2% 4.0%
Unknown Severity1
................................ - 21.9% 27.6% 7.4% 7.1%
Missing .................................................. - 25.0% 16.4% 3.1% 2.7%
Congestive Heart Failure .......................... - 3.1% 36.2% 17.7% 18.4%
CHF / NYHA Class I2
.......................... - 3.1% 20.7% 1.5% 1.9%
CHF / NYHA Class II .......................... - 0.0% 8.6% 5.2% 5.7%
CHF / NYHA Class III ......................... - 0.0% 5.2% 7.2% 7.4%
CHF / NYHA Class IV ......................... - 0.0% 0.9% 4.2% 4.1%
CHF / Missing Class ........................... - 0.0% 2.4% 2.6% 2.6% 1
Option added in v2.81
Missing .................................................. - 0.0% 22.4% 1.2% 1.0% 2
NYHA Class is only collected for patients with CHF
% represents proportion of cases that had both CHF and the indicated NYHA class
Peripheral Arterial Disease ....................... - 3.1% 15.5% 13.9% 13.9%
Missing .................................................. - 3.1% 8.6% 0.9% 0.5%
CABG -- 10
Isolated CABG Procedures
Data Summary
Participant 30863
STS Period Ending 09/30/2017
2017 is a partial year: Jan 2017 - Sept 2017
Participant 30863 Like Group STS
2015 2016 2017 2017 2017
Cerebrovascular Disease ......................... - 15.6% 26.7% 21.7% 21.6%
Missing ............................................... - 0.0% 0.9% 0.9% 0.8%
Coma/Nonresponsive State ................... - 0.0% 1.7% 0.3% 0.2%
Missing ............................................... - 0.0% 0.0% 0.9% 1.0%
CVD TIA ................................................ - 6.3% 3.4% 4.3% 4.3%
Missing ............................................... - 0.0% 6.0% 1.3% 1.1%
Carotid Stenosis1
None ................................................... - 87.5% 80.2% 85.9% 86.5%
50-79%2
.............................................. - 0.0% 12.9% 10.0% 9.6%
80-100% ............................................. - 0.0% 5.2% 2.1% 2.1%
Missing/Not Documented ................... - 12.5% 1.7% 1.9% 1.8%
CVD Prior Carotid Surgery .................... - 9.4% 0.9% 3.4% 3.4%
Missing ............................................... - 0.0% 0.9% 1.0% 0.9%
Cerebrovascular Accident ..................... - 0.0% 6.9% 7.6% 7.9%
Missing ............................................... - 0.0% 4.3% 1.1% 0.9%
Renal Failure, Dialysis-Dependent ........... - 0.0% 3.4% 3.2% 3.2%
Missing ............................................... - 3.1% 0.9% 0.2% 0.2%
Last Creatinine Preop ...............................
Mean ..................................................... - 1.0 1.2 1.2 1.2
Median ................................................... - 0.8 0.9 1.0 1.0
25th
Percentile ....................................... - 0.8 0.8 0.8 0.8
75th
Percentile ....................................... - 1.0 1.2 1.2 1.2
Missing .................................................. - 0.0% 0.0% 0.3% 0.3%
Value >= 4.0 mg/dL ............................... - 0.0% 1.7% 2.4% 2.5%
Immunosuppressive Treatment ................ - 3.1% 0.0% 3.1% 3.3%
Missing ............................................... - 3.1% 2.6% 0.7% 0.5%
Previous Interventions 1
Defined as highest level of occlusion in either carotid.
Previous Cardiac Surgery3
....................... - 0.0% 6.9% 2.2% 2.4% 2
Option added in v2.81
First reoperation .................................... - 0.0% 6.9% 2.1% 2.4% 3
Previous cardiac surgery reflects any prior CABG, valve, or other cardiac surgery
Previous CABG ........................................ - 0.0% 5.2% 1.6% 1.8%
CABG -- 11
Isolated CABG Procedures
Data Summary
Participant 30863
STS Period Ending 09/30/2017
2017 is a partial year: Jan 2017 - Sept 2017
Participant 30863 Like Group STS
2015 2016 2017 2017 2017
Previous AICD .......................................... - 0.0% 0.9% 1.0% 1.0%
Previous Pacemaker ................................. - 0.0% 5.2% 1.7% 1.8%
Previous PCI ............................................. - 15.6% 31.0% 30.7% 30.9%
<= 6 hours prior to surgery .................... - 0.0% 1.7% 1.1% 0.9%
> 6 hours prior to surgery ...................... - 15.6% 29.3% 29.5% 29.9%
Missing timing ........................................ - 0.0% 0.0% 0.3% 0.2%
Previous PCI Stent ................................... - 100.0% 91.7% 85.9% 87.4%
Status
Surgery Status
Elective .................................................. - 28.1% 43.1% 37.7% 37.4%
Urgent .................................................... - 50.0% 53.4% 57.7% 58.5%
Emergent ............................................... - 21.9% 3.4% 4.4% 3.9%
Emergent Salvage ................................. - 0.0% 0.0% 0.2% 0.2%
Missing .................................................. - 0.0% 0.0% 0.0% 0.0%
MI .............................................................. - 25.0% 42.2% 54.5% 54.0%
<= 7 days prior to surgery .................. - 21.9% 23.3% 31.3% 29.8%
8-21 days prior to surgery .................. - 0.0% 3.4% 5.1% 5.4%
>21 days prior to surgery .................... - 3.1% 15.5% 17.9% 18.7%
Missing timing ..................................... - 0.0% 0.0% 0.1% 0.1%
Missing .................................................. - 0.0% 13.8% 0.9% 0.6%
Cardiogenic Shock
At the time of surgery ......................... - 15.6% 0.9% 1.5% 1.5%
Within 24 hrs of surgery1
.................... - 3.1% 0.9% 0.6% 0.5%
Missing .................................................. - 0.0% 0.0% 0.1% 0.1%
Resuscitation
<= 1 hr prior to surgery ........................ - 0.0% 0.0% 0.3% 0.3%
1-24 hrs prior to surgery1
....................... - 0.0% 0.0% 0.5% 0.4%
Missing .................................................. - 0.0% 0.0% 0.1% 0.1% 1
Option added in v2.81
CABG -- 12
Isolated CABG Procedures
Data Summary
Participant 30863
STS Period Ending 09/30/2017
2017 is a partial year: Jan 2017 - Sept 2017
Participant 30863 Like Group STS
2015 2016 2017 2017 2017
Cardiac Pres. on Admission
No Symptoms or Angina ........................ - 3.1% 3.4% 7.7% 7.5%
Stable Angina ........................................ - 25.0% 27.6% 14.4% 15.1%
Unstable Angina .................................... - 34.4% 31.9% 35.3% 35.8%
Non-ST Elevation MI (Non-STEMI) ....... - 21.9% 29.3% 28.9% 27.8%
ST Elevation MI (STEMI) ....................... - 6.3% 3.4% 5.6% 5.2%
Angina Equivalent1
................................ - 6.3% 0.9% 3.4% 3.5%
Other1
.................................................... - 3.1% 3.4% 4.6% 5.0%
Missing .................................................. - 0.0% 0.0% 0.1% 0.1%
Any Arrhythmia2
........................................ - 18.8% 18.1% 13.9% 13.9%
Recent ................................................... - 18.8% 12.9% 11.3% 11.3%
Remote .................................................. - 0.0% 3.4% 2.1% 2.2%
Missing .................................................. - 3.1% 3.4% 0.3% 0.3%
Ventricular Tachycardia/Fibrillation3
...... - 3.1% 1.7% 3.2% 3.3%
Missing ............................................... - 0.0% 0.0% 0.3% 0.2%
3rd
degree Heart Block3
......................... - 0.0% 1.7% 0.6% 0.6%
Missing ............................................... - 0.0% 0.0% 0.4% 0.3%
Atrial Fibrillation3, 4
................................. - 15.6% 8.6% 9.4% 9.4%
Missing ............................................... - 0.0% 0.0% 0.3% 0.3%
Atrial Flutter3, 4
....................................... - 0.0% 0.9% 1.1% 1.1%
Missing ............................................... - 0.0% 0.0% 0.4% 0.2%
Hemodynamics and Catheterization
Number of Diseased Coronary Vessels
One ........................................................ - 0.0% 4.3% 3.7% 3.8%
Two ........................................................ - 31.3% 16.4% 18.9% 19.0%
Three ..................................................... - 62.5% 74.1% 76.5% 76.3%
Missing .................................................. - 6.3% 5.2% 0.9% 0.8%
Left Main Disease (>=50% Stenosis) ........ - 43.8% 32.8% 32.2% 31.5%
Missing .................................................. - 50.0% 61.2% 34.5% 37.7% 1
Option added in v2.81
2
Includes VTach/VFib, 2nd
and 3rd
degree HB, Sick Sinus Syndrome, AFib, and Aflutter
3
For v2.81 data, includes recent or remote arrhythmias
4
For v2.81 data, AFib and AFlutter were separated.
CABG -- 13
Isolated CABG Procedures
Data Summary
Participant 30863
STS Period Ending 09/30/2017
2017 is a partial year: Jan 2017 - Sept 2017
Participant 30863 Like Group STS
2015 2016 2017 2017 2017
Ejection Fraction
Mean ..................................................... - 55.6 48.0 52.0 52.1
Median ................................................... - 60.0 50.0 55.0 55.0
25th
Percentile ....................................... - 55.0 35.0 45.0 45.0
75th
Percentile ....................................... - 60.0 60.0 60.0 60.0
EF missing or not measured .................. - 21.9% 7.8% 3.2% 2.8%
EF <40%1
.............................................. - 8.0% 26.2% 15.5% 15.3%
Pulmonary Hypertension2
......................... - 50.0% 39.2% 34.9% 34.0%
PA mean/systolic pressure missing
or not measured .................................... - 93.8% 56.0% 66.6% 68.3%
Aortic Stenosis .......................................... - 0.0% 5.2% 3.6% 3.5%
Missing .................................................. - - 0.0% 0.2% 0.1%
Mitral Insufficiency
Trivial ..................................................... - 6.3% 23.3% 26.2% 29.1%
Mild ........................................................ - 0.0% 27.6% 25.8% 25.7%
Moderate ............................................... - 6.3% 10.3% 6.4% 6.5%
Severe ................................................... - 0.0% 0.0% 0.5% 0.5%
Missing/Not Documented ...................... - - 0.0% 0.5% 0.6%
Preoperative Medications
Aspirin ....................................................... - 78.1% 68.1% 84.6% 84.4%
Among Eligible Cases ........................... - 78.1% 69.9% 85.3% 85.1%
Contraindicated / Not Indicated ............. - 0.0% 2.6% 0.8% 0.8%
Missing .................................................. - 0.0% 3.4% 0.8% 0.7%
Inotropics .................................................. - 6.3% 1.7% 1.4% 1.2%
Missing .................................................. - 0.0% 0.0% 0.3% 0.2%
Beta Blockers ........................................... - 46.9% 61.2% 88.6% 89.5%
Among Eligible Cases ........................... - 45.8% 64.2% 94.2% 95.3%
Contraindicated / Not Indicated ............. - 3.1% 6.0% 5.2% 5.5%
Missing .................................................. - 0.0% 0.0% 0.0% 0.1% 1
Among patients with measured EF
2
PA systolic pressure > 35mmHg
Steroids .................................................... - 6.3% 5.2% 2.0% 2.0%
Among Eligible Cases ........................... - 6.3% 5.2% 2.1% 2.0%
Contraindicated / Not Indicated ............. - 0.0% 0.0% 0.0% 0.0%
Missing .................................................. - 0.0% 0.0% 0.4% 0.4%
CABG -- 14
Isolated CABG Procedures
Data Summary
Participant 30863
STS Period Ending 09/30/2017
2017 is a partial year: Jan 2017 - Sept 2017
Participant 30863 Like Group STS
2015 2016 2017 2017 2017
Nitrates IV ................................................. - 21.9% 12.1% 9.2% 8.7%
Missing .................................................. - 0.0% 0.0% 0.4% 0.4%
ACE Inhibitors ........................................... - 40.6% 24.1% 42.7% 40.4%
Among Eligible Cases ........................... - 40.6% 25.0% 43.5% 41.1%
Contraindicated / Not Indicated ............. - 0.0% 3.4% 1.9% 1.7%
Missing .................................................. - 0.0% 0.9% 0.8% 0.8%
Anticoagulants .......................................... - 62.5% 42.2% 43.4% 43.8%
Missing .................................................. - 0.0% 0.0% 0.4% 0.4%
Coumadin1
................................................ - 0.0% 0.0% 0.3% 0.3%
Missing .................................................. - 0.0% 0.0% 0.5% 0.5%
Coumadin w/in 5 Days2
............................ - - 2.2% 0.5% 0.4%
Among Eligible Cases ........................... - - 2.2% 0.5% 0.4%
Contraindicated / Not Indicated ............. - - 0.0% 0.1% 0.1%
Missing .................................................. - - 0.0% 0.9% 0.7%
Lipid-Lowering agents ............................... - 68.8% 37.1% 78.8% 79.0%
Among Eligible Cases ........................... - 68.8% 37.1% 79.8% 80.1%
Contraindicated / Not Indicated ............. - 0.0% 0.0% 1.3% 1.3%
Missing .................................................. - 3.1% 0.9% 0.8% 0.8%
Glycoprotein IIb/IIIa Inhibitor ..................... - 6.3% 0.9% 1.6% 1.3%
Missing .................................................. - 3.1% 0.0% 0.4% 0.4%
ADP Inhibitors within 5 Days .................... - 3.1% 16.4% 9.0% 9.4%
Among Eligible Cases ........................... - 3.1% 16.4% 9.0% 9.5%
Contraindicated / Not Indicated ............. - 0.0% 0.0% 0.1% 0.2%
Missing .................................................. - 3.1% 1.7% 0.4% 0.5%
ADP Inhibitor Discontinuation3
< 1 Day ............................................... - 0.0% 5.3% 14.1% 14.3%
1 Day .................................................. - 0.0% 42.1% 15.5% 17.0%
2 Days ................................................ - 0.0% 31.6% 17.4% 17.6% 1
Variable dropped in v2.9
3 Days ................................................ - 0.0% 0.0% 19.0% 19.3% 2
Variable added in v2.9
4 Days ................................................ - 0.0% 21.1% 20.2% 19.4% 3
Excludes patients not on ADP Inhibitors within 5 Days
5 Days ................................................ - 100.0% 0.0% 12.4% 11.4%
Missing .................................................. - 0.0% 0.0% 1.3% 0.9%
CABG -- 15
Isolated CABG Procedures
Data Summary
Participant 30863
STS Period Ending 09/30/2017
2017 is a partial year: Jan 2017 - Sept 2017
Participant 30863 Like Group STS
2015 2016 2017 2017 2017
Antiplatelets within 5 Days1
...................... - 0.0% 0.0% 4.2% 3.5%
Among Eligible Cases ........................... - 0.0% 0.0% 4.2% 3.5%
Contraindicated / Not Indicated ............. - 0.0% 0.0% 0.1% 0.2%
Missing .................................................. - 0.0% 1.4% 0.5% 0.5%
Operative Information
Blood Products Used ................................ - 75.0% 26.7% 26.5% 25.8%
Number of Blood Product Units Used
1 Red Blood Cell Unit ......................... - 18.8% 6.0% 5.6% 6.0%
2 Red Blood Cell Units ....................... - 18.8% 6.0% 7.7% 7.2%
3 Red Blood Cell Units ....................... - 3.1% 5.2% 2.7% 2.4%
4+ Red Blood Cell Units ..................... - 21.9% 3.4% 2.6% 2.4%
1+ Fresh Frozen Plasma Units ........... - 40.6% 13.8% 7.6% 6.8%
1+ Cryoprecipitate Units ..................... - 6.3% 6.9% 2.5% 2.6%
1+ Platelet Units ................................. - 37.5% 12.1% 13.7% 13.2%
Missing .................................................. - 0.0% 0.0% 0.7% 0.7%
Number of Distal Anastamoses, Total
1 ............................................................ - 9.4% 33.6% 5.0% 5.3%
2 ............................................................ - 25.0% 24.1% 17.6% 17.7%
3 ............................................................ - 50.0% 23.3% 39.7% 40.0%
4 ............................................................ - 15.6% 15.5% 28.0% 27.8%
5+ .......................................................... - 0.0% 3.4% 9.4% 9.0%
Missing2
................................................. - 0.0% 0.0% 0.1% 0.1%
Vein Harvest Technique3
Endovascular/Endoscopic ..................... - 100.0% 94.9% 89.9% 91.2%
Direct Vision .......................................... - 0.0% 3.4% 8.4% 7.2%
Both ....................................................... - 0.0% 1.7% 1.5% 1.3%
Cryopreserved ....................................... - 0.0% 0.0% 0.1% 0.0%
Missing ............................................... - 0.0% 0.0% 0.2% 0.2%
Internal Mammary Artery Used4
Any ........................................................ - 93.8% 100.0% 98.8% 99.0%
Left ..................................................... - 84.4% 67.3% 93.2% 93.1%
Right ................................................... - 0.0% 2.7% 0.4% 0.4% 1
Variable dropped in v2.9
Both .................................................... - 9.4% 30.0% 4.8% 5.0% 2
Where number of arterial conduits and number of vein grafts both missing
Missing .................................................. - 0.0% 0.0% 0.1% 0.1% 3
Where at least 1 vein was harvested
4
Excludes patients with prior CABG surgery
CABG -- 16
Isolated CABG Procedures
Data Summary
Participant 30863
STS Period Ending 09/30/2017
2017 is a partial year: Jan 2017 - Sept 2017
Participant 30863 Like Group STS
2015 2016 2017 2017 2017
Radial Artery Used ................................... - 0.0% 0.0% 4.8% 5.0%
Missing .................................................. - 0.0% 0.0% 0.5% 0.5%
Radial Artery Harvest Technique ...........
Endovascular/Endoscopic .................. - - - 45.9% 43.1%
Direct Vision ....................................... - - - 49.3% 53.1%
Both .................................................... - - - 0.8% 0.5%
Missing ............................................... - - - 4.0% 3.3%
IABP Used ................................................ - 25.0% 16.4% 9.8% 9.1%
Preop .................................................. - 18.8% 15.5% 7.4% 6.7%
Intraop ................................................ - 6.3% 0.0% 2.1% 2.0%
Postop ................................................ - 0.0% 0.9% 0.4% 0.4%
Missing Timing ................................... - 0.0% 0.0% 0.0% 0.0%
Missing .................................................. - 0.0% 0.0% 0.2% 0.2%
Robotic Technology Assisted ................... - 6.3% 50.9% 0.6% 1.0%
Missing .................................................. - 0.0% 0.0% 0.3% 0.7%
Off-pump Procedure (see following
section for detail) ................................... - 34.4% 44.0% 13.2% 12.5%
Cross-Clamp Time (min)
Mean ..................................................... - 75.6 - 71.1 69.2
Median ................................................... - 77.0 - 66.0 65.0
25th
Percentile ....................................... - 51.0 - 49.0 48.0
75th
Percentile ....................................... - 94.0 - 88.0 86.0
Cardiopulmonary Bypass Time (min)
Mean ..................................................... - 110.8 53.2 97.3 94.7
Median ................................................... - 111.0 49.0 92.0 89.0
25th
Percentile ....................................... - 84.0 37.0 71.0 69.0
75th
Percentile ....................................... - 125.0 64.0 118.0 114.0
CABG -- 17
Isolated CABG Procedures
Data Summary
Participant 30863
STS Period Ending 09/30/2017
2017 is a partial year: Jan 2017 - Sept 2017
Participant 30863 Like Group STS
2015 2016 2017 2017 2017
Circulatory Arrest ...................................... - 0.0% 0.0% 0.4% 0.3%
Missing .................................................. - 0.0% 0.0% 0.1% 0.3%
Circulatory Arrest Time (min)
Mean ..................................................... - - - 10.8 11.3
Median ................................................... - - - 4.0 5.0
25th
Percentile ....................................... - - - 0.0 0.0
75th
Percentile ....................................... - - - 9.0 11.0
Skin Incision Duration (min)
Mean ..................................................... - 261.4 230.9 240.0 235.7
Median ................................................... - 237.0 219.0 231.0 227.0
25th
Percentile ....................................... - 200.0 189.0 187.0 183.0
75th
Percentile ....................................... - 269.0 263.0 282.0 278.0
OR Duration (min)
Mean ..................................................... - 348.1 327.3 320.2 315.5
Median ................................................... - 316.0 309.0 310.0 305.0
25th
Percentile ....................................... - 274.0 281.0 260.0 255.0
75th
Percentile ....................................... - 351.5 353.0 369.0 364.0
Antibiotic Selection1, 2
............................... - 100.0% 100.0% 99.4% 99.4%
Exclusions ............................................. - 0.0% 0.0% 0.7% 0.7%
Missing .................................................. - 0.0% 0.0% 0.0% 0.1%
Antibiotic Timing1, 3
................................... - 100.0% 100.0% 99.0% 98.9%
Exclusions ............................................. - 0.0% 0.0% 0.4% 0.4%
Missing .................................................. - 0.0% 0.0% 0.0% 0.1%
Antibiotics Discontinued1,4
........................ - 100.0% 99.1% 99.0% 99.1%
Exclusions ............................................. - 0.0% 0.0% 1.4% 1.1%
Missing .................................................. - 0.0% 0.0% 0.0% 0.1%
Clotting Agents5
........................................ - 3.1% 19.8% 84.5% 84.0%
Missing .................................................. - 0.0% 0.0% 0.4% 0.9%
1
All antibiotic measures are calculated among patients without exclusions
2
First or second generation cephalosporin prescribed/given prophylactically
3
Appropriate timing of prophylactic antibiotics
4
Prophylactic antibiotics discontinued within 48 hours
5
Includes one or more of the following: Aprotinin, Epsilon Amino-Caproic Acid,
Desmopressin, or Tranexamic Acid
CABG -- 18
Isolated CABG Procedures
Data Summary
Participant 30863
STS Period Ending 09/30/2017
2017 is a partial year: Jan 2017 - Sept 2017
Participant 30863 Like Group STS
2015 2016 2017 2017 2017
Postoperative Information
Blood Products Used ................................ - 65.6% 37.1% 29.8% 28.7%
Number of Blood Product Units Used
1 Red Blood Cell Unit ......................... - 15.6% 12.1% 10.0% 10.0%
2 Red Blood Cell Units ....................... - 28.1% 10.3% 9.4% 8.5%
3 Red Blood Cell Units ....................... - 12.5% 5.2% 3.0% 2.9%
4+ Red Blood Cell Units ..................... - 9.4% 7.8% 5.0% 4.8%
1+ Fresh Frozen Plasma Units ........... - 9.4% 6.0% 6.6% 6.2%
1+ Cryoprecipitate Units ..................... - 3.1% 5.2% 2.9% 3.2%
1+ Platelet Units ................................. - 3.1% 8.6% 7.2% 7.2%
Missing .................................................. - 0.0% 0.0% 0.1% 0.1%
Intraop/Postop Products Used .................. - 87.5% 44.0% 42.5% 41.3%
Total Number of Blood Product Units
1 Red Blood Cell Unit ......................... - 12.5% 7.8% 9.5% 9.8%
2 Red Blood Cell Units ....................... - 18.8% 10.3% 11.7% 10.8%
3 Red Blood Cell Units ....................... - 18.8% 8.6% 5.2% 5.0%
4+ Red Blood Cell Units ..................... - 37.5% 12.9% 10.0% 9.4%
1+ Fresh Frozen Plasma Units ........... - 40.6% 16.4% 12.6% 11.6%
1+ Cryoprecipitate Units ..................... - 6.3% 8.6% 5.1% 5.5%
1+ Platelet Units ................................. - 37.5% 15.5% 18.5% 18.0%
Missing .................................................. - 0.0% 0.0% 0.0% 0.0%
Ventilation
Total Ventilation Hours
Mean .................................................. - 28.2 9.0 17.1 16.8
Median ............................................... - 8.7 5.3 5.7 5.7
25th
Percentile .................................... - 5.8 0.5 3.8 3.9
75th
Percentile .................................... - 18.8 10.8 10.9 10.3
Initial Ventilation Hours
Mean .................................................. - 18.9 7.5 12.1 11.8
Median ............................................... - 8.1 5.1 5.6 5.6
Initial Ventilation <6 hours .................. - 25.0% 58.6% 54.3% 54.8%
Extubated in OR .................................... - 3.1% 25.0% 2.8% 2.3%
Missing .................................................. - 0.0% 0.0% 0.2% 0.2%
Reintubation .......................................... - 6.3% 5.2% 3.8% 3.5%
Missing .................................................. - 0.0% 0.0% 0.2% 0.2%
CABG -- 19
Isolated CABG Procedures
Data Summary
Participant 30863
STS Period Ending 09/30/2017
2017 is a partial year: Jan 2017 - Sept 2017
Participant 30863 Like Group STS
2015 2016 2017 2017 2017
Additional Ventilation Hours1
Mean .................................................. - 144.0 29.2 131.7 141.2
Median ............................................... - 144.0 14.5 64.0 66.2
ICU Stay
Total ICU Hours
Mean .................................................. - 134.8 142.3 77.9 72.3
Median ............................................... - 120.3 121.5 51.7 48.0
75th
Percentile .................................... - 93.4 96.3 29.1 26.0
25th
Percentile .................................... - 142.7 164.2 93.5 81.0
Initial ICU Hours
Mean .................................................. - 134.8 141.1 74.8 68.9
Median ............................................... - 120.3 121.3 51.0 47.6
Readmitted to ICU ................................. - 0.0% 0.9% 2.5% 2.8%
Additional ICU Hours2
Mean .................................................. - - 144.0 124.4 123.9
Median ............................................... - - 144.0 71.1 70.7
Mortality Summary
In-hospital Mortality ................................... - 3.1% 0.9% 1.9% 1.7%
Operative Mortality ................................... - 3.1% 1.7% 2.5% 2.3%
Mortality Risk-Adjustment3
In-hospital Mortality
Odds Ratio ............................................ - 1.08 0.80 1.20 1.00
Lower 95% Confidence Limit .............. - 0.43 0.39 1.06 -
Upper 95% Confidence Limit .............. - 2.68 1.64 1.36 -
O/E Ratio ............................................... - 1.63 0.40 1.08 1.00
Lower 95% Confidence Limit .............. - 0.09 0.02 1.02 -
Upper 95% Confidence Limit .............. - 7.79 2.12 1.15 -
Risk-adjusted Rate ................................ - 2.7% 0.7% 1.9% 1.7%
1
Among patients reintubated
2
Among patients readmitted to the ICU
3
Refer to the Report Overview for information on risk-adjustment methodology
Risk-adjustment is not performed on time periods of less than 6 months
CABG -- 20
Isolated CABG Procedures
Data Summary
Participant 30863
STS Period Ending 09/30/2017
2017 is a partial year: Jan 2017 - Sept 2017
Participant 30863 Like Group STS
2015 2016 2017 2017 2017
Operative Mortality
Odds Ratio ............................................ - 1.02 0.83 1.21 1.00
Lower 95% Confidence Limit .............. - 0.45 0.42 1.08 -
Upper 95% Confidence Limit .............. - 2.31 1.64 1.35 -
O/E Ratio ............................................... - 1.26 0.61 1.09 1.00
Lower 95% Confidence Limit .............. - 0.07 0.11 1.03 -
Upper 95% Confidence Limit .............. - 6.05 2.07 1.14 -
Risk-adjusted Rate ................................ - 2.7% 1.4% 2.5% 2.3%
Complications Summary
Any Complications .................................... - 43.8% 52.6% 38.6% 38.9%
Any Major Complications / Operative
Mortality ................................................. - 21.9% 12.9% 12.9% 12.0%
Operative Complications
Any Reoperation .................................... - 0.0% 2.6% 3.6% 3.7%
Any Reoperation (NQF Definition)1
........ - 0.0% 1.7% 2.4% 2.4%
Reoperation for Bleeding ....................... - 0.0% 1.7% 1.7% 1.7%
Reoperation for Valvular Dysfunction2
... - 0.0% 0.0% 0.0% 0.0%
Reoperation for Graft Occlusion2
........... - 0.0% 0.0% 0.3% 0.3%
Aortic Reintervention3
............................ - - 0.0% 0.0% 0.0%
Reoperation for Other Cardiac .............. - 0.0% 0.0% 0.4% 0.4%
Reoperation for Other Non-Cardiac ....... - 0.0% 0.9% 1.4% 1.5%
Infection Complications
Any Infection .......................................... - 12.5% 15.5% 2.4% 2.3%
Deep Sternal Infection/Mediastinitis ...... - 0.0% 0.0% 0.3% 0.3%
Septicemia/Sepsis ................................. - 0.0% 1.7% 0.9% 0.9%
Conduit Harvest or Cannulation Site4
.... - 12.5% 6.9% 0.5% 0.5%
1
Includes reoperations for bleeding/tamponade, valvular dysfunction, graft occlusion,
and other cardiac problems.
2
Includes surgical and PCI/Transcatheter interventions
3
Variable added in 2.9
4
Excludes patients with zero vein grafts
5
Variable dropped in 2.9
CABG -- 21
Isolated CABG Procedures
Data Summary
Participant 30863
STS Period Ending 09/30/2017
2017 is a partial year: Jan 2017 - Sept 2017
Participant 30863 Like Group STS
2015 2016 2017 2017 2017
Neurological Complications
Any Neurological ................................... - 9.4% 12.1% 3.1% 3.0%
Coma/Encephalopathy1
......................... - 9.4% 4.3% 1.8% 1.6%
Coma2
................................................... - - 0.0% 1.3% 1.3%
Encephalopathy2
................................... - - 0.0% 0.2% 0.2%
Permanent Stroke .................................. - 0.0% 0.0% 1.4% 1.4%
Transient Ischemic Attack ..................... - 0.0% 0.9% 0.2% 0.2%
Paralysis ................................................ - 0.0% 0.0% 0.2% 0.1%
Pulmonary Complications
Any Pulmonary ...................................... - 25.0% 16.4% 12.6% 12.1%
Prolonged Ventilation ............................ - 18.8% 10.3% 8.2% 7.5%
Pneumonia ............................................ - 9.4% 2.6% 2.7% 2.4%
Pulmonary Embolism ............................. - 0.0% 0.0% 0.2% 0.2%
Pleural Effusion Requiring Drainage ...... - 3.1% 4.3% 3.3% 3.6%
Renal Complications
Renal Failure3
........................................ - 0.0% 0.9% 2.4% 2.1%
Vascular Complications
Any Vascular ......................................... - 0.0% 0.9% 0.3% 0.4%
Acute Limb Ischemia ............................. - 0.0% 0.9% 0.3% 0.4%
Other Complications
Any Other .............................................. - 28.1% 28.4% 29.9% 30.5%
New Onset Atrial Fibrillation4
................. - 33.3% 26.4% 24.6% 25.0%
Recent Recurrent Atrial Fibrillation5
....... - 0.0% 0.0% 26.6% 26.9%
Cardiac Arrest ....................................... - 3.1% 3.4% 2.1% 1.9%
Anticoagulant Complication ................... - 0.0% 0.0% 0.6% 0.5%
Tamponade ........................................... - 0.0% 0.0% 0.1% 0.1%
Gastro-Intestinal Complication .............. - 0.0% 0.0% 2.1% 2.1%
Multi-System Failure .............................. - 0.0% 0.0% 0.7% 0.6%
1
Variable dropped in 2.9
2
Variable added in 2.9
3
Excludes patients with preoperative dialysis or last creatinine >=4
4
New Onset Afib is only among patients with no history of arrhythmias
5
Recent Recurrent Afib is among patients with history of recent Afib
CABG -- 22
Isolated CABG Procedures
Data Summary
Participant 30863
STS Period Ending 09/30/2017
2017 is a partial year: Jan 2017 - Sept 2017
Participant 30863 Like Group STS
2015 2016 2017 2017 2017
Complications Risk-Adjustment1
Major Complications or Op. Mortality
Odds Ratio ............................................ - 1.24 0.87 1.07 1.00
Lower 95% Confidence Limit .............. - 0.66 0.55 0.99 -
Upper 95% Confidence Limit .............. - 2.32 1.37 1.15 -
O/E Ratio ............................................... - 1.51 0.87 1.06 1.00
Lower 95% Confidence Limit .............. - 0.70 0.53 1.04 -
Upper 95% Confidence Limit .............. - 2.60 1.33 1.08 -
Risk-adjusted Rate ................................ - 18.3% 10.5% 12.7% 12.0%
Any Reoperation
Odds Ratio ............................................ - 0.82 0.86 0.90 1.00
Lower 95% Confidence Limit .............. - 0.38 0.49 0.82 -
Upper 95% Confidence Limit .............. - 1.76 1.51 0.97 -
O/E Ratio ............................................... - 0.00 0.63 0.97 1.00
Lower 95% Confidence Limit .............. - 0.00 0.16 0.94 -
Upper 95% Confidence Limit .............. - 2.54 1.77 1.02 -
Risk-adjusted Rate ................................ - 0.0% 2.3% 3.6% 3.7%
Deep Sternal Infection/Mediastinitis
Odds Ratio ............................................ - 0.97 0.84 0.84 1.00
Lower 95% Confidence Limit .............. - 0.26 0.22 0.66 -
Upper 95% Confidence Limit .............. - 3.64 3.18 1.05 -
O/E Ratio ............................................... - 0.00 0.00 0.92 1.00
Lower 95% Confidence Limit .............. - 0.00 0.00 0.82 -
Upper 95% Confidence Limit .............. - 33.75 6.92 1.11 -
Risk-adjusted Rate ................................ - 0.0% 0.0% 0.3% 0.3%
Permanent Stroke
Odds Ratio ............................................ - 0.94 0.86 0.96 1.00
Lower 95% Confidence Limit .............. - 0.43 0.48 0.86 -
Upper 95% Confidence Limit .............. - 2.05 1.56 1.07 -
O/E Ratio ............................................... - 0.00 0.00 1.00 1.00
Lower 95% Confidence Limit .............. - 0.00 0.00 0.94 -
Upper 95% Confidence Limit .............. - 7.65 2.28 1.08 -
Risk-adjusted Rate ................................ - 0.0% 0.0% 1.4% 1.4% 1
Refer to the Report Overview for information on risk-adjustment methodology
Risk-adjustment is not performed on time periods of less than 6 months
CABG -- 23
Isolated CABG Procedures
Data Summary
Participant 30863
STS Period Ending 09/30/2017
2017 is a partial year: Jan 2017 - Sept 2017
Participant 30863 Like Group STS
2015 2016 2017 2017 2017
Renal Failure
Odds Ratio ............................................ - 0.82 0.76 1.23 1.00
Lower 95% Confidence Limit .............. - 0.30 0.31 1.09 -
Upper 95% Confidence Limit .............. - 2.19 1.85 1.40 -
O/E Ratio ............................................... - 0.00 0.41 1.12 1.00
Lower 95% Confidence Limit .............. - 0.00 0.02 1.07 -
Upper 95% Confidence Limit .............. - 4.48 2.14 1.19 -
Risk-adjusted Rate ................................ - 0.0% 0.9% 2.4% 2.1%
Prolonged Ventilation
Odds Ratio ............................................ - 1.54 1.05 1.11 1.00
Lower 95% Confidence Limit .............. - 0.71 0.60 1.01 -
Upper 95% Confidence Limit .............. - 3.33 1.82 1.23 -
O/E Ratio ............................................... - 1.91 1.05 1.07 1.00
Lower 95% Confidence Limit .............. - 0.82 0.59 1.05 -
Upper 95% Confidence Limit .............. - 3.47 1.69 1.11 -
Risk-adjusted Rate ................................ - 15.1% 7.9% 8.1% 7.5%
Discharge Location1
Home ..................................................... - 48.4% 62.6% 75.8% 78.3%
Extended Care/TCU .............................. - 51.6% 33.9% 19.7% 17.7%
Other Acute Care Hospital ..................... - 0.0% 0.9% 0.8% 0.6%
Nursing Home ....................................... - 0.0% 2.6% 3.1% 2.7%
Hospice ................................................. - 0.0% 0.0% 0.1% 0.1%
Left AMA2
.............................................. - 0.0% 0.0% 0.1% 0.1%
Other ..................................................... - 0.0% 0.0% 0.3% 0.3%
Missing .................................................. - 0.0% 0.0% 0.2% 0.3%
Discharge Medications1
Aspirin ....................................................... - 83.9% 87.0% 96.8% 97.1%
Among Eligible Cases ........................... - 83.9% 90.9% 98.0% 98.3%
Contraindicated / Not Indicated ............. - 0.0% 4.3% 1.3% 1.2%
Missing .................................................. - 0.0% 0.0% 0.1% 0.1%
ACE inhibitors ........................................... - 83.9% 52.2% 38.4% 35.4% 1
Excludes in-hospital mortalities
Among Eligible Cases ........................... - 86.7% 80.0% 65.6% 61.6% 2
Option added in v2.81
Contraindicated / Not Indicated ............. - 3.2% 34.8% 41.5% 42.6%
Missing .................................................. - 0.0% 0.0% 0.2% 0.2%
CABG -- 24
Isolated CABG Procedures
Data Summary
Participant 30863
STS Period Ending 09/30/2017
2017 is a partial year: Jan 2017 - Sept 2017
Participant 30863 Like Group STS
2015 2016 2017 2017 2017
Beta Blockers ........................................... - 90.3% 92.2% 94.1% 94.5%
Among Eligible Cases ........................... - 90.3% 93.8% 98.0% 98.5%
Contraindicated / Not Indicated ............. - 0.0% 1.7% 3.9% 4.0%
Missing .................................................. - 0.0% 0.0% 0.1% 0.1%
Statin Lipid-Lowering Agents .................... - 93.5% 81.7% 94.3% 94.4%
Among Eligible Cases ........................... - 93.5% 83.9% 97.5% 97.8%
Contraindicated / Not Indicated ............. - 0.0% 2.6% 3.3% 3.4%
Missing .................................................. - 0.0% 0.0% 0.1% 0.1%
Non-Statin Lipid-Lowering Agents ............ - 0.0% 2.6% 10.3% 10.5%
Among Eligible Cases ........................... - 0.0% 2.6% 10.3% 10.6%
Contraindicated / Not Indicated ............. - 3.2% 0.0% 0.5% 0.7%
Missing .................................................. - 0.0% 0.0% 0.2% 0.2%
ADP Inhibitors ........................................... - 12.9% 13.0% 14.4% 13.9%
Among Eligible Cases ........................... - 12.9% 13.0% 14.5% 14.0%
Contraindicated / Not Indicated ............. - 0.0% 0.0% 0.5% 0.8%
Missing .................................................. - 0.0% 0.0% 0.2% 0.2%
P2Y12 Antagonists1
.................................. - 38.7% 17.1% 30.6% 31.9%
Among Eligible Cases ........................... - 38.7% 17.1% 30.8% 32.3%
Contraindicated / Not Indicated ............. - 0.0% 0.0% 0.8% 1.2%
Missing .................................................. - 0.0% 0.0% 0.1% 0.1%
Other Antiplatelets .................................... - 0.0% 1.7% 1.4% 1.1%
Among Eligible Cases ........................... - 0.0% 1.7% 1.4% 1.1%
Contraindicated / Not Indicated ............. - 0.0% 0.0% 0.2% 0.6%
Missing .................................................. - 0.0% 0.0% 0.2% 0.2%
Amiodarone .............................................. - 35.5% 32.2% 34.7% 32.9%
Among Eligible Cases ........................... - 35.5% 32.5% 34.9% 33.3%
Contraindicated / Not Indicated ............. - 0.0% 0.9% 0.7% 1.0%
Missing .................................................. - 0.0% 0.0% 0.2% 0.2%
Coumadin ................................................. - 0.0% 0.9% 6.6% 7.2% 1
Variable dropped in v2.9
Among Eligible Cases ........................... - 0.0% 0.9% 6.6% 7.3%
Contraindicated / Not Indicated ............. - 0.0% 0.0% 0.3% 0.6%
Missing .................................................. - 0.0% 0.0% 0.2% 0.2%
CABG -- 25
Isolated CABG Procedures
Data Summary
Participant 30863
STS Period Ending 09/30/2017
2017 is a partial year: Jan 2017 - Sept 2017
Participant 30863 Like Group STS
2015 2016 2017 2017 2017
Discharge Referrals/Counseling1
Cardiac Rehabilitation Referral ................. - 93.5% 93.0% 89.5% 89.6%
Missing .................................................. - 0.0% 0.0% 0.3% 0.2%
Smoking Cessation Counseling ................ - 44.4% 92.9% 89.0% 90.8%
Missing .................................................. - 0.0% 0.0% 0.7% 0.7%
1
Excludes in-hospital mortalities and Not Applicable Records
CABG -- 26
Isolated CABG Procedures
Data Summary
Participant 30863
STS Period Ending 09/30/2017
2017 is a partial year: Jan 2017 - Sept 2017
Participant 30863 Like Group STS
2015 2016 2017 2017 2017
Readmission and Reason1
Readmitted within 30 days2
................... - 16.1% 15.7% 10.6% 10.1%
Anticoagulation Complication
Valvular ........................................... - 0.0% - - -
Pharmacological .............................. - 0.0% 0.9% 0.1% 0.1%
Arryhthmia/Heart Block ...................... - 0.0% 1.7% 0.8% 0.9%
Congestive Heart Failure .................... - 0.0% 1.7% 1.2% 1.1%
MI and/or Recurrent Angina ............... - 0.0% 0.0% 0.3% 0.3%
Pericardial Effusion / Tamponade ...... - 0.0% 0.0% 0.2% 0.2%
Pneumonia3
........................................ - 6.5% 0.9% 0.5% 0.5%
Respiratory Complications, Other3
..... - 3.2% 1.7% 0.4% 0.3%
Pleural Effusion req. Intervention3
...... - 0.0% 0.0% 0.8% 0.8%
Coronary Artery Dysfunction .............. - 0.0% 0.0% 0.1% 0.1%
Valve Dysfunction ............................... - 0.0% 0.0% 0.0% 0.0%
Infection - Deep Sternum ................... - 0.0% 0.0% 0.3% 0.4%
Infection - Conduit Harvest Site .......... - 0.0% 0.9% 0.3% 0.2%
Renal failure ....................................... - 0.0% 0.0% 0.1% 0.1%
TIA / Permanent CVA ......................... - 0.0% 0.9% 0.3% 0.3%
Acute Vascular Complication ............. - 0.0% 0.0% 0.1% 0.1%
Subacute Endocarditis ....................... - 0.0% 0.0% 0.0% 0.0%
VAD Complication .............................. - - 0.0% - -
Transplant Rejection .......................... - - 0.0% 0.0% 0.0%
DVT .................................................... - 0.0% 0.0% 0.1% 0.1%
PE ...................................................... - 0.0% 0.0% 0.5% 0.4%
Angina4
............................................... - - 0.0% 0.3% 0.3%
Aortic Complication4
........................... - - 0.0% 0.0% 0.0%
Blood Pressure4
................................. - - 0.0% 0.3% 0.3%
Chest Pain, noncardiac4
..................... - - 0.0% 0.4% 0.3%
Depression/psychiatric issue4
............. - - 0.0% 0.0% 0.0%
Electrolyte imbalance4
........................ - - 0.0% 0.1% 0.1%
Failure to Thrive4
................................ - - 0.0% 0.0% 0.0%
GI Issue4
............................................. - - 0.0% 0.6% 0.6%
Mental Status Changes4
..................... - - 0.0% 0.1% 0.1%
Pericarditis/Post Cardiotomy Syndr.4
. - - 0.0% 0.0% 0.0%
Renal Insufficency4
............................. - - 0.0% 0.0% 0.0%
Sepsis4
............................................... - - 2.2% 0.3% 0.2% 1
Excludes in-hospital mortalities
Transfusion4
....................................... - - 0.0% 0.1% 0.0% 2
Timed from discharge for v2.81
Wound, other4
.................................... - - 2.2% 0.5% 0.6% 3
Option added in v2.81
Other .................................................. - 6.5% 5.2% 3.3% 3.2% 4
Option added in v2.9
Other - Planned readmission3
............ - 0.0% 0.0% 0.1% 0.1%
Missing/Unknown .................................. - 0.0% 0.0% 3.5% 3.8%
CABG -- 27
Isolated CABG Procedures
Data Summary
Participant 30863
STS Period Ending 09/30/2017
2017 is a partial year: Jan 2017 - Sept 2017
Participant 30863 Like Group STS
2015 2016 2017 2017 2017
Length of Stay Summary
Total Length of Stay (days)
Mean ..................................................... - 8.8 9.2 9.4 9.3
Median ................................................... - 7.0 8.0 8.0 8.0
25th
Percentile ....................................... - 6.0 5.5 6.0 6.0
75th
Percentile ....................................... - 9.0 11.0 11.0 11.0
Post-Procedure Length of Stay (days)
Mean ..................................................... - 7.1 6.8 6.9 6.9
Median ................................................... - 6.0 6.0 6.0 6.0
25th
Percentile ....................................... - 5.0 4.0 5.0 5.0
75th
Percentile ....................................... - 7.0 8.0 7.0 7.0
PLOS <6 days ....................................... - 31.3% 47.4% 46.2% 46.9%
PLOS >14 days ..................................... - 3.1% 5.2% 5.0% 5.0%
Length of Stay Risk-Adjustment1
Short stay: PLOS <6 days
Odds Ratio ............................................ - 0.75 1.56 1.09 1.00
Lower 95% Confidence Limit .............. - 0.37 1.06 0.96 -
Upper 95% Confidence Limit .............. - 1.51 2.29 1.24 -
O/E Ratio ............................................... - 0.79 1.26 0.99 1.00
Lower 95% Confidence Limit .............. - 0.43 1.02 0.98 -
Upper 95% Confidence Limit .............. - 1.21 1.48 0.99 -
Risk-adjusted Rate ................................ - 37.1% 58.9% 46.4% 46.9%
Long stay: PLOS >14 days
Odds Ratio ............................................ - 0.87 0.88 0.88 1.00
Lower 95% Confidence Limit .............. - 0.37 0.47 0.80 -
Upper 95% Confidence Limit .............. - 2.05 1.65 0.97 -
O/E Ratio ............................................... - 0.56 0.76 0.99 1.00
Lower 95% Confidence Limit .............. - 0.03 0.32 0.96 -
Upper 95% Confidence Limit .............. - 2.71 1.53 1.03 -
Risk-adjusted Rate ................................ - 2.8% 3.8% 4.9% 5.0%
1
Refer to the Report Overview for information on risk-adjustment methodology
Risk-adjustment is not performed on time periods of less than 6 months
CABG -- 28
Isolated CABG Procedures
Subset: On-pump procedures
Participant 30863
STS Period Ending 09/30/2017
2017 is a partial year: Jan 2017 - Sept 2017
Participant 30863 Like Group STS
2015 2016 2017 2017 2017
Number of On-Pump Procedures - 21 65 47,643 101,632
Demographics
Age (years), median .............................. - 72.0 70.0 66.0 66.0
Gender, Female ..................................... - 9.5% 23.1% 24.1% 24.1%
Race, Non-caucasian ............................ - 4.8% 3.1% 16.8% 17.2%
Multiple Races ....................................... - 0.0% 3.1% 1.1% 0.9%
Obesity (BMI 30.0+) .............................. - 38.1% 49.2% 45.1% 44.8%
Comorbidities
Diabetes Mellitus ................................... - 47.6% 44.6% 49.4% 49.4%
Insulin-Dependent .............................. - 23.8% 26.2% 17.9% 18.2%
Hypertension ......................................... - 81.0% 83.1% 89.2% 89.3%
Dyslipidemia .......................................... - 81.0% 83.1% 89.4% 90.1%
Current/Recent Cigarette Smoker ......... - 4.8% 23.1% 22.8% 22.1%
Chronic Lung Disease, Mild+ ................. - 0.0% 27.7% 19.2% 17.8%
Congestive Heart Failure ....................... - 4.8% 32.3% 17.9% 18.6%
CHF / NYHA class IV1
........................ - 0.0% 0.0% 4.3% 4.1%
Peripheral Arterial Disease .................... - 0.0% 9.2% 13.6% 13.6%
Cerebrovascular Disease ...................... - 9.5% 26.2% 21.5% 21.4%
CVA .................................................... - 0.0% 6.2% 7.4% 7.7%
Renal failure, Dialysis-Dependent ......... - 0.0% 3.1% 3.2% 3.1%
Last Creatinine Preop >= 4.0 mg/dl ....... - 0.0% 1.5% 2.3% 2.5%
Immunosuppressive Treatment ............. - 4.8% 0.0% 3.0% 3.2%
Previous Interventions
Previous Cardiac Surgery2
.................... - 0.0% 9.2% 2.1% 2.4%
Previous CAB ..................................... - 0.0% 7.7% 1.5% 1.8%
Previous PCI ......................................... - 9.5% 30.8% 30.4% 30.6%
Status
Surgery status, Emergent or Salvage .... - 28.6% 4.6% 4.7% 4.2%
MI .......................................................... - 28.6% 41.5% 54.6% 54.3%
<= 7 days Prior to Surgery ................. - 23.8% 23.1% 31.6% 30.2%
Cardiogenic Shock ................................ - 19.0% 1.5% 1.6% 1.6%
Resuscitation ......................................... - 0.0% 0.0% 0.3% 0.3% 1
NYHA Class is only collected for patients with CHF
% represents proportion of cases that had both CHF and the indicated NYHA class
2
Previous cardiac surgery reflects any prior CABG, valve, or other cardiac surgery
CABG On-pump procedures -- 29
Isolated CABG Procedures
Subset: On-pump procedures
Participant 30863
STS Period Ending 09/30/2017
2017 is a partial year: Jan 2017 - Sept 2017
Participant 30863 Like Group STS
2015 2016 2017 2017 2017
Hemodynamics and Catheterization
Triple Vessel Disease ............................ - 61.9% 78.5% 78.2% 78.1%
Left Main Disease (>=50% stenosis) ..... - 38.1% 35.4% 32.5% 31.9%
Ejection Fraction < 40%1
....................... - 12.5% 25.0% 15.6% 15.5%
Aortic Stenosis ...................................... - 0.0% 4.6% 3.5% 3.5%
Mitral Insufficiency, Mild+ ...................... - 4.8% 33.8% 32.8% 32.8%
Operative Information
IABP, Preoperative ................................ - 28.6% 20.0% 7.6% 6.9%
Cross-Clamp Time (min)
Mean .................................................. - 75.6 - 71.1 69.2
Median ............................................... - 77.0 - 66.0 65.0
Cardiopulmonary Bypass Time (min)
Mean .................................................. - 110.8 53.2 97.3 94.7
Median ............................................... - 111.0 49.0 92.0 89.0
Postoperative Information
Ventilation hours, total
Mean .................................................. - 36.9 11.1 17.7 17.3
Median ............................................... - 11.7 7.6 5.8 5.8
ICU hours, total
Mean .................................................. - 143.7 149.6 78.9 73.3
Median ............................................... - 117.2 120.2 52.0 48.2
Mortality Summary & Risk-Adjustment2
In-hospital Mortality
Observed rate ..................................... - 4.8% 0.0% 2.0% 1.8%
Risk-adjusted rate .............................. - 3.2% 0.0% 1.6% 1.5%
Operative Mortality
Observed rate ..................................... - 4.8% 0.0% 2.6% 2.3%
Risk-adjusted rate .............................. - 3.5% 0.0% 2.3% 2.1%
1
Among patients with measured EF
2
Refer to the Report Overview for information on risk-adjustment methodology
Risk-adjustment is not performed on time periods of less than 6 months
CABG On-pump procedures -- 30
Isolated CABG Procedures
Subset: On-pump procedures
Participant 30863
STS Period Ending 09/30/2017
2017 is a partial year: Jan 2017 - Sept 2017
Participant 30863 Like Group STS
2015 2016 2017 2017 2017
Complications Summary &
Risk-Adjustment1
Major Complications or Op. Mortality
Observed Rate ................................... - 23.8% 13.8% 13.3% 12.3%
Risk-adjusted Rate ............................. - 14.5% 8.9% 10.3% 9.7%
Any Reoperation
Observed Rate ................................... - 0.0% 4.6% 3.7% 3.8%
Risk-adjusted Rate ............................. - 0.0% 3.5% 3.2% 3.2%
Deep Sternal Infection/Mediastinitis
Observed Rate ................................... - 0.0% 0.0% 0.3% 0.3%
Risk-adjusted Rate ............................. - 0.0% 0.0% 0.3% 0.3%
Permanent Stroke
Observed Rate ................................... - 0.0% 0.0% 1.4% 1.4%
Risk-adjusted Rate ............................. - 0.0% 0.0% 1.1% 1.1%
Renal Failure2
Observed Rate ................................... - 0.0% 1.6% 2.5% 2.2%
Risk-adjusted Rate ............................. - 0.0% 1.1% 2.0% 1.7%
Prolonged Ventilation
Observed Rate ................................... - 19.0% 10.8% 8.6% 7.8%
Risk-adjusted Rate ............................. - 9.7% 5.7% 6.0% 5.6%
Readmission3
Readmitted within 30 days4
................... - 5.0% 18.5% 10.7% 10.1%
Length of Stay Summary
Total length of stay (days)
Mean .................................................. - 9.6 9.3 9.4 9.4
Median ............................................... - 7.0 8.0 8.0 8.0
Post-procedure Length of Stay (days)
Mean .................................................. - 8.0 7.2 7.0 7.0 1
Refer to the Report Overview for information on risk-adjustment methodology
Median ............................................... - 7.0 6.0 6.0 6.0 Risk-adjustment is not performed on time periods of less than 6 months
2
Excludes patients with preoperative dialysis or last creatinine >=4
3
Excludes in-hospital mortalities
4
Timed from discharge for v2.81
CABG On-pump procedures -- 31
CABG On-pump procedures -- 32
Isolated CABG Procedures
Subset: Off-pump procedures
Participant 30863
STS Period Ending 09/30/2017
2017 is a partial year: Jan 2017 - Sept 2017
Participant 30863 Like Group STS
2015 2016 2017 2017 2017
Number of Off-Pump Procedures - 11 51 7,232 14,582
Demographics
Age (years), median .............................. - 78.0 71.0 66.0 66.0
Gender, Female ..................................... - 9.1% 29.4% 26.8% 27.1%
Race, Non-caucasian ............................ - 9.1% 2.0% 15.7% 18.2%
Multiple Races ....................................... - 0.0% 2.0% 1.3% 1.0%
Obesity (BMI 30.0+) .............................. - 54.5% 37.3% 43.5% 43.2%
Comorbidities
Diabetes Mellitus ................................... - 45.5% 60.8% 49.1% 49.0%
Insulin-Dependent .............................. - 27.3% 45.1% 18.5% 18.6%
Hypertension ......................................... - 54.5% 94.1% 90.7% 90.2%
Dyslipidemia .......................................... - 54.5% 74.5% 91.1% 91.1%
Current/Recent Cigarette Smoker ......... - 18.2% 19.6% 21.4% 21.4%
Chronic Lung Disease, Mild+ ................. - 18.2% 35.3% 21.0% 20.0%
Congestive Heart Failure ....................... - 0.0% 41.2% 16.7% 17.4%
CHF / NYHA class IV1
........................ - 0.0% 2.0% 3.5% 3.5%
Peripheral Arterial Disease .................... - 9.1% 23.5% 15.3% 16.1%
Cerebrovascular Disease ...................... - 27.3% 27.5% 22.8% 23.0%
CVA .................................................... - 0.0% 7.8% 9.1% 9.1%
Renal failure, Dialysis-Dependent ......... - 0.0% 3.9% 3.7% 3.6%
Last Creatinine Preop >= 4.0 mg/dl ....... - 0.0% 2.0% 3.1% 3.1%
Immunosuppressive Treatment ............. - 0.0% 0.0% 3.9% 3.7%
Previous Interventions
Previous Cardiac Surgery2
.................... - 0.0% 3.9% 2.6% 2.7%
Previous CAB ..................................... - 0.0% 2.0% 1.7% 1.7%
Previous PCI ......................................... - 27.3% 31.4% 32.6% 33.0%
Status
Surgery status, Emergent or Salvage .... - 9.1% 2.0% 4.1% 3.6%
MI .......................................................... - 18.2% 43.1% 53.2% 51.9%
<= 7 days Prior to Surgery ................. - 18.2% 23.5% 29.5% 27.0%
Cardiogenic Shock ................................ - 9.1% 0.0% 1.0% 1.0%
Resuscitation ......................................... - 0.0% 0.0% 0.1% 0.1% 1
NYHA Class is only collected for patients with CHF
% represents proportion of cases that had both CHF and the indicated NYHA class
2
Previous cardiac surgery reflects any prior CABG, valve, or other cardiac surgery
CABG Off-pump procedures -- 33
Isolated CABG Procedures
Subset: Off-pump procedures
Participant 30863
STS Period Ending 09/30/2017
2017 is a partial year: Jan 2017 - Sept 2017
Participant 30863 Like Group STS
2015 2016 2017 2017 2017
Hemodynamics and Catheterization
Triple Vessel Disease ............................ - 63.6% 68.6% 65.0% 63.9%
Left Main Disease (>=50% stenosis) ..... - 54.5% 29.4% 30.3% 28.9%
Ejection Fraction < 40%1
....................... - 0.0% 27.7% 14.9% 14.3%
Aortic Stenosis ...................................... - 0.0% 5.9% 4.0% 4.1%
Mitral Insufficiency, Mild+ ...................... - 9.1% 43.1% 31.8% 31.1%
Operative Information
IABP, Preoperative ................................ - 0.0% 9.8% 6.1% 5.6%
Cross-Clamp Time (min)
Mean .................................................. -- -- -- -- --
Median ............................................... -- -- -- -- --
Cardiopulmonary Bypass Time (min)
Mean .................................................. -- -- -- -- --
Median ............................................... -- -- -- -- --
Postoperative Information
Ventilation hours, total
Mean .................................................. - 12.4 6.3 12.7 13.2
Median ............................................... - 8.1 3.7 4.7 4.9
ICU hours, total
Mean .................................................. - 117.9 133.0 71.6 65.1
Median ............................................... - 120.5 122.4 49.4 46.0
Mortality Summary & Risk-Adjustment2
In-hospital Mortality
Observed rate ..................................... - 0.0% 2.0% 1.6% 1.5%
Risk-adjusted rate .............................. - 0.0% 1.7% 1.6% 1.5%
Operative Mortality
Observed rate ..................................... - 0.0% 3.9% 2.3% 2.1%
Risk-adjusted rate .............................. - 0.0% 3.3% 2.2% 2.1%
1
Among patients with measured EF
2
Refer to the Report Overview for information on risk-adjustment methodology
Risk-adjustment is not performed on time periods of less than 6 months
CABG Off-pump procedures -- 34
Isolated CABG Procedures
Subset: Off-pump procedures
Participant 30863
STS Period Ending 09/30/2017
2017 is a partial year: Jan 2017 - Sept 2017
Participant 30863 Like Group STS
2015 2016 2017 2017 2017
Complications Summary &
Risk-Adjustment1
Major Complications or Op. Mortality
Observed Rate ................................... - 18.2% 11.8% 9.9% 9.4%
Risk-adjusted Rate ............................. - 17.7% 9.7% 10.1% 9.8%
Any Reoperation
Observed Rate ................................... - 0.0% 0.0% 2.9% 3.1%
Risk-adjusted Rate ............................. - 0.0% 0.0% 2.9% 3.2%
Deep Sternal Infection/Mediastinitis
Observed Rate ................................... - 0.0% 0.0% 0.2% 0.3%
Risk-adjusted Rate ............................. - 0.0% 0.0% 0.2% 0.3%
Permanent Stroke
Observed Rate ................................... - 0.0% 0.0% 1.0% 1.0%
Risk-adjusted Rate ............................. - 0.0% 0.0% 1.0% 1.1%
Renal Failure2
Observed Rate ................................... - 0.0% 0.0% 2.0% 1.7%
Risk-adjusted Rate ............................. - 0.0% 0.0% 2.0% 1.8%
Prolonged Ventilation
Observed Rate ................................... - 18.2% 9.8% 5.9% 5.4%
Risk-adjusted Rate ............................. - 20.1% 8.1% 6.1% 5.7%
Readmission3
Readmitted within 30 days4
................... - 36.4% 12.0% 10.5% 10.0%
Length of Stay Summary
Total length of stay (days)
Mean .................................................. - 7.4 9.1 8.8 8.6
Median ............................................... - 7.0 9.0 7.0 7.0
Post-procedure Length of Stay (days)
Mean .................................................. - 5.5 6.4 6.4 6.3 1
Refer to the Report Overview for information on risk-adjustment methodology
Median ............................................... - 5.0 6.0 5.0 5.0 Risk-adjustment is not performed on time periods of less than 6 months
2
Excludes patients with preoperative dialysis or last creatinine >=4
3
Excludes in-hospital mortalities
4
Timed from discharge for v2.81
CABG Off-pump procedures -- 35
CABG Off-pump procedures -- 36
Isolated CABG Procedures
Subset: First Operations
Participant 30863
STS Period Ending 09/30/2017
2017 is a partial year: Jan 2017 - Sept 2017
Participant 30863 Like Group STS
2015 2016 2017 2017 2017
Number of First Operations - 32 108 53,693 113,315
Demographics
Age (years), median .............................. - 72.5 70.0 66.0 66.0
Gender, Female ..................................... - 9.4% 26.9% 24.5% 24.5%
Race, Non-caucasian ............................ - 6.3% 2.8% 16.8% 17.4%
Multiple Races ....................................... - 0.0% 2.8% 1.2% 1.0%
Obesity (BMI 30.0+) .............................. - 43.8% 44.4% 44.9% 44.6%
Comorbidities
Diabetes Mellitus ................................... - 46.9% 50.9% 49.3% 49.3%
Insulin-Dependent .............................. - 25.0% 33.3% 18.0% 18.2%
Hypertension ......................................... - 71.9% 88.9% 89.3% 89.2%
Dyslipidemia .......................................... - 71.9% 79.6% 89.5% 90.0%
Current/Recent Cigarette Smoker ......... - 9.4% 23.1% 22.7% 22.1%
Chronic Lung Disease, Mild+ ................. - 6.3% 29.6% 19.3% 17.9%
Congestive Heart Failure ....................... - 3.1% 37.0% 17.7% 18.4%
CHF / NYHA class IV1
........................ - 0.0% 0.9% 4.2% 4.1%
Peripheral Arterial Disease .................... - 3.1% 15.7% 13.6% 13.7%
Cerebrovascular Disease ...................... - 15.6% 25.0% 21.5% 21.4%
CVA .................................................... - 0.0% 5.6% 7.6% 7.8%
Renal failure, Dialysis-Dependent ......... - 0.0% 3.7% 3.2% 3.2%
Last Creatinine Preop >= 4.0 mg/dl ....... - 0.0% 1.9% 2.4% 2.5%
Immunosuppressive Treatment ............. - 3.1% 0.0% 3.1% 3.3%
Previous Interventions
Previous Cardiac Surgery2
.................... - 0.0% 0.0% 0.0% 0.0%
Previous CAB ..................................... - 0.0% 0.0% 0.0% 0.0%
Previous PCI ......................................... - 15.6% 26.9% 30.1% 30.1%
Status
Surgery status, Emergent or Salvage .... - 21.9% 2.8% 4.6% 4.1%
MI .......................................................... - 25.0% 40.7% 54.3% 53.8%
<= 7 days Prior to Surgery ................. - 21.9% 22.2% 31.6% 30.1%
Cardiogenic Shock ................................ - 15.6% 0.9% 1.5% 1.5%
Resuscitation ......................................... - 0.0% 0.0% 0.3% 0.3% 1
NYHA Class is only collected for patients with CHF
% represents proportion of cases that had both CHF and the indicated NYHA class
2
Previous cardiac surgery reflects any prior CABG, valve, or other cardiac surgery
CABG First Operations -- 37
Isolated CABG Procedures
Subset: First Operations
Participant 30863
STS Period Ending 09/30/2017
2017 is a partial year: Jan 2017 - Sept 2017
Participant 30863 Like Group STS
2015 2016 2017 2017 2017
Hemodynamics and Catheterization
Triple Vessel Disease ............................ - 62.5% 74.1% 76.4% 76.2%
Left Main Disease (>=50% stenosis) ..... - 43.8% 31.5% 31.9% 31.3%
Ejection Fraction < 40%1
....................... - 8.0% 26.3% 15.4% 15.3%
Aortic Stenosis ...................................... - 0.0% 5.6% 3.5% 3.5%
Mitral Insufficiency, Mild+ ...................... - 6.3% 38.0% 32.6% 32.4%
Operative Information
IABP, Preoperative ................................ - 18.8% 14.8% 7.4% 6.7%
Cross-Clamp Time (min)
Mean .................................................. - 75.6 - 71.0 69.1
Median ............................................... - 77.0 - 66.0 65.0
Cardiopulmonary Bypass Time (min)
Mean .................................................. - 110.8 51.5 96.9 94.3
Median ............................................... - 111.0 48.0 91.0 89.0
Postoperative Information
Ventilation hours, total
Mean .................................................. - 28.2 9.1 16.8 16.5
Median ............................................... - 8.7 5.3 5.7 5.6
ICU hours, total
Mean .................................................. - 134.8 142.6 77.6 71.9
Median ............................................... - 120.3 121.2 51.6 48.0
Mortality Summary & Risk-Adjustment2
In-hospital Mortality
Observed rate ..................................... - 3.1% 0.9% 1.8% 1.7%
Risk-adjusted rate .............................. - 2.6% 0.7% 1.8% 1.6%
Operative Mortality
Observed rate ..................................... - 3.1% 1.9% 2.5% 2.2%
Risk-adjusted rate .............................. - 2.6% 1.5% 2.4% 2.2%
1
Among patients with measured EF
2
Refer to the Report Overview for information on risk-adjustment methodology
Risk-adjustment is not performed on time periods of less than 6 months
CABG First Operations -- 38
Isolated CABG Procedures
Subset: First Operations
Participant 30863
STS Period Ending 09/30/2017
2017 is a partial year: Jan 2017 - Sept 2017
Participant 30863 Like Group STS
2015 2016 2017 2017 2017
Complications Summary &
Risk-Adjustment1
Major Complications or Op. Mortality
Observed Rate ................................... - 21.9% 13.9% 12.7% 11.8%
Risk-adjusted Rate ............................. - 18.0% 11.3% 12.4% 11.7%
Any Reoperation
Observed Rate ................................... - 0.0% 2.8% 3.5% 3.6%
Risk-adjusted Rate ............................. - 0.0% 2.5% 3.5% 3.6%
Deep Sternal Infection/Mediastinitis
Observed Rate ................................... - 0.0% 0.0% 0.3% 0.3%
Risk-adjusted Rate ............................. - 0.0% 0.0% 0.3% 0.3%
Permanent Stroke
Observed Rate ................................... - 0.0% 0.0% 1.4% 1.4%
Risk-adjusted Rate ............................. - 0.0% 0.0% 1.4% 1.3%
Renal Failure2
Observed Rate ................................... - 0.0% 1.0% 2.4% 2.1%
Risk-adjusted Rate ............................. - 0.0% 1.0% 2.3% 2.1%
Prolonged Ventilation
Observed Rate ................................... - 18.8% 11.1% 8.1% 7.3%
Risk-adjusted Rate ............................. - 14.9% 8.6% 7.9% 7.3%
Readmission3
Readmitted within 30 days4
................... - 16.1% 15.0% 10.6% 10.0%
Length of Stay Summary
Total length of stay (days)
Mean .................................................. - 8.8 9.2 9.3 9.3
Median ............................................... - 7.0 8.0 8.0 8.0
Post-procedure Length of Stay (days)
Mean .................................................. - 7.1 6.9 6.9 6.9 1
Refer to the Report Overview for information on risk-adjustment methodology
Median ............................................... - 6.0 6.0 6.0 6.0 Risk-adjustment is not performed on time periods of less than 6 months
2
Excludes patients with preoperative dialysis or last creatinine >=4
3
Excludes in-hospital mortalities
4
Timed from discharge for v2.81
CABG First Operations -- 39
CABG First Operations -- 40
Isolated CABG Procedures
Subset: Reoperations
Participant 30863
STS Period Ending 09/30/2017
2017 is a partial year: Jan 2017 - Sept 2017
Participant 30863 Like Group STS
2015 2016 2017 2017 2017
Number of Reoperations - - 8 1,186 2,844
Demographics
Age (years), median .............................. - - 74.0 69.0 69.0
Gender, Female ..................................... - - 12.5% 23.6% 22.0%
Race, Non-caucasian ............................ - - 0.0% 12.2% 13.7%
Multiple Races ....................................... - - 0.0% 0.9% 0.7%
Obesity (BMI 30.0+) .............................. - - 37.5% 43.8% 44.4%
Comorbidities
Diabetes Mellitus ................................... - - 62.5% 51.4% 49.8%
Insulin-Dependent .............................. - - 50.0% 18.0% 19.8%
Hypertension ......................................... - - 75.0% 94.8% 95.1%
Dyslipidemia .......................................... - - 75.0% 95.3% 96.3%
Current/Recent Cigarette Smoker ......... - - 0.0% 16.4% 16.6%
Chronic Lung Disease, Mild+ ................. - - 50.0% 24.7% 22.8%
Congestive Heart Failure ....................... - - 25.0% 18.0% 19.2%
CHF / NYHA class IV1
........................ - - 0.0% 3.3% 3.8%
Peripheral Arterial Disease .................... - - 12.5% 24.5% 24.2%
Cerebrovascular Disease ...................... - - 50.0% 28.7% 29.3%
CVA .................................................... - - 25.0% 8.4% 9.7%
Renal failure, Dialysis-Dependent ......... - - 0.0% 2.9% 2.9%
Last Creatinine Preop >= 4.0 mg/dl ....... - - 0.0% 2.0% 2.4%
Immunosuppressive Treatment ............. - - 0.0% 3.9% 3.7%
Previous Interventions
Previous Cardiac Surgery2
.................... - - 100.0% 100.0% 100.0%
Previous CAB ..................................... - - 75.0% 72.3% 73.9%
Previous PCI ......................................... - - 87.5% 59.0% 59.6%
Status
Surgery status, Emergent or Salvage .... - - 12.5% 3.8% 3.0%
MI .......................................................... - - 62.5% 60.8% 61.0%
<= 7 days Prior to Surgery ................. - - 37.5% 19.6% 19.3%
Cardiogenic Shock ................................ - - 0.0% 2.1% 1.8%
Resuscitation ......................................... - - 0.0% 0.6% 0.4% 1
NYHA Class is only collected for patients with CHF
% represents proportion of cases that had both CHF and the indicated NYHA class
2
Previous cardiac surgery reflects any prior CABG, valve, or other cardiac surgery
CABG Reoperations -- 41
Isolated CABG Procedures
Subset: Reoperations
Participant 30863
STS Period Ending 09/30/2017
2017 is a partial year: Jan 2017 - Sept 2017
Participant 30863 Like Group STS
2015 2016 2017 2017 2017
Hemodynamics and Catheterization
Triple Vessel Disease ............................ - - 75.0% 78.4% 79.5%
Left Main Disease (>=50% stenosis) ..... - - 50.0% 42.5% 40.1%
Ejection Fraction < 40%1
....................... - - 25.0% 17.4% 16.4%
Aortic Stenosis ...................................... - - 0.0% 5.6% 5.5%
Mitral Insufficiency, Mild+ ...................... - - 37.5% 38.6% 39.3%
Operative Information
IABP, Preoperative ................................ - - 25.0% 6.0% 5.7%
Cross-Clamp Time (min)
Mean .................................................. - - - 75.5 73.2
Median ............................................... - - - 68.0 68.0
Cardiopulmonary Bypass Time (min)
Mean .................................................. - - 70.5 115.7 112.4
Median ............................................... - - 68.0 108.0 104.0
Postoperative Information
Ventilation hours, total
Mean .................................................. - - 7.7 28.4 28.6
Median ............................................... - - 6.9 6.9 6.6
ICU hours, total
Mean .................................................. - - 138.1 92.0 87.0
Median ............................................... - - 140.8 63.0 52.0
Mortality Summary & Risk-Adjustment2
In-hospital Mortality
Observed rate ..................................... - - 0.0% 5.5% 4.7%
Risk-adjusted rate .............................. - - 0.0% 6.9% 6.1%
Operative Mortality
Observed rate ..................................... - - 0.0% 6.7% 5.8%
Risk-adjusted rate .............................. - - 0.0% 7.7% 6.8%
1
Among patients with measured EF
2
Refer to the Report Overview for information on risk-adjustment methodology
Risk-adjustment is not performed on time periods of less than 6 months
CABG Reoperations -- 42
Isolated CABG Procedures
Subset: Reoperations
Participant 30863
STS Period Ending 09/30/2017
2017 is a partial year: Jan 2017 - Sept 2017
Participant 30863 Like Group STS
2015 2016 2017 2017 2017
Complications Summary &
Risk-Adjustment1
Major Complications or Op. Mortality
Observed Rate ................................... - - 0.0% 19.9% 19.8%
Risk-adjusted Rate ............................. - - 0.0% 23.1% 22.9%
Any Reoperation
Observed Rate ................................... - - 0.0% 6.2% 6.9%
Risk-adjusted Rate ............................. - - 0.0% 8.0% 8.9%
Deep Sternal Infection/Mediastinitis
Observed Rate ................................... - - 0.0% 0.5% 0.4%
Risk-adjusted Rate ............................. - - 0.0% 0.5% 0.4%
Permanent Stroke
Observed Rate ................................... - - 0.0% 1.9% 2.1%
Risk-adjusted Rate ............................. - - 0.0% 2.6% 2.8%
Renal Failure2
Observed Rate ................................... - - 0.0% 4.9% 4.0%
Risk-adjusted Rate ............................. - - 0.0% 5.7% 4.5%
Prolonged Ventilation
Observed Rate ................................... - - 0.0% 12.7% 13.4%
Risk-adjusted Rate ............................. - - 0.0% 15.4% 16.2%
Readmission3
Readmitted within 30 days4
................... - - 25.0% 13.4% 12.0%
Length of Stay Summary
Total length of stay (days)
Mean .................................................. - - 9.5 10.5 10.5
Median ............................................... - - 9.5 9.0 9.0
Post-procedure Length of Stay (days)
Mean .................................................. - - 6.0 7.7 7.7 1
Refer to the Report Overview for information on risk-adjustment methodology
Median ............................................... - - 5.5 6.0 6.0 Risk-adjustment is not performed on time periods of less than 6 months
2
Excludes patients with preoperative dialysis or last creatinine >=4
3
Excludes in-hospital mortalities
4
Timed from discharge for v2.81
CABG Reoperations -- 43
CABG Reoperations -- 44
Isolated Aortic Valve Replacement Procedures
Data Summary
Participant 30863
STS Period Ending 09/30/2017
2017 is a partial year: Jan 2017 - Sept 2017
Participant 30863 Like Group STS
2015 2016 2017 2017 2017
Number of Cases - 1 17 3,665 18,759
Demographics
Age (years)
Mean ..................................................... - 75.0 70.2 65.9 65.5
Median ................................................... - 75.0 75.0 68.0 67.0
25th
Percentile ....................................... - 75.0 64.0 60.0 59.0
75th
Percentile ....................................... - 75.0 79.0 74.0 74.0
Age >= 65 years old .............................. - 100.0% 70.6% 60.0% 59.7%
Gender, Female ........................................ - 0.0% 29.4% 39.8% 36.9%
Missing .................................................. - 0.0% 0.0% 0.1% 0.0%
Race1
Caucasian ............................................. - 100.0% 100.0% 85.9% 86.9%
Black ...................................................... - 0.0% 0.0% 6.1% 5.6%
Asian ..................................................... - 0.0% 0.0% 1.4% 1.5%
Native American .................................... - 0.0% 0.0% 0.6% 0.5%
Native Hawaiian/Pacific Islander ........... - 0.0% 0.0% 0.4% 0.2%
Other ..................................................... - 0.0% 0.0% 3.7% 3.0%
Multiple Races ....................................... - 0.0% 0.0% 1.1% 0.6%
Missing / Not Documented .................... - 0.0% 0.0% 2.9% 3.0%
Pt. Declined to Disclose2
....................... - 0.0% 0.0% 0.4% 0.6%
Hispanic or Latino Ethnicity ...................... - 0.0% 41.2% 11.1% 7.2%
Missing/ Not Documented ..................... - 0.0% 5.9% 4.0% 3.9%
Body Mass Index3
Underweight (BMI < 18.5) ...................... - 0.0% 0.0% 0.9% 0.9%
Normal (BMI 18.5 - 24.9) ....................... - 0.0% 23.5% 18.9% 19.0%
Overweight (BMI 25.0 - 29.9) ................ - 100.0% 35.3% 31.4% 32.9%
Obese I (BMI 30.0 - 34.9) ...................... - 0.0% 23.5% 26.2% 25.8%
Obese II (BMI 35.0 - 39.9) ..................... - 0.0% 11.8% 13.2% 12.9%
Morbid Obesity (BMI 40.0+) ................... - 0.0% 5.9% 9.2% 8.3%
Missing Height ....................................... - 0.0% 0.0% 0.1% 0.2% 1
Data presented in the report represent the individual response rates for each race category
Missing Weight ...................................... - 0.0% 0.0% 0.0% 0.2% shown; summing the individual non-caucasian categories will not result in the same rates as
shown in the graph since non-caucasian, as defined for the graph, does not include races or
ethnicities reported in combination with caucasian
2
Option added in v2.81
3
BMI = Weight(kg) / Height(m)2
AV Replace -- 45
Isolated Aortic Valve Replacement Procedures
Data Summary
Participant 30863
STS Period Ending 09/30/2017
2017 is a partial year: Jan 2017 - Sept 2017
Participant 30863 Like Group STS
2015 2016 2017 2017 2017
Comorbidities
Diabetes Mellitus ...................................... - 0.0% 23.5% 34.2% 30.4%
Diet Control ........................................ - 0.0% 0.0% 2.2% 2.7%
Oral Control ........................................ - 0.0% 17.6% 18.3% 16.2%
Insulin Control .................................... - 0.0% 5.9% 9.7% 7.9%
Other SQ Medication Control1
............ - 0.0% 0.0% 0.3% 0.3%
Other Control ...................................... - 0.0% 0.0% 0.2% 0.1%
Missing Control ................................... - - 0.0% 1.0% 0.8%
Missing .................................................. - 0.0% 0.0% 0.3% 0.4%
Hypertension ............................................ - 0.0% 70.6% 81.0% 78.8%
Missing .................................................. - 0.0% 5.9% 0.3% 0.3%
Current/Recent Cigarette Smoker ............ - 0.0% 23.5% 16.1% 13.3%
Smoker, Current Status Unknown1
........ - 0.0% 5.9% 0.4% 0.4%
Missing .................................................. - 0.0% 0.0% 0.8% 0.7%
Chronic Lung Disease
Mild ........................................................ - 0.0% 17.6% 10.2% 9.4%
Moderate ............................................... - 0.0% 17.6% 4.6% 3.9%
Severe ................................................... - 0.0% 0.0% 4.6% 3.4%
Unknown Severity1
................................ - 0.0% 29.4% 6.2% 5.6%
Missing .................................................. - 0.0% 23.5% 3.1% 1.8%
Congestive Heart Failure .......................... - 0.0% 64.7% 28.2% 33.8%
CHF / NYHA Class I2
.......................... - 0.0% 23.5% 1.9% 3.1%
CHF / NYHA Class II .......................... - 0.0% 5.9% 9.4% 13.6%
CHF / NYHA Class III ......................... - 0.0% 17.6% 14.1% 17.0%
CHF / NYHA Class IV ......................... - 0.0% 11.8% 5.8% 5.0%
CHF / Missing Class ........................... - - 0.0% 2.2% 2.0%
Missing .................................................. - 0.0% 17.6% 1.5% 1.2%
Peripheral Arterial Disease ....................... - 0.0% 11.8% 7.9% 7.6%
Missing .................................................. - 0.0% 0.0% 1.2% 0.5%
Cerebrovascular Disease ......................... - 0.0% 23.5% 15.0% 15.2% 1
Option added in v2.81
Missing .................................................. - 0.0% 0.0% 1.2% 0.9% 2
NYHA Class is only collected for patients with CHF
% represents proportion of cases that had both CHF and the indicated NYHA class
Coma/Nonresponsive State ................... - 0.0% 0.0% 0.3% 0.3%
Missing ............................................... - 0.0% 0.0% 0.9% 1.4%
AV Replace -- 46
Isolated Aortic Valve Replacement Procedures
Data Summary
Participant 30863
STS Period Ending 09/30/2017
2017 is a partial year: Jan 2017 - Sept 2017
Participant 30863 Like Group STS
2015 2016 2017 2017 2017
CVD TIA ................................................ - 0.0% 0.0% 3.9% 4.0%
Missing ............................................... - 0.0% 11.8% 1.6% 1.1%
Carotid Stenosis1
None ................................................... - 100.0% 82.4% 92.6% 93.0%
50-79%2
.............................................. - 0.0% 11.8% 4.5% 4.6%
80-100% ............................................. - 0.0% 0.0% 0.7% 0.6%
Missing/Not Documented ................... - 0.0% 5.9% 2.3% 1.7%
CVD Prior Carotid Surgery .................... - 0.0% 11.8% 1.5% 1.5%
Missing ............................................... - 0.0% 0.0% 1.3% 0.9%
Cerebrovascular Accident ..................... - 0.0% 5.9% 6.7% 6.9%
Missing ............................................... - 0.0% 5.9% 1.3% 0.9%
Renal Failure, Dialysis-Dependent ........... - 0.0% 0.0% 3.1% 2.1%
Missing .................................................. - 0.0% 5.9% 0.4% 0.4%
Last Creatinine Preop
Mean ..................................................... - 1.0 1.0 1.1 1.1
Median ................................................... - 1.0 1.0 1.0 0.9
25th
Percentile ....................................... - 1.0 0.9 0.8 0.8
75th
Percentile ....................................... - 1.0 1.2 1.2 1.1
Missing .................................................. - 0.0% 0.0% 0.3% 0.4%
Value >= 4.0 mg/dL ............................... - 0.0% 0.0% 1.9% 1.5%
Immunosuppressive Treatment ................ - 0.0% 5.9% 3.6% 4.1%
Missing .................................................. - 0.0% 0.0% 1.2% 0.8%
Infectious Endocarditis .............................. - 0.0% 0.0% 6.8% 7.3%
Missing .................................................. - 0.0% 0.0% 0.1% 0.3%
Previous Interventions
Previous Cardiac Surgery3
....................... - 0.0% 17.6% 7.3% 10.7%
First reoperation .................................... - 0.0% 17.6% 6.9% 9.8%
1
Defined as highest level of occlusion in either carotid.
Previous CABG ........................................ - 0.0% 11.8% 2.2% 2.8% 2
Option added in v2.81
3
Previous cardiac surgery reflects any prior CABG, valve, or other cardiac surgery
Previous Valve .......................................... - 0.0% 5.9% 5.2% 7.8%
Previous AICD .......................................... - 0.0% 5.9% 1.1% 1.0%
AV Replace -- 47
Isolated Aortic Valve Replacement Procedures
Data Summary
Participant 30863
STS Period Ending 09/30/2017
2017 is a partial year: Jan 2017 - Sept 2017
Participant 30863 Like Group STS
2015 2016 2017 2017 2017
Previous Pacemaker ................................. - 0.0% 0.0% 2.6% 2.8%
Status
Surgery Status
Elective .................................................. - 0.0% 58.8% 77.9% 80.7%
Urgent .................................................... - 100.0% 41.2% 21.4% 18.4%
Emergent ............................................... - 0.0% 0.0% 0.6% 0.7%
Emergent Salvage ................................. - 0.0% 0.0% 0.1% 0.1%
Missing .................................................. - 0.0% 0.0% 0.0% 0.1%
MI .............................................................. - 0.0% 0.0% 10.3% 9.6%
Missing .................................................. - 0.0% 23.5% 0.8% 0.6%
Cardiogenic Shock
At the time of surgery ............................ - 0.0% 5.9% 0.5% 0.7%
Within 24 hrs of surgery1
....................... - 0.0% 0.0% 0.2% 0.2%
Missing .................................................. - 0.0% 0.0% 0.2% 0.3%
Hemodynamics and Catheterization
Ejection Fraction
Mean ..................................................... - 60.0 54.8 57.2 57.7
Median ................................................... - 60.0 55.0 60.0 60.0
25th
Percentile ....................................... - 60.0 50.0 55.0 55.0
75th
Percentile ....................................... - 60.0 65.0 63.0 65.0
EF missing or not measured .................. - 0.0% 11.8% 4.3% 2.8%
EF <40%2
.............................................. - 0.0% 13.3% 7.6% 7.1%
Pulmonary Hypertension3
......................... - - 70.0% 48.7% 45.5%
PA mean/systolic pressure missing
or not measured .................................... - 100.0% 41.2% 47.9% 46.5%
Aortic Stenosis .......................................... - 100.0% 94.1% 84.2% 82.7%
Missing .................................................. - 0.0% 0.0% 0.1% 0.1%
Aortic Insufficiency 1
Option added in v2.81
Trivial ..................................................... - 0.0% 0.0% 11.2% 14.4% 2
Among patients with measured EF
Mild ........................................................ - 0.0% 5.9% 22.8% 24.1% 3
PA systolic pressure > 35mmHg
Moderate ............................................... - 0.0% 0.0% 14.1% 15.2%
Severe ................................................... - 100.0% 94.1% 24.6% 21.9%
Missing/Not Documented ...................... - 0.0% 0.0% 6.7% 4.9%
AV Replace -- 48
Isolated Aortic Valve Replacement Procedures
Data Summary
Participant 30863
STS Period Ending 09/30/2017
2017 is a partial year: Jan 2017 - Sept 2017
Participant 30863 Like Group STS
2015 2016 2017 2017 2017
Preoperative Medications
Aspirin ....................................................... - 0.0% 47.1% 54.4% 49.2%
Among Eligible Cases ........................... - 0.0% 47.1% 54.9% 49.7%
Contraindicated / Not Indicated ............. - 0.0% 0.0% 1.0% 1.1%
Missing .................................................. - 0.0% 5.9% 1.1% 0.8%
Inotropics .................................................. - 0.0% 5.9% 1.0% 1.1%
Missing .................................................. - 0.0% 0.0% 0.3% 0.2%
Beta Blockers ........................................... - 0.0% 23.5% 64.2% 60.2%
Among Eligible Cases ........................... - 0.0% 25.0% 68.1% 64.3%
Contraindicated / Not Indicated ............. - 0.0% 5.9% 5.6% 6.2%
Missing .................................................. - 0.0% 0.0% 0.0% 0.2%
Steroids .................................................... - 0.0% 5.9% 2.4% 2.1%
Among Eligible Cases ........................... - 0.0% 5.9% 2.4% 2.1%
Contraindicated / Not Indicated ............. - 0.0% 0.0% 0.0% 0.0%
Missing .................................................. - 0.0% 0.0% 0.5% 0.4%
Nitrates IV ................................................. - 0.0% 5.9% 0.6% 0.4%
Missing .................................................. - 0.0% 0.0% 0.5% 0.4%
ACE Inhibitors ........................................... - 0.0% 5.9% 36.5% 33.5%
Among Eligible Cases ........................... - 0.0% 6.3% 37.2% 34.0%
Contraindicated / Not Indicated ............. - 0.0% 5.9% 1.8% 1.3%
Missing .................................................. - 0.0% 0.0% 1.3% 0.9%
Anticoagulants .......................................... - 0.0% 29.4% 13.0% 11.4%
Missing .................................................. - 0.0% 0.0% 0.5% 0.4%
Coumadin1
................................................ - 0.0% 0.0% 0.7% 0.4%
Missing .................................................. - 0.0% 0.0% 0.7% 0.5%
Coumadin w/in 5 Days 2
........................... - - 0.0% 0.9% 0.8%
Among Eligible Cases ........................... - - 0.0% 0.9% 0.8%
Contraindicated / Not Indicated ............. - - 0.0% 0.2% 0.2% 1
Variable dropped in v2.9
Missing .................................................. - - 0.0% 0.6% 0.5% 2
Variable added in v2.9
AV Replace -- 49
Isolated Aortic Valve Replacement Procedures
Data Summary
Participant 30863
STS Period Ending 09/30/2017
2017 is a partial year: Jan 2017 - Sept 2017
Participant 30863 Like Group STS
2015 2016 2017 2017 2017
Lipid-Lowering agents ............................... - 0.0% 23.5% 55.4% 53.6%
Among Eligible Cases ........................... - 0.0% 23.5% 56.0% 54.1%
Contraindicated / Not Indicated ............. - 0.0% 0.0% 1.1% 0.9%
Missing .................................................. - 0.0% 0.0% 1.1% 0.8%
Glycoprotein IIb/IIIa Inhibitor ..................... - 0.0% 0.0% 0.1% 0.1%
Missing .................................................. - 0.0% 0.0% 0.4% 0.3%
ADP Inhibitors within 5 Days .................... - 0.0% 0.0% 1.4% 1.5%
Among Eligible Cases ........................... - 0.0% 0.0% 1.4% 1.5%
Contraindicated / Not Indicated ............. - 0.0% 0.0% 0.1% 0.2%
Missing .................................................. - 0.0% 0.0% 0.4% 0.4%
ADP Inhibitor Discontinuation1
< 1 Day ............................................... - - - 11.8% 21.2%
1 Day .................................................. - - - 19.6% 19.4%
2 Days ................................................ - - - 17.6% 10.1%
3 Days ................................................ - - - 15.7% 10.4%
4 Days ................................................ - - - 11.8% 18.8%
5 Days ................................................ - - - 19.6% 19.4%
Missing .................................................. - - - 3.9% 0.7%
Antiplatelets within 5 Days2
...................... - 0.0% 0.0% 1.8% 1.4%
Among Eligible Cases ........................... - 0.0% 0.0% 1.8% 1.4%
Contraindicated / Not Indicated ............. - 0.0% 0.0% 0.1% 0.2%
Missing .................................................. - 0.0% 0.0% 0.6% 0.5%
Operative Information
Blood Products Used ................................ - 100.0% 70.6% 31.1% 26.3%
Number of Blood Product Units Used
1 Red Blood Cell Unit ......................... - 0.0% 5.9% 6.3% 5.9%
2 Red Blood Cell Units ....................... - 0.0% 11.8% 8.7% 6.4%
3 Red Blood Cell Units ....................... - 0.0% 11.8% 3.0% 2.0%
4+ Red Blood Cell Units ..................... - 100.0% 17.6% 2.9% 2.4%
1+ Fresh Frozen Plasma Units ........... - 0.0% 58.8% 11.7% 9.6%
1+ Cryoprecipitate Units ..................... - 100.0% 47.1% 4.8% 4.9% 1
Excludes patients not on ADP Inhibitors within 5 Days
1+ Platelet Units ................................. - 100.0% 52.9% 17.4% 15.3% 2
Variable dropped in v2.9
Missing .................................................. - 0.0% 0.0% 0.5% 0.6%
AV Replace -- 50
Isolated Aortic Valve Replacement Procedures
Data Summary
Participant 30863
STS Period Ending 09/30/2017
2017 is a partial year: Jan 2017 - Sept 2017
Participant 30863 Like Group STS
2015 2016 2017 2017 2017
IABP ......................................................... - 0.0% 29.4% 1.9% 1.7%
Preop .................................................. - 0.0% 23.5% 0.3% 0.2%
Intraop ................................................ - 0.0% 5.9% 1.3% 1.2%
Postop ................................................ - 0.0% 0.0% 0.3% 0.2%
Missing timing ..................................... - - 0.0% 0.0% 0.3%
Missing .................................................. - 0.0% 0.0% 0.1% 0.1%
Robotic Technology Assisted ................... - 0.0% 5.9% 0.1% 0.0%
Missing .................................................. - 0.0% 0.0% 0.1% 0.9%
Cross-Clamp Time (min)
Mean ..................................................... - 89.0 75.0 80.8 74.8
Median ................................................... - 89.0 69.0 75.0 70.0
25th
Percentile ....................................... - 89.0 65.0 61.0 55.0
75th
Percentile ....................................... - 89.0 80.0 95.0 88.0
Cardiopulmonary Bypass Time (min)
Mean ..................................................... - 114.0 117.4 108.8 100.8
Median ................................................... - 114.0 98.0 101.0 93.0
25th
Percentile ....................................... - 114.0 89.0 81.0 74.0
75th
Percentile ....................................... - 114.0 124.0 126.0 118.0
Circulatory Arrest ...................................... - 0.0% 0.0% 0.8% 0.4%
Missing .................................................. - 0.0% 0.0% 0.2% 0.3%
Circulatory Arrest Time (min)
Mean ..................................................... - - - 17.8 18.0
Median ................................................... - - - 7.0 9.0
25th
Percentile ....................................... - - - 3.0 1.0
75th
Percentile ....................................... - - - 30.0 20.0
Skin Incision Duration (min)
Mean ..................................................... - 234.0 259.4 216.5 204.2
Median ................................................... - 234.0 221.0 204.0 191.0
25th
Percentile ....................................... - 234.0 200.0 170.0 157.0
75th
Percentile ....................................... - 234.0 302.0 247.0 236.0
AV Replace -- 51
Isolated Aortic Valve Replacement Procedures
Data Summary
Participant 30863
STS Period Ending 09/30/2017
2017 is a partial year: Jan 2017 - Sept 2017
Participant 30863 Like Group STS
2015 2016 2017 2017 2017
OR Duration (min)
Mean ..................................................... - 331.0 350.2 300.5 290.1
Median ................................................... - 331.0 318.0 289.0 277.0
25th
Percentile ....................................... - 331.0 290.0 246.0 234.0
75th
Percentile ....................................... - 331.0 382.0 340.0 330.0
Valve Surgery
Aortic Annular Enlargement ...................... - 0.0% 5.9% 4.0% 4.4%
Missing .................................................. - 0.0% 0.0% 0.4% 0.9%
Valve Replacement Type
Mechanical ............................................ - 0.0% 5.9% 11.8% 11.3%
Bioprosthetic .......................................... - 100.0% 94.1% 87.9% 88.3%
Homograft .............................................. - 0.0% 0.0% 0.0% 0.1%
Autograft ................................................ - - - - -
Missing .................................................. - 0.0% 0.0% 0.2% 0.4%
Antibiotic Selection1, 2
............................... - 100.0% 100.0% 99.2% 99.4%
Exclusions ............................................. - 0.0% 0.0% 1.8% 1.6%
Missing .................................................. - 0.0% 0.0% 0.0% 0.1%
Antibiotic Timing1, 3
................................... - 100.0% 100.0% 99.1% 99.0%
Exclusions ............................................. - 0.0% 0.0% 1.2% 1.1%
Missing .................................................. - 0.0% 0.0% 0.0% 0.1%
Antibiotics Discontinued1, 4
........................ - 100.0% 100.0% 99.1% 99.2%
Exclusions ............................................. - 0.0% 0.0% 3.0% 2.8%
Missing .................................................. - 0.0% 0.0% 0.1% 0.2%
Postoperative Information
Blood Products Used ................................ - 100.0% 52.9% 33.1% 27.7%
Number of Blood Product Units Used
1 Red Blood Cell Unit ......................... - 0.0% 11.8% 9.2% 8.7%
2 Red Blood Cell Units ....................... - 0.0% 23.5% 10.0% 7.6%
3 Red Blood Cell Units ....................... - 0.0% 0.0% 3.0% 2.8%
4+ Red Blood Cell Units ..................... - 100.0% 17.6% 6.6% 5.1% 1
All antibiotic measures are calculated among patients without exclusions
1+ Fresh Frozen Plasma Units ........... - 0.0% 11.8% 10.3% 8.2% 2
First or second generation cephalosporin prescribed/given prophylactically
1+ Cryoprecipitate Units ..................... - 100.0% 11.8% 5.1% 5.1% 3
Appropriate timing of prophylactic antibiotics
1+ Platelet Units ................................. - 0.0% 29.4% 11.1% 9.4% 4
Prophylactic antibiotics discontinued within 48 hours
Missing .................................................. - 0.0% 0.0% 0.1% 0.3%
AV Replace -- 52
Isolated Aortic Valve Replacement Procedures
Data Summary
Participant 30863
STS Period Ending 09/30/2017
2017 is a partial year: Jan 2017 - Sept 2017
Participant 30863 Like Group STS
2015 2016 2017 2017 2017
Intraop/Postop Blood Products Used ........ - 100.0% 82.4% 48.1% 41.3%
Total Number of Blood Product Units
1 Red Blood Cell Unit ......................... - 0.0% 11.8% 9.8% 9.6%
2 Red Blood Cell Units ....................... - 0.0% 5.9% 12.7% 10.0%
3 Red Blood Cell Units ....................... - 0.0% 11.8% 5.4% 4.5%
4+ Red Blood Cell Units ..................... - 100.0% 41.2% 12.0% 8.9%
1+ Fresh Frozen Plasma Units ........... - 0.0% 58.8% 19.8% 15.6%
1+ Cryoprecipitate Units ..................... - 100.0% 58.8% 9.6% 9.4%
1+ Platelet Units ................................. - 100.0% 58.8% 24.9% 21.6%
Missing .................................................. - 0.0% 0.0% 0.0% 0.0%
Ventilation
Total Ventilation Hours
Mean .................................................. - 19.5 14.1 18.4 15.4
Median ............................................... - 19.5 6.0 5.6 5.3
25th
Percentile .................................... - 19.5 4.5 3.7 3.6
75th
Percentile .................................... - 19.5 20.5 10.9 9.0
Initial Ventilation Hours
Mean .................................................. - 19.5 13.6 12.9 11.3
Median ............................................... - 19.5 5.6 5.5 5.2
Initial Ventilation <6 hours1
................. - 0.0% 52.9% 55.1% 59.4%
Extubated in OR .................................... - 0.0% 17.6% 2.9% 2.8%
Missing .................................................. - 0.0% 0.0% 0.1% 0.3%
Reintubation .......................................... - 0.0% 11.8% 4.3% 3.2%
Missing .................................................. - 0.0% 0.0% 0.2% 0.4%
Additional Ventilation Hours2
Mean .................................................. - - 4.0 126.8 129.7
Median ............................................... - - 4.0 65.0 65.0
ICU Stay
Total ICU Hours 2
Among patients reintubated
Mean .................................................. - 121.9 167.3 84.9 68.0
Median ............................................... - 121.9 137.3 53.9 46.3
25th
Percentile .................................... - 121.9 114.4 31.2 25.0
75th
Percentile .................................... - 121.9 194.2 98.0 74.8
AV Replace -- 53
Outcomes for cardiac surgery at Mt. View 2017

Mais conteúdo relacionado

Semelhante a Outcomes for cardiac surgery at Mt. View 2017

L9 for Stress
L9 for StressL9 for Stress
L9 for Stresslami9caps
 
The Effect of an Ageing Population on British Diets
The Effect of an Ageing Population on British DietsThe Effect of an Ageing Population on British Diets
The Effect of an Ageing Population on British DietsAlexander Lewzey
 
Seismic attributes and avo analysis ahmed hafez (2)
Seismic attributes and avo analysis ahmed hafez (2)Seismic attributes and avo analysis ahmed hafez (2)
Seismic attributes and avo analysis ahmed hafez (2)Ahmed Hafez
 
Fat embolism syndrome state of-the-art review focused on
Fat embolism syndrome state of-the-art review focused onFat embolism syndrome state of-the-art review focused on
Fat embolism syndrome state of-the-art review focused oncadoc
 
Manual de tecnicas de bioestadística basica
Manual de tecnicas de bioestadística basica Manual de tecnicas de bioestadística basica
Manual de tecnicas de bioestadística basica KristemKertzeif1
 
Smith randall 15-rolling-element-bearing-diagnostics-cwu
Smith randall 15-rolling-element-bearing-diagnostics-cwuSmith randall 15-rolling-element-bearing-diagnostics-cwu
Smith randall 15-rolling-element-bearing-diagnostics-cwuProto Gonzales Rique
 
Society at a Glance 2016 OECD. Social indicators
Society at a Glance 2016 OECD. Social indicatorsSociety at a Glance 2016 OECD. Social indicators
Society at a Glance 2016 OECD. Social indicatorsLino Agudelo Luna
 
MRE Application Monograph_addons
MRE Application Monograph_addonsMRE Application Monograph_addons
MRE Application Monograph_addonsVinod Palathinkara
 
OCDE_Health at a glance 2013
OCDE_Health at a glance 2013OCDE_Health at a glance 2013
OCDE_Health at a glance 2013FIAB
 
Donhauser - 2012 - Jump Variation From High-Frequency Asset Returns
Donhauser - 2012 - Jump Variation From High-Frequency Asset ReturnsDonhauser - 2012 - Jump Variation From High-Frequency Asset Returns
Donhauser - 2012 - Jump Variation From High-Frequency Asset ReturnsBrian Donhauser
 
OFF-PUMP CORONARY ARTERY BYPASS SURGERY A GUIDE TO MANAGING THE HEMODYNAMIC C...
OFF-PUMP CORONARY ARTERY BYPASS SURGERY A GUIDE TO MANAGING THE HEMODYNAMIC C...OFF-PUMP CORONARY ARTERY BYPASS SURGERY A GUIDE TO MANAGING THE HEMODYNAMIC C...
OFF-PUMP CORONARY ARTERY BYPASS SURGERY A GUIDE TO MANAGING THE HEMODYNAMIC C...Scott Sadel, M.D., F.A.S.E
 
Hướng dẫn sử dụng Testo 320
Hướng dẫn sử dụng Testo 320Hướng dẫn sử dụng Testo 320
Hướng dẫn sử dụng Testo 320Tenmars Việt Nam
 
qwest communications Q_2Q07_ERAttach
qwest communications Q_2Q07_ERAttachqwest communications Q_2Q07_ERAttach
qwest communications Q_2Q07_ERAttachfinance19
 
Webber-thesis-2015
Webber-thesis-2015Webber-thesis-2015
Webber-thesis-2015Darcy Webber
 

Semelhante a Outcomes for cardiac surgery at Mt. View 2017 (20)

L9 for Stress
L9 for StressL9 for Stress
L9 for Stress
 
Health Care Statistics
Health Care Statistics Health Care Statistics
Health Care Statistics
 
EvalInvStrats_web
EvalInvStrats_webEvalInvStrats_web
EvalInvStrats_web
 
The Effect of an Ageing Population on British Diets
The Effect of an Ageing Population on British DietsThe Effect of an Ageing Population on British Diets
The Effect of an Ageing Population on British Diets
 
Seismic attributes and avo analysis ahmed hafez (2)
Seismic attributes and avo analysis ahmed hafez (2)Seismic attributes and avo analysis ahmed hafez (2)
Seismic attributes and avo analysis ahmed hafez (2)
 
Fat embolism syndrome state of-the-art review focused on
Fat embolism syndrome state of-the-art review focused onFat embolism syndrome state of-the-art review focused on
Fat embolism syndrome state of-the-art review focused on
 
Manual de tecnicas de bioestadística basica
Manual de tecnicas de bioestadística basica Manual de tecnicas de bioestadística basica
Manual de tecnicas de bioestadística basica
 
Tasc II
Tasc IITasc II
Tasc II
 
Smith randall 15-rolling-element-bearing-diagnostics-cwu
Smith randall 15-rolling-element-bearing-diagnostics-cwuSmith randall 15-rolling-element-bearing-diagnostics-cwu
Smith randall 15-rolling-element-bearing-diagnostics-cwu
 
Society at a Glance 2016 OECD. Social indicators
Society at a Glance 2016 OECD. Social indicatorsSociety at a Glance 2016 OECD. Social indicators
Society at a Glance 2016 OECD. Social indicators
 
Who blood products
Who blood productsWho blood products
Who blood products
 
MRE Application Monograph_addons
MRE Application Monograph_addonsMRE Application Monograph_addons
MRE Application Monograph_addons
 
OCDE_Health at a glance 2013
OCDE_Health at a glance 2013OCDE_Health at a glance 2013
OCDE_Health at a glance 2013
 
Donhauser - 2012 - Jump Variation From High-Frequency Asset Returns
Donhauser - 2012 - Jump Variation From High-Frequency Asset ReturnsDonhauser - 2012 - Jump Variation From High-Frequency Asset Returns
Donhauser - 2012 - Jump Variation From High-Frequency Asset Returns
 
OFF-PUMP CORONARY ARTERY BYPASS SURGERY A GUIDE TO MANAGING THE HEMODYNAMIC C...
OFF-PUMP CORONARY ARTERY BYPASS SURGERY A GUIDE TO MANAGING THE HEMODYNAMIC C...OFF-PUMP CORONARY ARTERY BYPASS SURGERY A GUIDE TO MANAGING THE HEMODYNAMIC C...
OFF-PUMP CORONARY ARTERY BYPASS SURGERY A GUIDE TO MANAGING THE HEMODYNAMIC C...
 
Hướng dẫn sử dụng Testo 320
Hướng dẫn sử dụng Testo 320Hướng dẫn sử dụng Testo 320
Hướng dẫn sử dụng Testo 320
 
Xray 1
Xray 1Xray 1
Xray 1
 
Xray 1
Xray 1Xray 1
Xray 1
 
qwest communications Q_2Q07_ERAttach
qwest communications Q_2Q07_ERAttachqwest communications Q_2Q07_ERAttach
qwest communications Q_2Q07_ERAttach
 
Webber-thesis-2015
Webber-thesis-2015Webber-thesis-2015
Webber-thesis-2015
 

Mais de Robert Poston

SUNY-Downstate CT Surgery Results
SUNY-Downstate CT Surgery ResultsSUNY-Downstate CT Surgery Results
SUNY-Downstate CT Surgery ResultsRobert Poston
 
Surgery Grand Rounds - Downstate 2018
Surgery Grand Rounds - Downstate 2018Surgery Grand Rounds - Downstate 2018
Surgery Grand Rounds - Downstate 2018Robert Poston
 
Invited Presentation at the Eastern Cardiothoracic Surgical Society 2018
Invited Presentation at the Eastern Cardiothoracic Surgical Society 2018Invited Presentation at the Eastern Cardiothoracic Surgical Society 2018
Invited Presentation at the Eastern Cardiothoracic Surgical Society 2018Robert Poston
 
Team training for robotic heart surgery at Downstate
Team training for robotic heart surgery at DownstateTeam training for robotic heart surgery at Downstate
Team training for robotic heart surgery at DownstateRobert Poston
 
Dr. Poston's surgical laser training
Dr. Poston's surgical laser trainingDr. Poston's surgical laser training
Dr. Poston's surgical laser trainingRobert Poston
 
Dr. Poston's robotic training
Dr. Poston's robotic trainingDr. Poston's robotic training
Dr. Poston's robotic trainingRobert Poston
 
Culture of safety for Downstate ct surgery
Culture of safety for Downstate ct surgeryCulture of safety for Downstate ct surgery
Culture of safety for Downstate ct surgeryRobert Poston
 
Cardiac Surgery at Mountain View Medical Center 2017
Cardiac Surgery at Mountain View Medical Center 2017Cardiac Surgery at Mountain View Medical Center 2017
Cardiac Surgery at Mountain View Medical Center 2017Robert Poston
 
Support group at St. Francis
Support group at St. FrancisSupport group at St. Francis
Support group at St. FrancisRobert Poston
 
Grand Rounds: Univ of Chicago Cardiology
Grand Rounds: Univ of Chicago CardiologyGrand Rounds: Univ of Chicago Cardiology
Grand Rounds: Univ of Chicago CardiologyRobert Poston
 
Invited Presentation: Hybrid coronary revascularization, ISMICS
Invited Presentation: Hybrid coronary revascularization, ISMICSInvited Presentation: Hybrid coronary revascularization, ISMICS
Invited Presentation: Hybrid coronary revascularization, ISMICSRobert Poston
 
Abstract presentation - Bleeding and patient satisfaction
Abstract presentation - Bleeding and patient satisfactionAbstract presentation - Bleeding and patient satisfaction
Abstract presentation - Bleeding and patient satisfactionRobert Poston
 
Society of Laparoscopic Surgery, Invited Presentation, Aug 2015
Society of Laparoscopic Surgery, Invited Presentation, Aug 2015Society of Laparoscopic Surgery, Invited Presentation, Aug 2015
Society of Laparoscopic Surgery, Invited Presentation, Aug 2015Robert Poston
 
Summary of UA CT Surgery 2011-14
Summary of UA CT Surgery 2011-14Summary of UA CT Surgery 2011-14
Summary of UA CT Surgery 2011-14Robert Poston
 
Invited Presentation: Ex Vivo Storage of Vein Grafts
Invited Presentation: Ex Vivo Storage of Vein GraftsInvited Presentation: Ex Vivo Storage of Vein Grafts
Invited Presentation: Ex Vivo Storage of Vein GraftsRobert Poston
 

Mais de Robert Poston (19)

SUNY-Downstate CT Surgery Results
SUNY-Downstate CT Surgery ResultsSUNY-Downstate CT Surgery Results
SUNY-Downstate CT Surgery Results
 
Surgery Grand Rounds - Downstate 2018
Surgery Grand Rounds - Downstate 2018Surgery Grand Rounds - Downstate 2018
Surgery Grand Rounds - Downstate 2018
 
Invited Presentation at the Eastern Cardiothoracic Surgical Society 2018
Invited Presentation at the Eastern Cardiothoracic Surgical Society 2018Invited Presentation at the Eastern Cardiothoracic Surgical Society 2018
Invited Presentation at the Eastern Cardiothoracic Surgical Society 2018
 
Team training for robotic heart surgery at Downstate
Team training for robotic heart surgery at DownstateTeam training for robotic heart surgery at Downstate
Team training for robotic heart surgery at Downstate
 
Dr. Poston's surgical laser training
Dr. Poston's surgical laser trainingDr. Poston's surgical laser training
Dr. Poston's surgical laser training
 
Dr. Poston's robotic training
Dr. Poston's robotic trainingDr. Poston's robotic training
Dr. Poston's robotic training
 
Culture of safety for Downstate ct surgery
Culture of safety for Downstate ct surgeryCulture of safety for Downstate ct surgery
Culture of safety for Downstate ct surgery
 
Cardiac Surgery at Mountain View Medical Center 2017
Cardiac Surgery at Mountain View Medical Center 2017Cardiac Surgery at Mountain View Medical Center 2017
Cardiac Surgery at Mountain View Medical Center 2017
 
Data.sts.sfmc2016
Data.sts.sfmc2016Data.sts.sfmc2016
Data.sts.sfmc2016
 
Pima society
Pima societyPima society
Pima society
 
Support group at St. Francis
Support group at St. FrancisSupport group at St. Francis
Support group at St. Francis
 
Grand Rounds: Univ of Chicago Cardiology
Grand Rounds: Univ of Chicago CardiologyGrand Rounds: Univ of Chicago Cardiology
Grand Rounds: Univ of Chicago Cardiology
 
Invited Presentation: Hybrid coronary revascularization, ISMICS
Invited Presentation: Hybrid coronary revascularization, ISMICSInvited Presentation: Hybrid coronary revascularization, ISMICS
Invited Presentation: Hybrid coronary revascularization, ISMICS
 
Abstract presentation - Bleeding and patient satisfaction
Abstract presentation - Bleeding and patient satisfactionAbstract presentation - Bleeding and patient satisfaction
Abstract presentation - Bleeding and patient satisfaction
 
Society of Laparoscopic Surgery, Invited Presentation, Aug 2015
Society of Laparoscopic Surgery, Invited Presentation, Aug 2015Society of Laparoscopic Surgery, Invited Presentation, Aug 2015
Society of Laparoscopic Surgery, Invited Presentation, Aug 2015
 
Summary of UA CT Surgery 2011-14
Summary of UA CT Surgery 2011-14Summary of UA CT Surgery 2011-14
Summary of UA CT Surgery 2011-14
 
Invited Presentation: Ex Vivo Storage of Vein Grafts
Invited Presentation: Ex Vivo Storage of Vein GraftsInvited Presentation: Ex Vivo Storage of Vein Grafts
Invited Presentation: Ex Vivo Storage of Vein Grafts
 
Sfmc.2015results
Sfmc.2015resultsSfmc.2015results
Sfmc.2015results
 
Ems.presentation
Ems.presentationEms.presentation
Ems.presentation
 

Último

Immediate care of newborn, midwifery and obstetrical nursing
Immediate care of newborn, midwifery and obstetrical nursingImmediate care of newborn, midwifery and obstetrical nursing
Immediate care of newborn, midwifery and obstetrical nursingNursing education
 
Text Neck Syndrome and its probable way out.pptx
Text Neck Syndrome and its probable way out.pptxText Neck Syndrome and its probable way out.pptx
Text Neck Syndrome and its probable way out.pptxProf. Satyen Bhattacharyya
 
What are weight loss medication services?
What are weight loss medication services?What are weight loss medication services?
What are weight loss medication services?Optimal Healing 4u
 
ANTIGEN- SECTION IMMUNOLOGY DEPARTMENT OF MICROBIOLOGY
ANTIGEN- SECTION IMMUNOLOGY  DEPARTMENT OF MICROBIOLOGYANTIGEN- SECTION IMMUNOLOGY  DEPARTMENT OF MICROBIOLOGY
ANTIGEN- SECTION IMMUNOLOGY DEPARTMENT OF MICROBIOLOGYDrmayuribhise
 
ILO (International Labour Organization )
ILO (International Labour Organization )ILO (International Labour Organization )
ILO (International Labour Organization )Puja Kumari
 
Exploring the Integration of Homeopathy and Allopathy in Healthcare.pdf
Exploring the Integration of Homeopathy and Allopathy in Healthcare.pdfExploring the Integration of Homeopathy and Allopathy in Healthcare.pdf
Exploring the Integration of Homeopathy and Allopathy in Healthcare.pdfDharma Homoeopathy
 
Artificial Intelligence Robotics & Computational Fluid Dynamics
Artificial Intelligence Robotics & Computational Fluid DynamicsArtificial Intelligence Robotics & Computational Fluid Dynamics
Artificial Intelligence Robotics & Computational Fluid DynamicsParag Kothawade
 
MVP Health Care City of Schenectady Presentation
MVP Health Care City of Schenectady PresentationMVP Health Care City of Schenectady Presentation
MVP Health Care City of Schenectady PresentationMVP Health Care
 
Local Advanced Esophageal Cancer (T3-4N0-2M0): Artificial Intelligence, Syner...
Local Advanced Esophageal Cancer (T3-4N0-2M0): Artificial Intelligence, Syner...Local Advanced Esophageal Cancer (T3-4N0-2M0): Artificial Intelligence, Syner...
Local Advanced Esophageal Cancer (T3-4N0-2M0): Artificial Intelligence, Syner...Oleg Kshivets
 
Information about acne, detail description of their treatment by topical and ...
Information about acne, detail description of their treatment by topical and ...Information about acne, detail description of their treatment by topical and ...
Information about acne, detail description of their treatment by topical and ...mauryashreya478
 
Mental Health for physiotherapy and other health students
Mental Health for physiotherapy and other health studentsMental Health for physiotherapy and other health students
Mental Health for physiotherapy and other health studentseyobkaseye
 
unit-3 blood product B.Pharma 3rd year .pptx
unit-3 blood product B.Pharma 3rd year .pptxunit-3 blood product B.Pharma 3rd year .pptx
unit-3 blood product B.Pharma 3rd year .pptxBkGupta21
 
TEENAGE PREGNANCY PREVENTION AND AWARENESS
TEENAGE PREGNANCY PREVENTION AND AWARENESSTEENAGE PREGNANCY PREVENTION AND AWARENESS
TEENAGE PREGNANCY PREVENTION AND AWARENESSPeterJamesVitug
 
Back care and back massage. powerpoint presentation
Back care and back massage. powerpoint presentationBack care and back massage. powerpoint presentation
Back care and back massage. powerpoint presentationpratiksha ghimire
 
Field exchange, Issue 72 April 2024 FEX-72.pdf
Field exchange, Issue 72 April 2024 FEX-72.pdfField exchange, Issue 72 April 2024 FEX-72.pdf
Field exchange, Issue 72 April 2024 FEX-72.pdfMohamed Miyir
 
EMS Response to Terrorism involving Weapons of Mass Destruction
EMS Response to Terrorism involving Weapons of Mass DestructionEMS Response to Terrorism involving Weapons of Mass Destruction
EMS Response to Terrorism involving Weapons of Mass DestructionJannelPomida
 

Último (20)

Immediate care of newborn, midwifery and obstetrical nursing
Immediate care of newborn, midwifery and obstetrical nursingImmediate care of newborn, midwifery and obstetrical nursing
Immediate care of newborn, midwifery and obstetrical nursing
 
Text Neck Syndrome and its probable way out.pptx
Text Neck Syndrome and its probable way out.pptxText Neck Syndrome and its probable way out.pptx
Text Neck Syndrome and its probable way out.pptx
 
What are weight loss medication services?
What are weight loss medication services?What are weight loss medication services?
What are weight loss medication services?
 
ANTIGEN- SECTION IMMUNOLOGY DEPARTMENT OF MICROBIOLOGY
ANTIGEN- SECTION IMMUNOLOGY  DEPARTMENT OF MICROBIOLOGYANTIGEN- SECTION IMMUNOLOGY  DEPARTMENT OF MICROBIOLOGY
ANTIGEN- SECTION IMMUNOLOGY DEPARTMENT OF MICROBIOLOGY
 
ILO (International Labour Organization )
ILO (International Labour Organization )ILO (International Labour Organization )
ILO (International Labour Organization )
 
Exploring the Integration of Homeopathy and Allopathy in Healthcare.pdf
Exploring the Integration of Homeopathy and Allopathy in Healthcare.pdfExploring the Integration of Homeopathy and Allopathy in Healthcare.pdf
Exploring the Integration of Homeopathy and Allopathy in Healthcare.pdf
 
Artificial Intelligence Robotics & Computational Fluid Dynamics
Artificial Intelligence Robotics & Computational Fluid DynamicsArtificial Intelligence Robotics & Computational Fluid Dynamics
Artificial Intelligence Robotics & Computational Fluid Dynamics
 
DELIRIUM psychiatric delirium is a organic mental disorder
DELIRIUM  psychiatric  delirium is a organic mental disorderDELIRIUM  psychiatric  delirium is a organic mental disorder
DELIRIUM psychiatric delirium is a organic mental disorder
 
MVP Health Care City of Schenectady Presentation
MVP Health Care City of Schenectady PresentationMVP Health Care City of Schenectady Presentation
MVP Health Care City of Schenectady Presentation
 
Local Advanced Esophageal Cancer (T3-4N0-2M0): Artificial Intelligence, Syner...
Local Advanced Esophageal Cancer (T3-4N0-2M0): Artificial Intelligence, Syner...Local Advanced Esophageal Cancer (T3-4N0-2M0): Artificial Intelligence, Syner...
Local Advanced Esophageal Cancer (T3-4N0-2M0): Artificial Intelligence, Syner...
 
Information about acne, detail description of their treatment by topical and ...
Information about acne, detail description of their treatment by topical and ...Information about acne, detail description of their treatment by topical and ...
Information about acne, detail description of their treatment by topical and ...
 
Check Your own POSTURE & treat yourself.pptx
Check Your own POSTURE & treat yourself.pptxCheck Your own POSTURE & treat yourself.pptx
Check Your own POSTURE & treat yourself.pptx
 
Mental Health for physiotherapy and other health students
Mental Health for physiotherapy and other health studentsMental Health for physiotherapy and other health students
Mental Health for physiotherapy and other health students
 
unit-3 blood product B.Pharma 3rd year .pptx
unit-3 blood product B.Pharma 3rd year .pptxunit-3 blood product B.Pharma 3rd year .pptx
unit-3 blood product B.Pharma 3rd year .pptx
 
Dr Sujit Chatterjee Hiranandani Hospital Kidney.pdf
Dr Sujit Chatterjee Hiranandani Hospital Kidney.pdfDr Sujit Chatterjee Hiranandani Hospital Kidney.pdf
Dr Sujit Chatterjee Hiranandani Hospital Kidney.pdf
 
Coping with Childhood Cancer - How Does it Hurt Today
Coping with Childhood Cancer - How Does it Hurt TodayCoping with Childhood Cancer - How Does it Hurt Today
Coping with Childhood Cancer - How Does it Hurt Today
 
TEENAGE PREGNANCY PREVENTION AND AWARENESS
TEENAGE PREGNANCY PREVENTION AND AWARENESSTEENAGE PREGNANCY PREVENTION AND AWARENESS
TEENAGE PREGNANCY PREVENTION AND AWARENESS
 
Back care and back massage. powerpoint presentation
Back care and back massage. powerpoint presentationBack care and back massage. powerpoint presentation
Back care and back massage. powerpoint presentation
 
Field exchange, Issue 72 April 2024 FEX-72.pdf
Field exchange, Issue 72 April 2024 FEX-72.pdfField exchange, Issue 72 April 2024 FEX-72.pdf
Field exchange, Issue 72 April 2024 FEX-72.pdf
 
EMS Response to Terrorism involving Weapons of Mass Destruction
EMS Response to Terrorism involving Weapons of Mass DestructionEMS Response to Terrorism involving Weapons of Mass Destruction
EMS Response to Terrorism involving Weapons of Mass Destruction
 

Outcomes for cardiac surgery at Mt. View 2017

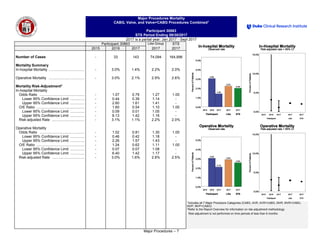
  • 1. Major Procedures Mortality CABG, Valve, and Valve+CABG Procedures Combined1 Participant 30863 STS Period Ending 09/30/2017 2017 is a partial year: Jan 2017 - Sept 2017 Participant 30863 Like Group STS 2015 2016 2017 2017 2017 Number of Cases - 33 143 74,094 164,896 Mortality Summary In-hospital Mortality ................................... - 3.0% 1.4% 2.2% 2.0% Operative Mortality ................................... - 3.0% 2.1% 2.9% 2.6% Mortality Risk-Adjustment2 In-hospital Mortality Odds Ratio ............................................ - 1.07 0.79 1.27 1.00 Lower 95% Confidence Limit .............. - 0.44 0.39 1.14 - Upper 95% Confidence Limit .............. - 2.60 1.61 1.41 - O/E Ratio ............................................... - 1.60 0.54 1.10 1.00 Lower 95% Confidence Limit .............. - 0.09 0.01 1.05 - Upper 95% Confidence Limit .............. - 8.13 1.42 1.16 - Risk-adjusted Rate ................................ - 3.1% 1.1% 2.2% 2.0% Operative Mortality Odds Ratio ............................................ - 1.02 0.81 1.30 1.00 Lower 95% Confidence Limit .............. - 0.46 0.42 1.18 - Upper 95% Confidence Limit .............. - 2.26 1.57 1.43 - O/E Ratio ............................................... - 1.24 0.62 1.11 1.00 Lower 95% Confidence Limit .............. - 0.07 0.07 1.08 - Upper 95% Confidence Limit .............. - 6.40 1.42 1.17 - Risk-adjusted Rate ................................ - 3.0% 1.6% 2.8% 2.5% 1 Includes all 7 Major Procedure Categories (CABG, AVR, AVR+CABG, MVR, MVR+CABG, MVP, MVP+CABG) 2 Refer to the Report Overview for information on risk-adjustment methodology Risk-adjustment is not performed on time periods of less than 6 months Major Procedures -- 7
  • 3. Isolated CABG Procedures Data Summary Participant 30863 STS Period Ending 09/30/2017 2017 is a partial year: Jan 2017 - Sept 2017 Participant 30863 Like Group STS 2015 2016 2017 2017 2017 Number of Cases - 32 116 54,881 116,231 Demographics Age (years) Mean ..................................................... - 72.7 69.1 65.6 65.6 Median ................................................... - 72.5 70.0 66.0 66.0 25th Percentile ....................................... - 68.5 63.0 59.0 59.0 75th Percentile ....................................... - 78.0 76.0 73.0 73.0 Age >= 65 years old .............................. - 87.5% 66.4% 56.7% 56.5% Gender, Female ........................................ - 9.4% 25.9% 24.5% 24.5% Missing .................................................. - 0.0% 0.0% 0.0% 0.0% Race1 Caucasian ............................................. - 93.8% 97.4% 83.3% 82.7% Black ...................................................... - 0.0% 0.0% 6.6% 7.4% Asian ..................................................... - 0.0% 0.0% 3.7% 3.5% Native American .................................... - 3.1% 2.6% 0.8% 0.6% Native Hawaiian/Pacific Islander ........... - 0.0% 0.0% 0.5% 0.5% Other ..................................................... - 0.0% 1.7% 3.8% 3.4% Multiple Races ....................................... - 0.0% 2.6% 1.2% 0.9% Missing / Not Documented .................... - 3.1% 0.9% 2.5% 2.9% Pt. Declined to Disclose2 ....................... - 3.1% 0.9% 0.5% 0.6% Hispanic or Latino or Spanish Ethnicity .... - 28.1% 36.2% 9.2% 7.4% Missing/ Not Documented ..................... - 6.3% 0.9% 4.1% 4.1% Body Mass Index3 Underweight (BMI < 18.5) ...................... - 0.0% 0.9% 0.7% 0.7% Normal (BMI 18.5 - 24.9) ....................... - 28.1% 18.1% 17.3% 17.7% Overweight (BMI 25.0 - 29.9) ................ - 28.1% 37.1% 37.0% 36.9% Obese I (BMI 30.0 - 34.9) ...................... - 34.4% 31.0% 26.9% 27.0% Obese II (BMI 35.0 - 39.9) ..................... - 9.4% 7.8% 11.7% 11.6% Morbid Obesity (BMI 40.0+) ................... - 0.0% 5.2% 6.3% 6.0% Missing Height ....................................... - 0.0% 0.0% 0.1% 0.1% 1 Data presented in the report represent the individual response rates for each race category Missing Weight ...................................... - 0.0% 0.0% 0.1% 0.1% shown; summing the individual non-caucasian categories will not result in the same rates as shown in the graph since non-caucasian, as defined for the graph, does not include races or ethnicities reported in combination with caucasian 2 Option added in v2.81 3 BMI = Weight(kg) / Height(m)2 CABG -- 9
  • 4. Isolated CABG Procedures Data Summary Participant 30863 STS Period Ending 09/30/2017 2017 is a partial year: Jan 2017 - Sept 2017 Participant 30863 Like Group STS 2015 2016 2017 2017 2017 Comorbidities Diabetes Mellitus ...................................... - 46.9% 51.7% 49.4% 49.3% Diet Control ........................................ - 0.0% 1.7% 2.9% 2.8% Oral Control ........................................ - 12.5% 14.7% 22.4% 22.3% Insulin Control .................................... - 25.0% 34.5% 18.0% 18.2% Other SQ Medication Control1 ............ - 0.0% 0.0% 0.4% 0.4% Other Control ...................................... - 0.0% 0.0% 0.1% 0.1% Missing Control ................................... - 13.3% 1.7% 0.9% 0.8% Missing .................................................. - 3.1% 0.9% 0.2% 0.2% Hypertension ............................................ - 71.9% 87.9% 89.4% 89.4% Missing .................................................. - 3.1% 0.9% 0.2% 0.2% Dyslipidemia ............................................. - 71.9% 79.3% 89.6% 90.2% Missing .................................................. - 3.1% 3.4% 0.3% 0.3% Family History of CAD .............................. - 50.0% 44.8% 23.3% 20.6% Missing .................................................. - 9.4% 24.1% 4.3% 4.4% Current/Recent Cigarette Smoker ............ - 9.4% 21.6% 22.6% 22.0% Smoker, Current Status Unknown1 ........ - 6.3% 0.9% 0.5% 0.5% Missing .................................................. - 6.3% 11.2% 0.6% 0.6% Chronic Lung Disease Mild ........................................................ - 3.1% 12.9% 10.1% 9.5% Moderate ............................................... - 3.1% 11.2% 5.2% 4.6% Severe ................................................... - 0.0% 6.9% 4.2% 4.0% Unknown Severity1 ................................ - 21.9% 27.6% 7.4% 7.1% Missing .................................................. - 25.0% 16.4% 3.1% 2.7% Congestive Heart Failure .......................... - 3.1% 36.2% 17.7% 18.4% CHF / NYHA Class I2 .......................... - 3.1% 20.7% 1.5% 1.9% CHF / NYHA Class II .......................... - 0.0% 8.6% 5.2% 5.7% CHF / NYHA Class III ......................... - 0.0% 5.2% 7.2% 7.4% CHF / NYHA Class IV ......................... - 0.0% 0.9% 4.2% 4.1% CHF / Missing Class ........................... - 0.0% 2.4% 2.6% 2.6% 1 Option added in v2.81 Missing .................................................. - 0.0% 22.4% 1.2% 1.0% 2 NYHA Class is only collected for patients with CHF % represents proportion of cases that had both CHF and the indicated NYHA class Peripheral Arterial Disease ....................... - 3.1% 15.5% 13.9% 13.9% Missing .................................................. - 3.1% 8.6% 0.9% 0.5% CABG -- 10
  • 5. Isolated CABG Procedures Data Summary Participant 30863 STS Period Ending 09/30/2017 2017 is a partial year: Jan 2017 - Sept 2017 Participant 30863 Like Group STS 2015 2016 2017 2017 2017 Cerebrovascular Disease ......................... - 15.6% 26.7% 21.7% 21.6% Missing ............................................... - 0.0% 0.9% 0.9% 0.8% Coma/Nonresponsive State ................... - 0.0% 1.7% 0.3% 0.2% Missing ............................................... - 0.0% 0.0% 0.9% 1.0% CVD TIA ................................................ - 6.3% 3.4% 4.3% 4.3% Missing ............................................... - 0.0% 6.0% 1.3% 1.1% Carotid Stenosis1 None ................................................... - 87.5% 80.2% 85.9% 86.5% 50-79%2 .............................................. - 0.0% 12.9% 10.0% 9.6% 80-100% ............................................. - 0.0% 5.2% 2.1% 2.1% Missing/Not Documented ................... - 12.5% 1.7% 1.9% 1.8% CVD Prior Carotid Surgery .................... - 9.4% 0.9% 3.4% 3.4% Missing ............................................... - 0.0% 0.9% 1.0% 0.9% Cerebrovascular Accident ..................... - 0.0% 6.9% 7.6% 7.9% Missing ............................................... - 0.0% 4.3% 1.1% 0.9% Renal Failure, Dialysis-Dependent ........... - 0.0% 3.4% 3.2% 3.2% Missing ............................................... - 3.1% 0.9% 0.2% 0.2% Last Creatinine Preop ............................... Mean ..................................................... - 1.0 1.2 1.2 1.2 Median ................................................... - 0.8 0.9 1.0 1.0 25th Percentile ....................................... - 0.8 0.8 0.8 0.8 75th Percentile ....................................... - 1.0 1.2 1.2 1.2 Missing .................................................. - 0.0% 0.0% 0.3% 0.3% Value >= 4.0 mg/dL ............................... - 0.0% 1.7% 2.4% 2.5% Immunosuppressive Treatment ................ - 3.1% 0.0% 3.1% 3.3% Missing ............................................... - 3.1% 2.6% 0.7% 0.5% Previous Interventions 1 Defined as highest level of occlusion in either carotid. Previous Cardiac Surgery3 ....................... - 0.0% 6.9% 2.2% 2.4% 2 Option added in v2.81 First reoperation .................................... - 0.0% 6.9% 2.1% 2.4% 3 Previous cardiac surgery reflects any prior CABG, valve, or other cardiac surgery Previous CABG ........................................ - 0.0% 5.2% 1.6% 1.8% CABG -- 11
  • 6. Isolated CABG Procedures Data Summary Participant 30863 STS Period Ending 09/30/2017 2017 is a partial year: Jan 2017 - Sept 2017 Participant 30863 Like Group STS 2015 2016 2017 2017 2017 Previous AICD .......................................... - 0.0% 0.9% 1.0% 1.0% Previous Pacemaker ................................. - 0.0% 5.2% 1.7% 1.8% Previous PCI ............................................. - 15.6% 31.0% 30.7% 30.9% <= 6 hours prior to surgery .................... - 0.0% 1.7% 1.1% 0.9% > 6 hours prior to surgery ...................... - 15.6% 29.3% 29.5% 29.9% Missing timing ........................................ - 0.0% 0.0% 0.3% 0.2% Previous PCI Stent ................................... - 100.0% 91.7% 85.9% 87.4% Status Surgery Status Elective .................................................. - 28.1% 43.1% 37.7% 37.4% Urgent .................................................... - 50.0% 53.4% 57.7% 58.5% Emergent ............................................... - 21.9% 3.4% 4.4% 3.9% Emergent Salvage ................................. - 0.0% 0.0% 0.2% 0.2% Missing .................................................. - 0.0% 0.0% 0.0% 0.0% MI .............................................................. - 25.0% 42.2% 54.5% 54.0% <= 7 days prior to surgery .................. - 21.9% 23.3% 31.3% 29.8% 8-21 days prior to surgery .................. - 0.0% 3.4% 5.1% 5.4% >21 days prior to surgery .................... - 3.1% 15.5% 17.9% 18.7% Missing timing ..................................... - 0.0% 0.0% 0.1% 0.1% Missing .................................................. - 0.0% 13.8% 0.9% 0.6% Cardiogenic Shock At the time of surgery ......................... - 15.6% 0.9% 1.5% 1.5% Within 24 hrs of surgery1 .................... - 3.1% 0.9% 0.6% 0.5% Missing .................................................. - 0.0% 0.0% 0.1% 0.1% Resuscitation <= 1 hr prior to surgery ........................ - 0.0% 0.0% 0.3% 0.3% 1-24 hrs prior to surgery1 ....................... - 0.0% 0.0% 0.5% 0.4% Missing .................................................. - 0.0% 0.0% 0.1% 0.1% 1 Option added in v2.81 CABG -- 12
  • 7. Isolated CABG Procedures Data Summary Participant 30863 STS Period Ending 09/30/2017 2017 is a partial year: Jan 2017 - Sept 2017 Participant 30863 Like Group STS 2015 2016 2017 2017 2017 Cardiac Pres. on Admission No Symptoms or Angina ........................ - 3.1% 3.4% 7.7% 7.5% Stable Angina ........................................ - 25.0% 27.6% 14.4% 15.1% Unstable Angina .................................... - 34.4% 31.9% 35.3% 35.8% Non-ST Elevation MI (Non-STEMI) ....... - 21.9% 29.3% 28.9% 27.8% ST Elevation MI (STEMI) ....................... - 6.3% 3.4% 5.6% 5.2% Angina Equivalent1 ................................ - 6.3% 0.9% 3.4% 3.5% Other1 .................................................... - 3.1% 3.4% 4.6% 5.0% Missing .................................................. - 0.0% 0.0% 0.1% 0.1% Any Arrhythmia2 ........................................ - 18.8% 18.1% 13.9% 13.9% Recent ................................................... - 18.8% 12.9% 11.3% 11.3% Remote .................................................. - 0.0% 3.4% 2.1% 2.2% Missing .................................................. - 3.1% 3.4% 0.3% 0.3% Ventricular Tachycardia/Fibrillation3 ...... - 3.1% 1.7% 3.2% 3.3% Missing ............................................... - 0.0% 0.0% 0.3% 0.2% 3rd degree Heart Block3 ......................... - 0.0% 1.7% 0.6% 0.6% Missing ............................................... - 0.0% 0.0% 0.4% 0.3% Atrial Fibrillation3, 4 ................................. - 15.6% 8.6% 9.4% 9.4% Missing ............................................... - 0.0% 0.0% 0.3% 0.3% Atrial Flutter3, 4 ....................................... - 0.0% 0.9% 1.1% 1.1% Missing ............................................... - 0.0% 0.0% 0.4% 0.2% Hemodynamics and Catheterization Number of Diseased Coronary Vessels One ........................................................ - 0.0% 4.3% 3.7% 3.8% Two ........................................................ - 31.3% 16.4% 18.9% 19.0% Three ..................................................... - 62.5% 74.1% 76.5% 76.3% Missing .................................................. - 6.3% 5.2% 0.9% 0.8% Left Main Disease (>=50% Stenosis) ........ - 43.8% 32.8% 32.2% 31.5% Missing .................................................. - 50.0% 61.2% 34.5% 37.7% 1 Option added in v2.81 2 Includes VTach/VFib, 2nd and 3rd degree HB, Sick Sinus Syndrome, AFib, and Aflutter 3 For v2.81 data, includes recent or remote arrhythmias 4 For v2.81 data, AFib and AFlutter were separated. CABG -- 13
  • 8. Isolated CABG Procedures Data Summary Participant 30863 STS Period Ending 09/30/2017 2017 is a partial year: Jan 2017 - Sept 2017 Participant 30863 Like Group STS 2015 2016 2017 2017 2017 Ejection Fraction Mean ..................................................... - 55.6 48.0 52.0 52.1 Median ................................................... - 60.0 50.0 55.0 55.0 25th Percentile ....................................... - 55.0 35.0 45.0 45.0 75th Percentile ....................................... - 60.0 60.0 60.0 60.0 EF missing or not measured .................. - 21.9% 7.8% 3.2% 2.8% EF <40%1 .............................................. - 8.0% 26.2% 15.5% 15.3% Pulmonary Hypertension2 ......................... - 50.0% 39.2% 34.9% 34.0% PA mean/systolic pressure missing or not measured .................................... - 93.8% 56.0% 66.6% 68.3% Aortic Stenosis .......................................... - 0.0% 5.2% 3.6% 3.5% Missing .................................................. - - 0.0% 0.2% 0.1% Mitral Insufficiency Trivial ..................................................... - 6.3% 23.3% 26.2% 29.1% Mild ........................................................ - 0.0% 27.6% 25.8% 25.7% Moderate ............................................... - 6.3% 10.3% 6.4% 6.5% Severe ................................................... - 0.0% 0.0% 0.5% 0.5% Missing/Not Documented ...................... - - 0.0% 0.5% 0.6% Preoperative Medications Aspirin ....................................................... - 78.1% 68.1% 84.6% 84.4% Among Eligible Cases ........................... - 78.1% 69.9% 85.3% 85.1% Contraindicated / Not Indicated ............. - 0.0% 2.6% 0.8% 0.8% Missing .................................................. - 0.0% 3.4% 0.8% 0.7% Inotropics .................................................. - 6.3% 1.7% 1.4% 1.2% Missing .................................................. - 0.0% 0.0% 0.3% 0.2% Beta Blockers ........................................... - 46.9% 61.2% 88.6% 89.5% Among Eligible Cases ........................... - 45.8% 64.2% 94.2% 95.3% Contraindicated / Not Indicated ............. - 3.1% 6.0% 5.2% 5.5% Missing .................................................. - 0.0% 0.0% 0.0% 0.1% 1 Among patients with measured EF 2 PA systolic pressure > 35mmHg Steroids .................................................... - 6.3% 5.2% 2.0% 2.0% Among Eligible Cases ........................... - 6.3% 5.2% 2.1% 2.0% Contraindicated / Not Indicated ............. - 0.0% 0.0% 0.0% 0.0% Missing .................................................. - 0.0% 0.0% 0.4% 0.4% CABG -- 14
  • 9. Isolated CABG Procedures Data Summary Participant 30863 STS Period Ending 09/30/2017 2017 is a partial year: Jan 2017 - Sept 2017 Participant 30863 Like Group STS 2015 2016 2017 2017 2017 Nitrates IV ................................................. - 21.9% 12.1% 9.2% 8.7% Missing .................................................. - 0.0% 0.0% 0.4% 0.4% ACE Inhibitors ........................................... - 40.6% 24.1% 42.7% 40.4% Among Eligible Cases ........................... - 40.6% 25.0% 43.5% 41.1% Contraindicated / Not Indicated ............. - 0.0% 3.4% 1.9% 1.7% Missing .................................................. - 0.0% 0.9% 0.8% 0.8% Anticoagulants .......................................... - 62.5% 42.2% 43.4% 43.8% Missing .................................................. - 0.0% 0.0% 0.4% 0.4% Coumadin1 ................................................ - 0.0% 0.0% 0.3% 0.3% Missing .................................................. - 0.0% 0.0% 0.5% 0.5% Coumadin w/in 5 Days2 ............................ - - 2.2% 0.5% 0.4% Among Eligible Cases ........................... - - 2.2% 0.5% 0.4% Contraindicated / Not Indicated ............. - - 0.0% 0.1% 0.1% Missing .................................................. - - 0.0% 0.9% 0.7% Lipid-Lowering agents ............................... - 68.8% 37.1% 78.8% 79.0% Among Eligible Cases ........................... - 68.8% 37.1% 79.8% 80.1% Contraindicated / Not Indicated ............. - 0.0% 0.0% 1.3% 1.3% Missing .................................................. - 3.1% 0.9% 0.8% 0.8% Glycoprotein IIb/IIIa Inhibitor ..................... - 6.3% 0.9% 1.6% 1.3% Missing .................................................. - 3.1% 0.0% 0.4% 0.4% ADP Inhibitors within 5 Days .................... - 3.1% 16.4% 9.0% 9.4% Among Eligible Cases ........................... - 3.1% 16.4% 9.0% 9.5% Contraindicated / Not Indicated ............. - 0.0% 0.0% 0.1% 0.2% Missing .................................................. - 3.1% 1.7% 0.4% 0.5% ADP Inhibitor Discontinuation3 < 1 Day ............................................... - 0.0% 5.3% 14.1% 14.3% 1 Day .................................................. - 0.0% 42.1% 15.5% 17.0% 2 Days ................................................ - 0.0% 31.6% 17.4% 17.6% 1 Variable dropped in v2.9 3 Days ................................................ - 0.0% 0.0% 19.0% 19.3% 2 Variable added in v2.9 4 Days ................................................ - 0.0% 21.1% 20.2% 19.4% 3 Excludes patients not on ADP Inhibitors within 5 Days 5 Days ................................................ - 100.0% 0.0% 12.4% 11.4% Missing .................................................. - 0.0% 0.0% 1.3% 0.9% CABG -- 15
  • 10. Isolated CABG Procedures Data Summary Participant 30863 STS Period Ending 09/30/2017 2017 is a partial year: Jan 2017 - Sept 2017 Participant 30863 Like Group STS 2015 2016 2017 2017 2017 Antiplatelets within 5 Days1 ...................... - 0.0% 0.0% 4.2% 3.5% Among Eligible Cases ........................... - 0.0% 0.0% 4.2% 3.5% Contraindicated / Not Indicated ............. - 0.0% 0.0% 0.1% 0.2% Missing .................................................. - 0.0% 1.4% 0.5% 0.5% Operative Information Blood Products Used ................................ - 75.0% 26.7% 26.5% 25.8% Number of Blood Product Units Used 1 Red Blood Cell Unit ......................... - 18.8% 6.0% 5.6% 6.0% 2 Red Blood Cell Units ....................... - 18.8% 6.0% 7.7% 7.2% 3 Red Blood Cell Units ....................... - 3.1% 5.2% 2.7% 2.4% 4+ Red Blood Cell Units ..................... - 21.9% 3.4% 2.6% 2.4% 1+ Fresh Frozen Plasma Units ........... - 40.6% 13.8% 7.6% 6.8% 1+ Cryoprecipitate Units ..................... - 6.3% 6.9% 2.5% 2.6% 1+ Platelet Units ................................. - 37.5% 12.1% 13.7% 13.2% Missing .................................................. - 0.0% 0.0% 0.7% 0.7% Number of Distal Anastamoses, Total 1 ............................................................ - 9.4% 33.6% 5.0% 5.3% 2 ............................................................ - 25.0% 24.1% 17.6% 17.7% 3 ............................................................ - 50.0% 23.3% 39.7% 40.0% 4 ............................................................ - 15.6% 15.5% 28.0% 27.8% 5+ .......................................................... - 0.0% 3.4% 9.4% 9.0% Missing2 ................................................. - 0.0% 0.0% 0.1% 0.1% Vein Harvest Technique3 Endovascular/Endoscopic ..................... - 100.0% 94.9% 89.9% 91.2% Direct Vision .......................................... - 0.0% 3.4% 8.4% 7.2% Both ....................................................... - 0.0% 1.7% 1.5% 1.3% Cryopreserved ....................................... - 0.0% 0.0% 0.1% 0.0% Missing ............................................... - 0.0% 0.0% 0.2% 0.2% Internal Mammary Artery Used4 Any ........................................................ - 93.8% 100.0% 98.8% 99.0% Left ..................................................... - 84.4% 67.3% 93.2% 93.1% Right ................................................... - 0.0% 2.7% 0.4% 0.4% 1 Variable dropped in v2.9 Both .................................................... - 9.4% 30.0% 4.8% 5.0% 2 Where number of arterial conduits and number of vein grafts both missing Missing .................................................. - 0.0% 0.0% 0.1% 0.1% 3 Where at least 1 vein was harvested 4 Excludes patients with prior CABG surgery CABG -- 16
  • 11. Isolated CABG Procedures Data Summary Participant 30863 STS Period Ending 09/30/2017 2017 is a partial year: Jan 2017 - Sept 2017 Participant 30863 Like Group STS 2015 2016 2017 2017 2017 Radial Artery Used ................................... - 0.0% 0.0% 4.8% 5.0% Missing .................................................. - 0.0% 0.0% 0.5% 0.5% Radial Artery Harvest Technique ........... Endovascular/Endoscopic .................. - - - 45.9% 43.1% Direct Vision ....................................... - - - 49.3% 53.1% Both .................................................... - - - 0.8% 0.5% Missing ............................................... - - - 4.0% 3.3% IABP Used ................................................ - 25.0% 16.4% 9.8% 9.1% Preop .................................................. - 18.8% 15.5% 7.4% 6.7% Intraop ................................................ - 6.3% 0.0% 2.1% 2.0% Postop ................................................ - 0.0% 0.9% 0.4% 0.4% Missing Timing ................................... - 0.0% 0.0% 0.0% 0.0% Missing .................................................. - 0.0% 0.0% 0.2% 0.2% Robotic Technology Assisted ................... - 6.3% 50.9% 0.6% 1.0% Missing .................................................. - 0.0% 0.0% 0.3% 0.7% Off-pump Procedure (see following section for detail) ................................... - 34.4% 44.0% 13.2% 12.5% Cross-Clamp Time (min) Mean ..................................................... - 75.6 - 71.1 69.2 Median ................................................... - 77.0 - 66.0 65.0 25th Percentile ....................................... - 51.0 - 49.0 48.0 75th Percentile ....................................... - 94.0 - 88.0 86.0 Cardiopulmonary Bypass Time (min) Mean ..................................................... - 110.8 53.2 97.3 94.7 Median ................................................... - 111.0 49.0 92.0 89.0 25th Percentile ....................................... - 84.0 37.0 71.0 69.0 75th Percentile ....................................... - 125.0 64.0 118.0 114.0 CABG -- 17
  • 12. Isolated CABG Procedures Data Summary Participant 30863 STS Period Ending 09/30/2017 2017 is a partial year: Jan 2017 - Sept 2017 Participant 30863 Like Group STS 2015 2016 2017 2017 2017 Circulatory Arrest ...................................... - 0.0% 0.0% 0.4% 0.3% Missing .................................................. - 0.0% 0.0% 0.1% 0.3% Circulatory Arrest Time (min) Mean ..................................................... - - - 10.8 11.3 Median ................................................... - - - 4.0 5.0 25th Percentile ....................................... - - - 0.0 0.0 75th Percentile ....................................... - - - 9.0 11.0 Skin Incision Duration (min) Mean ..................................................... - 261.4 230.9 240.0 235.7 Median ................................................... - 237.0 219.0 231.0 227.0 25th Percentile ....................................... - 200.0 189.0 187.0 183.0 75th Percentile ....................................... - 269.0 263.0 282.0 278.0 OR Duration (min) Mean ..................................................... - 348.1 327.3 320.2 315.5 Median ................................................... - 316.0 309.0 310.0 305.0 25th Percentile ....................................... - 274.0 281.0 260.0 255.0 75th Percentile ....................................... - 351.5 353.0 369.0 364.0 Antibiotic Selection1, 2 ............................... - 100.0% 100.0% 99.4% 99.4% Exclusions ............................................. - 0.0% 0.0% 0.7% 0.7% Missing .................................................. - 0.0% 0.0% 0.0% 0.1% Antibiotic Timing1, 3 ................................... - 100.0% 100.0% 99.0% 98.9% Exclusions ............................................. - 0.0% 0.0% 0.4% 0.4% Missing .................................................. - 0.0% 0.0% 0.0% 0.1% Antibiotics Discontinued1,4 ........................ - 100.0% 99.1% 99.0% 99.1% Exclusions ............................................. - 0.0% 0.0% 1.4% 1.1% Missing .................................................. - 0.0% 0.0% 0.0% 0.1% Clotting Agents5 ........................................ - 3.1% 19.8% 84.5% 84.0% Missing .................................................. - 0.0% 0.0% 0.4% 0.9% 1 All antibiotic measures are calculated among patients without exclusions 2 First or second generation cephalosporin prescribed/given prophylactically 3 Appropriate timing of prophylactic antibiotics 4 Prophylactic antibiotics discontinued within 48 hours 5 Includes one or more of the following: Aprotinin, Epsilon Amino-Caproic Acid, Desmopressin, or Tranexamic Acid CABG -- 18
  • 13. Isolated CABG Procedures Data Summary Participant 30863 STS Period Ending 09/30/2017 2017 is a partial year: Jan 2017 - Sept 2017 Participant 30863 Like Group STS 2015 2016 2017 2017 2017 Postoperative Information Blood Products Used ................................ - 65.6% 37.1% 29.8% 28.7% Number of Blood Product Units Used 1 Red Blood Cell Unit ......................... - 15.6% 12.1% 10.0% 10.0% 2 Red Blood Cell Units ....................... - 28.1% 10.3% 9.4% 8.5% 3 Red Blood Cell Units ....................... - 12.5% 5.2% 3.0% 2.9% 4+ Red Blood Cell Units ..................... - 9.4% 7.8% 5.0% 4.8% 1+ Fresh Frozen Plasma Units ........... - 9.4% 6.0% 6.6% 6.2% 1+ Cryoprecipitate Units ..................... - 3.1% 5.2% 2.9% 3.2% 1+ Platelet Units ................................. - 3.1% 8.6% 7.2% 7.2% Missing .................................................. - 0.0% 0.0% 0.1% 0.1% Intraop/Postop Products Used .................. - 87.5% 44.0% 42.5% 41.3% Total Number of Blood Product Units 1 Red Blood Cell Unit ......................... - 12.5% 7.8% 9.5% 9.8% 2 Red Blood Cell Units ....................... - 18.8% 10.3% 11.7% 10.8% 3 Red Blood Cell Units ....................... - 18.8% 8.6% 5.2% 5.0% 4+ Red Blood Cell Units ..................... - 37.5% 12.9% 10.0% 9.4% 1+ Fresh Frozen Plasma Units ........... - 40.6% 16.4% 12.6% 11.6% 1+ Cryoprecipitate Units ..................... - 6.3% 8.6% 5.1% 5.5% 1+ Platelet Units ................................. - 37.5% 15.5% 18.5% 18.0% Missing .................................................. - 0.0% 0.0% 0.0% 0.0% Ventilation Total Ventilation Hours Mean .................................................. - 28.2 9.0 17.1 16.8 Median ............................................... - 8.7 5.3 5.7 5.7 25th Percentile .................................... - 5.8 0.5 3.8 3.9 75th Percentile .................................... - 18.8 10.8 10.9 10.3 Initial Ventilation Hours Mean .................................................. - 18.9 7.5 12.1 11.8 Median ............................................... - 8.1 5.1 5.6 5.6 Initial Ventilation <6 hours .................. - 25.0% 58.6% 54.3% 54.8% Extubated in OR .................................... - 3.1% 25.0% 2.8% 2.3% Missing .................................................. - 0.0% 0.0% 0.2% 0.2% Reintubation .......................................... - 6.3% 5.2% 3.8% 3.5% Missing .................................................. - 0.0% 0.0% 0.2% 0.2% CABG -- 19
  • 14. Isolated CABG Procedures Data Summary Participant 30863 STS Period Ending 09/30/2017 2017 is a partial year: Jan 2017 - Sept 2017 Participant 30863 Like Group STS 2015 2016 2017 2017 2017 Additional Ventilation Hours1 Mean .................................................. - 144.0 29.2 131.7 141.2 Median ............................................... - 144.0 14.5 64.0 66.2 ICU Stay Total ICU Hours Mean .................................................. - 134.8 142.3 77.9 72.3 Median ............................................... - 120.3 121.5 51.7 48.0 75th Percentile .................................... - 93.4 96.3 29.1 26.0 25th Percentile .................................... - 142.7 164.2 93.5 81.0 Initial ICU Hours Mean .................................................. - 134.8 141.1 74.8 68.9 Median ............................................... - 120.3 121.3 51.0 47.6 Readmitted to ICU ................................. - 0.0% 0.9% 2.5% 2.8% Additional ICU Hours2 Mean .................................................. - - 144.0 124.4 123.9 Median ............................................... - - 144.0 71.1 70.7 Mortality Summary In-hospital Mortality ................................... - 3.1% 0.9% 1.9% 1.7% Operative Mortality ................................... - 3.1% 1.7% 2.5% 2.3% Mortality Risk-Adjustment3 In-hospital Mortality Odds Ratio ............................................ - 1.08 0.80 1.20 1.00 Lower 95% Confidence Limit .............. - 0.43 0.39 1.06 - Upper 95% Confidence Limit .............. - 2.68 1.64 1.36 - O/E Ratio ............................................... - 1.63 0.40 1.08 1.00 Lower 95% Confidence Limit .............. - 0.09 0.02 1.02 - Upper 95% Confidence Limit .............. - 7.79 2.12 1.15 - Risk-adjusted Rate ................................ - 2.7% 0.7% 1.9% 1.7% 1 Among patients reintubated 2 Among patients readmitted to the ICU 3 Refer to the Report Overview for information on risk-adjustment methodology Risk-adjustment is not performed on time periods of less than 6 months CABG -- 20
  • 15. Isolated CABG Procedures Data Summary Participant 30863 STS Period Ending 09/30/2017 2017 is a partial year: Jan 2017 - Sept 2017 Participant 30863 Like Group STS 2015 2016 2017 2017 2017 Operative Mortality Odds Ratio ............................................ - 1.02 0.83 1.21 1.00 Lower 95% Confidence Limit .............. - 0.45 0.42 1.08 - Upper 95% Confidence Limit .............. - 2.31 1.64 1.35 - O/E Ratio ............................................... - 1.26 0.61 1.09 1.00 Lower 95% Confidence Limit .............. - 0.07 0.11 1.03 - Upper 95% Confidence Limit .............. - 6.05 2.07 1.14 - Risk-adjusted Rate ................................ - 2.7% 1.4% 2.5% 2.3% Complications Summary Any Complications .................................... - 43.8% 52.6% 38.6% 38.9% Any Major Complications / Operative Mortality ................................................. - 21.9% 12.9% 12.9% 12.0% Operative Complications Any Reoperation .................................... - 0.0% 2.6% 3.6% 3.7% Any Reoperation (NQF Definition)1 ........ - 0.0% 1.7% 2.4% 2.4% Reoperation for Bleeding ....................... - 0.0% 1.7% 1.7% 1.7% Reoperation for Valvular Dysfunction2 ... - 0.0% 0.0% 0.0% 0.0% Reoperation for Graft Occlusion2 ........... - 0.0% 0.0% 0.3% 0.3% Aortic Reintervention3 ............................ - - 0.0% 0.0% 0.0% Reoperation for Other Cardiac .............. - 0.0% 0.0% 0.4% 0.4% Reoperation for Other Non-Cardiac ....... - 0.0% 0.9% 1.4% 1.5% Infection Complications Any Infection .......................................... - 12.5% 15.5% 2.4% 2.3% Deep Sternal Infection/Mediastinitis ...... - 0.0% 0.0% 0.3% 0.3% Septicemia/Sepsis ................................. - 0.0% 1.7% 0.9% 0.9% Conduit Harvest or Cannulation Site4 .... - 12.5% 6.9% 0.5% 0.5% 1 Includes reoperations for bleeding/tamponade, valvular dysfunction, graft occlusion, and other cardiac problems. 2 Includes surgical and PCI/Transcatheter interventions 3 Variable added in 2.9 4 Excludes patients with zero vein grafts 5 Variable dropped in 2.9 CABG -- 21
  • 16. Isolated CABG Procedures Data Summary Participant 30863 STS Period Ending 09/30/2017 2017 is a partial year: Jan 2017 - Sept 2017 Participant 30863 Like Group STS 2015 2016 2017 2017 2017 Neurological Complications Any Neurological ................................... - 9.4% 12.1% 3.1% 3.0% Coma/Encephalopathy1 ......................... - 9.4% 4.3% 1.8% 1.6% Coma2 ................................................... - - 0.0% 1.3% 1.3% Encephalopathy2 ................................... - - 0.0% 0.2% 0.2% Permanent Stroke .................................. - 0.0% 0.0% 1.4% 1.4% Transient Ischemic Attack ..................... - 0.0% 0.9% 0.2% 0.2% Paralysis ................................................ - 0.0% 0.0% 0.2% 0.1% Pulmonary Complications Any Pulmonary ...................................... - 25.0% 16.4% 12.6% 12.1% Prolonged Ventilation ............................ - 18.8% 10.3% 8.2% 7.5% Pneumonia ............................................ - 9.4% 2.6% 2.7% 2.4% Pulmonary Embolism ............................. - 0.0% 0.0% 0.2% 0.2% Pleural Effusion Requiring Drainage ...... - 3.1% 4.3% 3.3% 3.6% Renal Complications Renal Failure3 ........................................ - 0.0% 0.9% 2.4% 2.1% Vascular Complications Any Vascular ......................................... - 0.0% 0.9% 0.3% 0.4% Acute Limb Ischemia ............................. - 0.0% 0.9% 0.3% 0.4% Other Complications Any Other .............................................. - 28.1% 28.4% 29.9% 30.5% New Onset Atrial Fibrillation4 ................. - 33.3% 26.4% 24.6% 25.0% Recent Recurrent Atrial Fibrillation5 ....... - 0.0% 0.0% 26.6% 26.9% Cardiac Arrest ....................................... - 3.1% 3.4% 2.1% 1.9% Anticoagulant Complication ................... - 0.0% 0.0% 0.6% 0.5% Tamponade ........................................... - 0.0% 0.0% 0.1% 0.1% Gastro-Intestinal Complication .............. - 0.0% 0.0% 2.1% 2.1% Multi-System Failure .............................. - 0.0% 0.0% 0.7% 0.6% 1 Variable dropped in 2.9 2 Variable added in 2.9 3 Excludes patients with preoperative dialysis or last creatinine >=4 4 New Onset Afib is only among patients with no history of arrhythmias 5 Recent Recurrent Afib is among patients with history of recent Afib CABG -- 22
  • 17. Isolated CABG Procedures Data Summary Participant 30863 STS Period Ending 09/30/2017 2017 is a partial year: Jan 2017 - Sept 2017 Participant 30863 Like Group STS 2015 2016 2017 2017 2017 Complications Risk-Adjustment1 Major Complications or Op. Mortality Odds Ratio ............................................ - 1.24 0.87 1.07 1.00 Lower 95% Confidence Limit .............. - 0.66 0.55 0.99 - Upper 95% Confidence Limit .............. - 2.32 1.37 1.15 - O/E Ratio ............................................... - 1.51 0.87 1.06 1.00 Lower 95% Confidence Limit .............. - 0.70 0.53 1.04 - Upper 95% Confidence Limit .............. - 2.60 1.33 1.08 - Risk-adjusted Rate ................................ - 18.3% 10.5% 12.7% 12.0% Any Reoperation Odds Ratio ............................................ - 0.82 0.86 0.90 1.00 Lower 95% Confidence Limit .............. - 0.38 0.49 0.82 - Upper 95% Confidence Limit .............. - 1.76 1.51 0.97 - O/E Ratio ............................................... - 0.00 0.63 0.97 1.00 Lower 95% Confidence Limit .............. - 0.00 0.16 0.94 - Upper 95% Confidence Limit .............. - 2.54 1.77 1.02 - Risk-adjusted Rate ................................ - 0.0% 2.3% 3.6% 3.7% Deep Sternal Infection/Mediastinitis Odds Ratio ............................................ - 0.97 0.84 0.84 1.00 Lower 95% Confidence Limit .............. - 0.26 0.22 0.66 - Upper 95% Confidence Limit .............. - 3.64 3.18 1.05 - O/E Ratio ............................................... - 0.00 0.00 0.92 1.00 Lower 95% Confidence Limit .............. - 0.00 0.00 0.82 - Upper 95% Confidence Limit .............. - 33.75 6.92 1.11 - Risk-adjusted Rate ................................ - 0.0% 0.0% 0.3% 0.3% Permanent Stroke Odds Ratio ............................................ - 0.94 0.86 0.96 1.00 Lower 95% Confidence Limit .............. - 0.43 0.48 0.86 - Upper 95% Confidence Limit .............. - 2.05 1.56 1.07 - O/E Ratio ............................................... - 0.00 0.00 1.00 1.00 Lower 95% Confidence Limit .............. - 0.00 0.00 0.94 - Upper 95% Confidence Limit .............. - 7.65 2.28 1.08 - Risk-adjusted Rate ................................ - 0.0% 0.0% 1.4% 1.4% 1 Refer to the Report Overview for information on risk-adjustment methodology Risk-adjustment is not performed on time periods of less than 6 months CABG -- 23
  • 18. Isolated CABG Procedures Data Summary Participant 30863 STS Period Ending 09/30/2017 2017 is a partial year: Jan 2017 - Sept 2017 Participant 30863 Like Group STS 2015 2016 2017 2017 2017 Renal Failure Odds Ratio ............................................ - 0.82 0.76 1.23 1.00 Lower 95% Confidence Limit .............. - 0.30 0.31 1.09 - Upper 95% Confidence Limit .............. - 2.19 1.85 1.40 - O/E Ratio ............................................... - 0.00 0.41 1.12 1.00 Lower 95% Confidence Limit .............. - 0.00 0.02 1.07 - Upper 95% Confidence Limit .............. - 4.48 2.14 1.19 - Risk-adjusted Rate ................................ - 0.0% 0.9% 2.4% 2.1% Prolonged Ventilation Odds Ratio ............................................ - 1.54 1.05 1.11 1.00 Lower 95% Confidence Limit .............. - 0.71 0.60 1.01 - Upper 95% Confidence Limit .............. - 3.33 1.82 1.23 - O/E Ratio ............................................... - 1.91 1.05 1.07 1.00 Lower 95% Confidence Limit .............. - 0.82 0.59 1.05 - Upper 95% Confidence Limit .............. - 3.47 1.69 1.11 - Risk-adjusted Rate ................................ - 15.1% 7.9% 8.1% 7.5% Discharge Location1 Home ..................................................... - 48.4% 62.6% 75.8% 78.3% Extended Care/TCU .............................. - 51.6% 33.9% 19.7% 17.7% Other Acute Care Hospital ..................... - 0.0% 0.9% 0.8% 0.6% Nursing Home ....................................... - 0.0% 2.6% 3.1% 2.7% Hospice ................................................. - 0.0% 0.0% 0.1% 0.1% Left AMA2 .............................................. - 0.0% 0.0% 0.1% 0.1% Other ..................................................... - 0.0% 0.0% 0.3% 0.3% Missing .................................................. - 0.0% 0.0% 0.2% 0.3% Discharge Medications1 Aspirin ....................................................... - 83.9% 87.0% 96.8% 97.1% Among Eligible Cases ........................... - 83.9% 90.9% 98.0% 98.3% Contraindicated / Not Indicated ............. - 0.0% 4.3% 1.3% 1.2% Missing .................................................. - 0.0% 0.0% 0.1% 0.1% ACE inhibitors ........................................... - 83.9% 52.2% 38.4% 35.4% 1 Excludes in-hospital mortalities Among Eligible Cases ........................... - 86.7% 80.0% 65.6% 61.6% 2 Option added in v2.81 Contraindicated / Not Indicated ............. - 3.2% 34.8% 41.5% 42.6% Missing .................................................. - 0.0% 0.0% 0.2% 0.2% CABG -- 24
  • 19. Isolated CABG Procedures Data Summary Participant 30863 STS Period Ending 09/30/2017 2017 is a partial year: Jan 2017 - Sept 2017 Participant 30863 Like Group STS 2015 2016 2017 2017 2017 Beta Blockers ........................................... - 90.3% 92.2% 94.1% 94.5% Among Eligible Cases ........................... - 90.3% 93.8% 98.0% 98.5% Contraindicated / Not Indicated ............. - 0.0% 1.7% 3.9% 4.0% Missing .................................................. - 0.0% 0.0% 0.1% 0.1% Statin Lipid-Lowering Agents .................... - 93.5% 81.7% 94.3% 94.4% Among Eligible Cases ........................... - 93.5% 83.9% 97.5% 97.8% Contraindicated / Not Indicated ............. - 0.0% 2.6% 3.3% 3.4% Missing .................................................. - 0.0% 0.0% 0.1% 0.1% Non-Statin Lipid-Lowering Agents ............ - 0.0% 2.6% 10.3% 10.5% Among Eligible Cases ........................... - 0.0% 2.6% 10.3% 10.6% Contraindicated / Not Indicated ............. - 3.2% 0.0% 0.5% 0.7% Missing .................................................. - 0.0% 0.0% 0.2% 0.2% ADP Inhibitors ........................................... - 12.9% 13.0% 14.4% 13.9% Among Eligible Cases ........................... - 12.9% 13.0% 14.5% 14.0% Contraindicated / Not Indicated ............. - 0.0% 0.0% 0.5% 0.8% Missing .................................................. - 0.0% 0.0% 0.2% 0.2% P2Y12 Antagonists1 .................................. - 38.7% 17.1% 30.6% 31.9% Among Eligible Cases ........................... - 38.7% 17.1% 30.8% 32.3% Contraindicated / Not Indicated ............. - 0.0% 0.0% 0.8% 1.2% Missing .................................................. - 0.0% 0.0% 0.1% 0.1% Other Antiplatelets .................................... - 0.0% 1.7% 1.4% 1.1% Among Eligible Cases ........................... - 0.0% 1.7% 1.4% 1.1% Contraindicated / Not Indicated ............. - 0.0% 0.0% 0.2% 0.6% Missing .................................................. - 0.0% 0.0% 0.2% 0.2% Amiodarone .............................................. - 35.5% 32.2% 34.7% 32.9% Among Eligible Cases ........................... - 35.5% 32.5% 34.9% 33.3% Contraindicated / Not Indicated ............. - 0.0% 0.9% 0.7% 1.0% Missing .................................................. - 0.0% 0.0% 0.2% 0.2% Coumadin ................................................. - 0.0% 0.9% 6.6% 7.2% 1 Variable dropped in v2.9 Among Eligible Cases ........................... - 0.0% 0.9% 6.6% 7.3% Contraindicated / Not Indicated ............. - 0.0% 0.0% 0.3% 0.6% Missing .................................................. - 0.0% 0.0% 0.2% 0.2% CABG -- 25
  • 20. Isolated CABG Procedures Data Summary Participant 30863 STS Period Ending 09/30/2017 2017 is a partial year: Jan 2017 - Sept 2017 Participant 30863 Like Group STS 2015 2016 2017 2017 2017 Discharge Referrals/Counseling1 Cardiac Rehabilitation Referral ................. - 93.5% 93.0% 89.5% 89.6% Missing .................................................. - 0.0% 0.0% 0.3% 0.2% Smoking Cessation Counseling ................ - 44.4% 92.9% 89.0% 90.8% Missing .................................................. - 0.0% 0.0% 0.7% 0.7% 1 Excludes in-hospital mortalities and Not Applicable Records CABG -- 26
  • 21. Isolated CABG Procedures Data Summary Participant 30863 STS Period Ending 09/30/2017 2017 is a partial year: Jan 2017 - Sept 2017 Participant 30863 Like Group STS 2015 2016 2017 2017 2017 Readmission and Reason1 Readmitted within 30 days2 ................... - 16.1% 15.7% 10.6% 10.1% Anticoagulation Complication Valvular ........................................... - 0.0% - - - Pharmacological .............................. - 0.0% 0.9% 0.1% 0.1% Arryhthmia/Heart Block ...................... - 0.0% 1.7% 0.8% 0.9% Congestive Heart Failure .................... - 0.0% 1.7% 1.2% 1.1% MI and/or Recurrent Angina ............... - 0.0% 0.0% 0.3% 0.3% Pericardial Effusion / Tamponade ...... - 0.0% 0.0% 0.2% 0.2% Pneumonia3 ........................................ - 6.5% 0.9% 0.5% 0.5% Respiratory Complications, Other3 ..... - 3.2% 1.7% 0.4% 0.3% Pleural Effusion req. Intervention3 ...... - 0.0% 0.0% 0.8% 0.8% Coronary Artery Dysfunction .............. - 0.0% 0.0% 0.1% 0.1% Valve Dysfunction ............................... - 0.0% 0.0% 0.0% 0.0% Infection - Deep Sternum ................... - 0.0% 0.0% 0.3% 0.4% Infection - Conduit Harvest Site .......... - 0.0% 0.9% 0.3% 0.2% Renal failure ....................................... - 0.0% 0.0% 0.1% 0.1% TIA / Permanent CVA ......................... - 0.0% 0.9% 0.3% 0.3% Acute Vascular Complication ............. - 0.0% 0.0% 0.1% 0.1% Subacute Endocarditis ....................... - 0.0% 0.0% 0.0% 0.0% VAD Complication .............................. - - 0.0% - - Transplant Rejection .......................... - - 0.0% 0.0% 0.0% DVT .................................................... - 0.0% 0.0% 0.1% 0.1% PE ...................................................... - 0.0% 0.0% 0.5% 0.4% Angina4 ............................................... - - 0.0% 0.3% 0.3% Aortic Complication4 ........................... - - 0.0% 0.0% 0.0% Blood Pressure4 ................................. - - 0.0% 0.3% 0.3% Chest Pain, noncardiac4 ..................... - - 0.0% 0.4% 0.3% Depression/psychiatric issue4 ............. - - 0.0% 0.0% 0.0% Electrolyte imbalance4 ........................ - - 0.0% 0.1% 0.1% Failure to Thrive4 ................................ - - 0.0% 0.0% 0.0% GI Issue4 ............................................. - - 0.0% 0.6% 0.6% Mental Status Changes4 ..................... - - 0.0% 0.1% 0.1% Pericarditis/Post Cardiotomy Syndr.4 . - - 0.0% 0.0% 0.0% Renal Insufficency4 ............................. - - 0.0% 0.0% 0.0% Sepsis4 ............................................... - - 2.2% 0.3% 0.2% 1 Excludes in-hospital mortalities Transfusion4 ....................................... - - 0.0% 0.1% 0.0% 2 Timed from discharge for v2.81 Wound, other4 .................................... - - 2.2% 0.5% 0.6% 3 Option added in v2.81 Other .................................................. - 6.5% 5.2% 3.3% 3.2% 4 Option added in v2.9 Other - Planned readmission3 ............ - 0.0% 0.0% 0.1% 0.1% Missing/Unknown .................................. - 0.0% 0.0% 3.5% 3.8% CABG -- 27
  • 22. Isolated CABG Procedures Data Summary Participant 30863 STS Period Ending 09/30/2017 2017 is a partial year: Jan 2017 - Sept 2017 Participant 30863 Like Group STS 2015 2016 2017 2017 2017 Length of Stay Summary Total Length of Stay (days) Mean ..................................................... - 8.8 9.2 9.4 9.3 Median ................................................... - 7.0 8.0 8.0 8.0 25th Percentile ....................................... - 6.0 5.5 6.0 6.0 75th Percentile ....................................... - 9.0 11.0 11.0 11.0 Post-Procedure Length of Stay (days) Mean ..................................................... - 7.1 6.8 6.9 6.9 Median ................................................... - 6.0 6.0 6.0 6.0 25th Percentile ....................................... - 5.0 4.0 5.0 5.0 75th Percentile ....................................... - 7.0 8.0 7.0 7.0 PLOS <6 days ....................................... - 31.3% 47.4% 46.2% 46.9% PLOS >14 days ..................................... - 3.1% 5.2% 5.0% 5.0% Length of Stay Risk-Adjustment1 Short stay: PLOS <6 days Odds Ratio ............................................ - 0.75 1.56 1.09 1.00 Lower 95% Confidence Limit .............. - 0.37 1.06 0.96 - Upper 95% Confidence Limit .............. - 1.51 2.29 1.24 - O/E Ratio ............................................... - 0.79 1.26 0.99 1.00 Lower 95% Confidence Limit .............. - 0.43 1.02 0.98 - Upper 95% Confidence Limit .............. - 1.21 1.48 0.99 - Risk-adjusted Rate ................................ - 37.1% 58.9% 46.4% 46.9% Long stay: PLOS >14 days Odds Ratio ............................................ - 0.87 0.88 0.88 1.00 Lower 95% Confidence Limit .............. - 0.37 0.47 0.80 - Upper 95% Confidence Limit .............. - 2.05 1.65 0.97 - O/E Ratio ............................................... - 0.56 0.76 0.99 1.00 Lower 95% Confidence Limit .............. - 0.03 0.32 0.96 - Upper 95% Confidence Limit .............. - 2.71 1.53 1.03 - Risk-adjusted Rate ................................ - 2.8% 3.8% 4.9% 5.0% 1 Refer to the Report Overview for information on risk-adjustment methodology Risk-adjustment is not performed on time periods of less than 6 months CABG -- 28
  • 23. Isolated CABG Procedures Subset: On-pump procedures Participant 30863 STS Period Ending 09/30/2017 2017 is a partial year: Jan 2017 - Sept 2017 Participant 30863 Like Group STS 2015 2016 2017 2017 2017 Number of On-Pump Procedures - 21 65 47,643 101,632 Demographics Age (years), median .............................. - 72.0 70.0 66.0 66.0 Gender, Female ..................................... - 9.5% 23.1% 24.1% 24.1% Race, Non-caucasian ............................ - 4.8% 3.1% 16.8% 17.2% Multiple Races ....................................... - 0.0% 3.1% 1.1% 0.9% Obesity (BMI 30.0+) .............................. - 38.1% 49.2% 45.1% 44.8% Comorbidities Diabetes Mellitus ................................... - 47.6% 44.6% 49.4% 49.4% Insulin-Dependent .............................. - 23.8% 26.2% 17.9% 18.2% Hypertension ......................................... - 81.0% 83.1% 89.2% 89.3% Dyslipidemia .......................................... - 81.0% 83.1% 89.4% 90.1% Current/Recent Cigarette Smoker ......... - 4.8% 23.1% 22.8% 22.1% Chronic Lung Disease, Mild+ ................. - 0.0% 27.7% 19.2% 17.8% Congestive Heart Failure ....................... - 4.8% 32.3% 17.9% 18.6% CHF / NYHA class IV1 ........................ - 0.0% 0.0% 4.3% 4.1% Peripheral Arterial Disease .................... - 0.0% 9.2% 13.6% 13.6% Cerebrovascular Disease ...................... - 9.5% 26.2% 21.5% 21.4% CVA .................................................... - 0.0% 6.2% 7.4% 7.7% Renal failure, Dialysis-Dependent ......... - 0.0% 3.1% 3.2% 3.1% Last Creatinine Preop >= 4.0 mg/dl ....... - 0.0% 1.5% 2.3% 2.5% Immunosuppressive Treatment ............. - 4.8% 0.0% 3.0% 3.2% Previous Interventions Previous Cardiac Surgery2 .................... - 0.0% 9.2% 2.1% 2.4% Previous CAB ..................................... - 0.0% 7.7% 1.5% 1.8% Previous PCI ......................................... - 9.5% 30.8% 30.4% 30.6% Status Surgery status, Emergent or Salvage .... - 28.6% 4.6% 4.7% 4.2% MI .......................................................... - 28.6% 41.5% 54.6% 54.3% <= 7 days Prior to Surgery ................. - 23.8% 23.1% 31.6% 30.2% Cardiogenic Shock ................................ - 19.0% 1.5% 1.6% 1.6% Resuscitation ......................................... - 0.0% 0.0% 0.3% 0.3% 1 NYHA Class is only collected for patients with CHF % represents proportion of cases that had both CHF and the indicated NYHA class 2 Previous cardiac surgery reflects any prior CABG, valve, or other cardiac surgery CABG On-pump procedures -- 29
  • 24. Isolated CABG Procedures Subset: On-pump procedures Participant 30863 STS Period Ending 09/30/2017 2017 is a partial year: Jan 2017 - Sept 2017 Participant 30863 Like Group STS 2015 2016 2017 2017 2017 Hemodynamics and Catheterization Triple Vessel Disease ............................ - 61.9% 78.5% 78.2% 78.1% Left Main Disease (>=50% stenosis) ..... - 38.1% 35.4% 32.5% 31.9% Ejection Fraction < 40%1 ....................... - 12.5% 25.0% 15.6% 15.5% Aortic Stenosis ...................................... - 0.0% 4.6% 3.5% 3.5% Mitral Insufficiency, Mild+ ...................... - 4.8% 33.8% 32.8% 32.8% Operative Information IABP, Preoperative ................................ - 28.6% 20.0% 7.6% 6.9% Cross-Clamp Time (min) Mean .................................................. - 75.6 - 71.1 69.2 Median ............................................... - 77.0 - 66.0 65.0 Cardiopulmonary Bypass Time (min) Mean .................................................. - 110.8 53.2 97.3 94.7 Median ............................................... - 111.0 49.0 92.0 89.0 Postoperative Information Ventilation hours, total Mean .................................................. - 36.9 11.1 17.7 17.3 Median ............................................... - 11.7 7.6 5.8 5.8 ICU hours, total Mean .................................................. - 143.7 149.6 78.9 73.3 Median ............................................... - 117.2 120.2 52.0 48.2 Mortality Summary & Risk-Adjustment2 In-hospital Mortality Observed rate ..................................... - 4.8% 0.0% 2.0% 1.8% Risk-adjusted rate .............................. - 3.2% 0.0% 1.6% 1.5% Operative Mortality Observed rate ..................................... - 4.8% 0.0% 2.6% 2.3% Risk-adjusted rate .............................. - 3.5% 0.0% 2.3% 2.1% 1 Among patients with measured EF 2 Refer to the Report Overview for information on risk-adjustment methodology Risk-adjustment is not performed on time periods of less than 6 months CABG On-pump procedures -- 30
  • 25. Isolated CABG Procedures Subset: On-pump procedures Participant 30863 STS Period Ending 09/30/2017 2017 is a partial year: Jan 2017 - Sept 2017 Participant 30863 Like Group STS 2015 2016 2017 2017 2017 Complications Summary & Risk-Adjustment1 Major Complications or Op. Mortality Observed Rate ................................... - 23.8% 13.8% 13.3% 12.3% Risk-adjusted Rate ............................. - 14.5% 8.9% 10.3% 9.7% Any Reoperation Observed Rate ................................... - 0.0% 4.6% 3.7% 3.8% Risk-adjusted Rate ............................. - 0.0% 3.5% 3.2% 3.2% Deep Sternal Infection/Mediastinitis Observed Rate ................................... - 0.0% 0.0% 0.3% 0.3% Risk-adjusted Rate ............................. - 0.0% 0.0% 0.3% 0.3% Permanent Stroke Observed Rate ................................... - 0.0% 0.0% 1.4% 1.4% Risk-adjusted Rate ............................. - 0.0% 0.0% 1.1% 1.1% Renal Failure2 Observed Rate ................................... - 0.0% 1.6% 2.5% 2.2% Risk-adjusted Rate ............................. - 0.0% 1.1% 2.0% 1.7% Prolonged Ventilation Observed Rate ................................... - 19.0% 10.8% 8.6% 7.8% Risk-adjusted Rate ............................. - 9.7% 5.7% 6.0% 5.6% Readmission3 Readmitted within 30 days4 ................... - 5.0% 18.5% 10.7% 10.1% Length of Stay Summary Total length of stay (days) Mean .................................................. - 9.6 9.3 9.4 9.4 Median ............................................... - 7.0 8.0 8.0 8.0 Post-procedure Length of Stay (days) Mean .................................................. - 8.0 7.2 7.0 7.0 1 Refer to the Report Overview for information on risk-adjustment methodology Median ............................................... - 7.0 6.0 6.0 6.0 Risk-adjustment is not performed on time periods of less than 6 months 2 Excludes patients with preoperative dialysis or last creatinine >=4 3 Excludes in-hospital mortalities 4 Timed from discharge for v2.81 CABG On-pump procedures -- 31
  • 27. Isolated CABG Procedures Subset: Off-pump procedures Participant 30863 STS Period Ending 09/30/2017 2017 is a partial year: Jan 2017 - Sept 2017 Participant 30863 Like Group STS 2015 2016 2017 2017 2017 Number of Off-Pump Procedures - 11 51 7,232 14,582 Demographics Age (years), median .............................. - 78.0 71.0 66.0 66.0 Gender, Female ..................................... - 9.1% 29.4% 26.8% 27.1% Race, Non-caucasian ............................ - 9.1% 2.0% 15.7% 18.2% Multiple Races ....................................... - 0.0% 2.0% 1.3% 1.0% Obesity (BMI 30.0+) .............................. - 54.5% 37.3% 43.5% 43.2% Comorbidities Diabetes Mellitus ................................... - 45.5% 60.8% 49.1% 49.0% Insulin-Dependent .............................. - 27.3% 45.1% 18.5% 18.6% Hypertension ......................................... - 54.5% 94.1% 90.7% 90.2% Dyslipidemia .......................................... - 54.5% 74.5% 91.1% 91.1% Current/Recent Cigarette Smoker ......... - 18.2% 19.6% 21.4% 21.4% Chronic Lung Disease, Mild+ ................. - 18.2% 35.3% 21.0% 20.0% Congestive Heart Failure ....................... - 0.0% 41.2% 16.7% 17.4% CHF / NYHA class IV1 ........................ - 0.0% 2.0% 3.5% 3.5% Peripheral Arterial Disease .................... - 9.1% 23.5% 15.3% 16.1% Cerebrovascular Disease ...................... - 27.3% 27.5% 22.8% 23.0% CVA .................................................... - 0.0% 7.8% 9.1% 9.1% Renal failure, Dialysis-Dependent ......... - 0.0% 3.9% 3.7% 3.6% Last Creatinine Preop >= 4.0 mg/dl ....... - 0.0% 2.0% 3.1% 3.1% Immunosuppressive Treatment ............. - 0.0% 0.0% 3.9% 3.7% Previous Interventions Previous Cardiac Surgery2 .................... - 0.0% 3.9% 2.6% 2.7% Previous CAB ..................................... - 0.0% 2.0% 1.7% 1.7% Previous PCI ......................................... - 27.3% 31.4% 32.6% 33.0% Status Surgery status, Emergent or Salvage .... - 9.1% 2.0% 4.1% 3.6% MI .......................................................... - 18.2% 43.1% 53.2% 51.9% <= 7 days Prior to Surgery ................. - 18.2% 23.5% 29.5% 27.0% Cardiogenic Shock ................................ - 9.1% 0.0% 1.0% 1.0% Resuscitation ......................................... - 0.0% 0.0% 0.1% 0.1% 1 NYHA Class is only collected for patients with CHF % represents proportion of cases that had both CHF and the indicated NYHA class 2 Previous cardiac surgery reflects any prior CABG, valve, or other cardiac surgery CABG Off-pump procedures -- 33
  • 28. Isolated CABG Procedures Subset: Off-pump procedures Participant 30863 STS Period Ending 09/30/2017 2017 is a partial year: Jan 2017 - Sept 2017 Participant 30863 Like Group STS 2015 2016 2017 2017 2017 Hemodynamics and Catheterization Triple Vessel Disease ............................ - 63.6% 68.6% 65.0% 63.9% Left Main Disease (>=50% stenosis) ..... - 54.5% 29.4% 30.3% 28.9% Ejection Fraction < 40%1 ....................... - 0.0% 27.7% 14.9% 14.3% Aortic Stenosis ...................................... - 0.0% 5.9% 4.0% 4.1% Mitral Insufficiency, Mild+ ...................... - 9.1% 43.1% 31.8% 31.1% Operative Information IABP, Preoperative ................................ - 0.0% 9.8% 6.1% 5.6% Cross-Clamp Time (min) Mean .................................................. -- -- -- -- -- Median ............................................... -- -- -- -- -- Cardiopulmonary Bypass Time (min) Mean .................................................. -- -- -- -- -- Median ............................................... -- -- -- -- -- Postoperative Information Ventilation hours, total Mean .................................................. - 12.4 6.3 12.7 13.2 Median ............................................... - 8.1 3.7 4.7 4.9 ICU hours, total Mean .................................................. - 117.9 133.0 71.6 65.1 Median ............................................... - 120.5 122.4 49.4 46.0 Mortality Summary & Risk-Adjustment2 In-hospital Mortality Observed rate ..................................... - 0.0% 2.0% 1.6% 1.5% Risk-adjusted rate .............................. - 0.0% 1.7% 1.6% 1.5% Operative Mortality Observed rate ..................................... - 0.0% 3.9% 2.3% 2.1% Risk-adjusted rate .............................. - 0.0% 3.3% 2.2% 2.1% 1 Among patients with measured EF 2 Refer to the Report Overview for information on risk-adjustment methodology Risk-adjustment is not performed on time periods of less than 6 months CABG Off-pump procedures -- 34
  • 29. Isolated CABG Procedures Subset: Off-pump procedures Participant 30863 STS Period Ending 09/30/2017 2017 is a partial year: Jan 2017 - Sept 2017 Participant 30863 Like Group STS 2015 2016 2017 2017 2017 Complications Summary & Risk-Adjustment1 Major Complications or Op. Mortality Observed Rate ................................... - 18.2% 11.8% 9.9% 9.4% Risk-adjusted Rate ............................. - 17.7% 9.7% 10.1% 9.8% Any Reoperation Observed Rate ................................... - 0.0% 0.0% 2.9% 3.1% Risk-adjusted Rate ............................. - 0.0% 0.0% 2.9% 3.2% Deep Sternal Infection/Mediastinitis Observed Rate ................................... - 0.0% 0.0% 0.2% 0.3% Risk-adjusted Rate ............................. - 0.0% 0.0% 0.2% 0.3% Permanent Stroke Observed Rate ................................... - 0.0% 0.0% 1.0% 1.0% Risk-adjusted Rate ............................. - 0.0% 0.0% 1.0% 1.1% Renal Failure2 Observed Rate ................................... - 0.0% 0.0% 2.0% 1.7% Risk-adjusted Rate ............................. - 0.0% 0.0% 2.0% 1.8% Prolonged Ventilation Observed Rate ................................... - 18.2% 9.8% 5.9% 5.4% Risk-adjusted Rate ............................. - 20.1% 8.1% 6.1% 5.7% Readmission3 Readmitted within 30 days4 ................... - 36.4% 12.0% 10.5% 10.0% Length of Stay Summary Total length of stay (days) Mean .................................................. - 7.4 9.1 8.8 8.6 Median ............................................... - 7.0 9.0 7.0 7.0 Post-procedure Length of Stay (days) Mean .................................................. - 5.5 6.4 6.4 6.3 1 Refer to the Report Overview for information on risk-adjustment methodology Median ............................................... - 5.0 6.0 5.0 5.0 Risk-adjustment is not performed on time periods of less than 6 months 2 Excludes patients with preoperative dialysis or last creatinine >=4 3 Excludes in-hospital mortalities 4 Timed from discharge for v2.81 CABG Off-pump procedures -- 35
  • 31. Isolated CABG Procedures Subset: First Operations Participant 30863 STS Period Ending 09/30/2017 2017 is a partial year: Jan 2017 - Sept 2017 Participant 30863 Like Group STS 2015 2016 2017 2017 2017 Number of First Operations - 32 108 53,693 113,315 Demographics Age (years), median .............................. - 72.5 70.0 66.0 66.0 Gender, Female ..................................... - 9.4% 26.9% 24.5% 24.5% Race, Non-caucasian ............................ - 6.3% 2.8% 16.8% 17.4% Multiple Races ....................................... - 0.0% 2.8% 1.2% 1.0% Obesity (BMI 30.0+) .............................. - 43.8% 44.4% 44.9% 44.6% Comorbidities Diabetes Mellitus ................................... - 46.9% 50.9% 49.3% 49.3% Insulin-Dependent .............................. - 25.0% 33.3% 18.0% 18.2% Hypertension ......................................... - 71.9% 88.9% 89.3% 89.2% Dyslipidemia .......................................... - 71.9% 79.6% 89.5% 90.0% Current/Recent Cigarette Smoker ......... - 9.4% 23.1% 22.7% 22.1% Chronic Lung Disease, Mild+ ................. - 6.3% 29.6% 19.3% 17.9% Congestive Heart Failure ....................... - 3.1% 37.0% 17.7% 18.4% CHF / NYHA class IV1 ........................ - 0.0% 0.9% 4.2% 4.1% Peripheral Arterial Disease .................... - 3.1% 15.7% 13.6% 13.7% Cerebrovascular Disease ...................... - 15.6% 25.0% 21.5% 21.4% CVA .................................................... - 0.0% 5.6% 7.6% 7.8% Renal failure, Dialysis-Dependent ......... - 0.0% 3.7% 3.2% 3.2% Last Creatinine Preop >= 4.0 mg/dl ....... - 0.0% 1.9% 2.4% 2.5% Immunosuppressive Treatment ............. - 3.1% 0.0% 3.1% 3.3% Previous Interventions Previous Cardiac Surgery2 .................... - 0.0% 0.0% 0.0% 0.0% Previous CAB ..................................... - 0.0% 0.0% 0.0% 0.0% Previous PCI ......................................... - 15.6% 26.9% 30.1% 30.1% Status Surgery status, Emergent or Salvage .... - 21.9% 2.8% 4.6% 4.1% MI .......................................................... - 25.0% 40.7% 54.3% 53.8% <= 7 days Prior to Surgery ................. - 21.9% 22.2% 31.6% 30.1% Cardiogenic Shock ................................ - 15.6% 0.9% 1.5% 1.5% Resuscitation ......................................... - 0.0% 0.0% 0.3% 0.3% 1 NYHA Class is only collected for patients with CHF % represents proportion of cases that had both CHF and the indicated NYHA class 2 Previous cardiac surgery reflects any prior CABG, valve, or other cardiac surgery CABG First Operations -- 37
  • 32. Isolated CABG Procedures Subset: First Operations Participant 30863 STS Period Ending 09/30/2017 2017 is a partial year: Jan 2017 - Sept 2017 Participant 30863 Like Group STS 2015 2016 2017 2017 2017 Hemodynamics and Catheterization Triple Vessel Disease ............................ - 62.5% 74.1% 76.4% 76.2% Left Main Disease (>=50% stenosis) ..... - 43.8% 31.5% 31.9% 31.3% Ejection Fraction < 40%1 ....................... - 8.0% 26.3% 15.4% 15.3% Aortic Stenosis ...................................... - 0.0% 5.6% 3.5% 3.5% Mitral Insufficiency, Mild+ ...................... - 6.3% 38.0% 32.6% 32.4% Operative Information IABP, Preoperative ................................ - 18.8% 14.8% 7.4% 6.7% Cross-Clamp Time (min) Mean .................................................. - 75.6 - 71.0 69.1 Median ............................................... - 77.0 - 66.0 65.0 Cardiopulmonary Bypass Time (min) Mean .................................................. - 110.8 51.5 96.9 94.3 Median ............................................... - 111.0 48.0 91.0 89.0 Postoperative Information Ventilation hours, total Mean .................................................. - 28.2 9.1 16.8 16.5 Median ............................................... - 8.7 5.3 5.7 5.6 ICU hours, total Mean .................................................. - 134.8 142.6 77.6 71.9 Median ............................................... - 120.3 121.2 51.6 48.0 Mortality Summary & Risk-Adjustment2 In-hospital Mortality Observed rate ..................................... - 3.1% 0.9% 1.8% 1.7% Risk-adjusted rate .............................. - 2.6% 0.7% 1.8% 1.6% Operative Mortality Observed rate ..................................... - 3.1% 1.9% 2.5% 2.2% Risk-adjusted rate .............................. - 2.6% 1.5% 2.4% 2.2% 1 Among patients with measured EF 2 Refer to the Report Overview for information on risk-adjustment methodology Risk-adjustment is not performed on time periods of less than 6 months CABG First Operations -- 38
  • 33. Isolated CABG Procedures Subset: First Operations Participant 30863 STS Period Ending 09/30/2017 2017 is a partial year: Jan 2017 - Sept 2017 Participant 30863 Like Group STS 2015 2016 2017 2017 2017 Complications Summary & Risk-Adjustment1 Major Complications or Op. Mortality Observed Rate ................................... - 21.9% 13.9% 12.7% 11.8% Risk-adjusted Rate ............................. - 18.0% 11.3% 12.4% 11.7% Any Reoperation Observed Rate ................................... - 0.0% 2.8% 3.5% 3.6% Risk-adjusted Rate ............................. - 0.0% 2.5% 3.5% 3.6% Deep Sternal Infection/Mediastinitis Observed Rate ................................... - 0.0% 0.0% 0.3% 0.3% Risk-adjusted Rate ............................. - 0.0% 0.0% 0.3% 0.3% Permanent Stroke Observed Rate ................................... - 0.0% 0.0% 1.4% 1.4% Risk-adjusted Rate ............................. - 0.0% 0.0% 1.4% 1.3% Renal Failure2 Observed Rate ................................... - 0.0% 1.0% 2.4% 2.1% Risk-adjusted Rate ............................. - 0.0% 1.0% 2.3% 2.1% Prolonged Ventilation Observed Rate ................................... - 18.8% 11.1% 8.1% 7.3% Risk-adjusted Rate ............................. - 14.9% 8.6% 7.9% 7.3% Readmission3 Readmitted within 30 days4 ................... - 16.1% 15.0% 10.6% 10.0% Length of Stay Summary Total length of stay (days) Mean .................................................. - 8.8 9.2 9.3 9.3 Median ............................................... - 7.0 8.0 8.0 8.0 Post-procedure Length of Stay (days) Mean .................................................. - 7.1 6.9 6.9 6.9 1 Refer to the Report Overview for information on risk-adjustment methodology Median ............................................... - 6.0 6.0 6.0 6.0 Risk-adjustment is not performed on time periods of less than 6 months 2 Excludes patients with preoperative dialysis or last creatinine >=4 3 Excludes in-hospital mortalities 4 Timed from discharge for v2.81 CABG First Operations -- 39
  • 35. Isolated CABG Procedures Subset: Reoperations Participant 30863 STS Period Ending 09/30/2017 2017 is a partial year: Jan 2017 - Sept 2017 Participant 30863 Like Group STS 2015 2016 2017 2017 2017 Number of Reoperations - - 8 1,186 2,844 Demographics Age (years), median .............................. - - 74.0 69.0 69.0 Gender, Female ..................................... - - 12.5% 23.6% 22.0% Race, Non-caucasian ............................ - - 0.0% 12.2% 13.7% Multiple Races ....................................... - - 0.0% 0.9% 0.7% Obesity (BMI 30.0+) .............................. - - 37.5% 43.8% 44.4% Comorbidities Diabetes Mellitus ................................... - - 62.5% 51.4% 49.8% Insulin-Dependent .............................. - - 50.0% 18.0% 19.8% Hypertension ......................................... - - 75.0% 94.8% 95.1% Dyslipidemia .......................................... - - 75.0% 95.3% 96.3% Current/Recent Cigarette Smoker ......... - - 0.0% 16.4% 16.6% Chronic Lung Disease, Mild+ ................. - - 50.0% 24.7% 22.8% Congestive Heart Failure ....................... - - 25.0% 18.0% 19.2% CHF / NYHA class IV1 ........................ - - 0.0% 3.3% 3.8% Peripheral Arterial Disease .................... - - 12.5% 24.5% 24.2% Cerebrovascular Disease ...................... - - 50.0% 28.7% 29.3% CVA .................................................... - - 25.0% 8.4% 9.7% Renal failure, Dialysis-Dependent ......... - - 0.0% 2.9% 2.9% Last Creatinine Preop >= 4.0 mg/dl ....... - - 0.0% 2.0% 2.4% Immunosuppressive Treatment ............. - - 0.0% 3.9% 3.7% Previous Interventions Previous Cardiac Surgery2 .................... - - 100.0% 100.0% 100.0% Previous CAB ..................................... - - 75.0% 72.3% 73.9% Previous PCI ......................................... - - 87.5% 59.0% 59.6% Status Surgery status, Emergent or Salvage .... - - 12.5% 3.8% 3.0% MI .......................................................... - - 62.5% 60.8% 61.0% <= 7 days Prior to Surgery ................. - - 37.5% 19.6% 19.3% Cardiogenic Shock ................................ - - 0.0% 2.1% 1.8% Resuscitation ......................................... - - 0.0% 0.6% 0.4% 1 NYHA Class is only collected for patients with CHF % represents proportion of cases that had both CHF and the indicated NYHA class 2 Previous cardiac surgery reflects any prior CABG, valve, or other cardiac surgery CABG Reoperations -- 41
  • 36. Isolated CABG Procedures Subset: Reoperations Participant 30863 STS Period Ending 09/30/2017 2017 is a partial year: Jan 2017 - Sept 2017 Participant 30863 Like Group STS 2015 2016 2017 2017 2017 Hemodynamics and Catheterization Triple Vessel Disease ............................ - - 75.0% 78.4% 79.5% Left Main Disease (>=50% stenosis) ..... - - 50.0% 42.5% 40.1% Ejection Fraction < 40%1 ....................... - - 25.0% 17.4% 16.4% Aortic Stenosis ...................................... - - 0.0% 5.6% 5.5% Mitral Insufficiency, Mild+ ...................... - - 37.5% 38.6% 39.3% Operative Information IABP, Preoperative ................................ - - 25.0% 6.0% 5.7% Cross-Clamp Time (min) Mean .................................................. - - - 75.5 73.2 Median ............................................... - - - 68.0 68.0 Cardiopulmonary Bypass Time (min) Mean .................................................. - - 70.5 115.7 112.4 Median ............................................... - - 68.0 108.0 104.0 Postoperative Information Ventilation hours, total Mean .................................................. - - 7.7 28.4 28.6 Median ............................................... - - 6.9 6.9 6.6 ICU hours, total Mean .................................................. - - 138.1 92.0 87.0 Median ............................................... - - 140.8 63.0 52.0 Mortality Summary & Risk-Adjustment2 In-hospital Mortality Observed rate ..................................... - - 0.0% 5.5% 4.7% Risk-adjusted rate .............................. - - 0.0% 6.9% 6.1% Operative Mortality Observed rate ..................................... - - 0.0% 6.7% 5.8% Risk-adjusted rate .............................. - - 0.0% 7.7% 6.8% 1 Among patients with measured EF 2 Refer to the Report Overview for information on risk-adjustment methodology Risk-adjustment is not performed on time periods of less than 6 months CABG Reoperations -- 42
  • 37. Isolated CABG Procedures Subset: Reoperations Participant 30863 STS Period Ending 09/30/2017 2017 is a partial year: Jan 2017 - Sept 2017 Participant 30863 Like Group STS 2015 2016 2017 2017 2017 Complications Summary & Risk-Adjustment1 Major Complications or Op. Mortality Observed Rate ................................... - - 0.0% 19.9% 19.8% Risk-adjusted Rate ............................. - - 0.0% 23.1% 22.9% Any Reoperation Observed Rate ................................... - - 0.0% 6.2% 6.9% Risk-adjusted Rate ............................. - - 0.0% 8.0% 8.9% Deep Sternal Infection/Mediastinitis Observed Rate ................................... - - 0.0% 0.5% 0.4% Risk-adjusted Rate ............................. - - 0.0% 0.5% 0.4% Permanent Stroke Observed Rate ................................... - - 0.0% 1.9% 2.1% Risk-adjusted Rate ............................. - - 0.0% 2.6% 2.8% Renal Failure2 Observed Rate ................................... - - 0.0% 4.9% 4.0% Risk-adjusted Rate ............................. - - 0.0% 5.7% 4.5% Prolonged Ventilation Observed Rate ................................... - - 0.0% 12.7% 13.4% Risk-adjusted Rate ............................. - - 0.0% 15.4% 16.2% Readmission3 Readmitted within 30 days4 ................... - - 25.0% 13.4% 12.0% Length of Stay Summary Total length of stay (days) Mean .................................................. - - 9.5 10.5 10.5 Median ............................................... - - 9.5 9.0 9.0 Post-procedure Length of Stay (days) Mean .................................................. - - 6.0 7.7 7.7 1 Refer to the Report Overview for information on risk-adjustment methodology Median ............................................... - - 5.5 6.0 6.0 Risk-adjustment is not performed on time periods of less than 6 months 2 Excludes patients with preoperative dialysis or last creatinine >=4 3 Excludes in-hospital mortalities 4 Timed from discharge for v2.81 CABG Reoperations -- 43
  • 39. Isolated Aortic Valve Replacement Procedures Data Summary Participant 30863 STS Period Ending 09/30/2017 2017 is a partial year: Jan 2017 - Sept 2017 Participant 30863 Like Group STS 2015 2016 2017 2017 2017 Number of Cases - 1 17 3,665 18,759 Demographics Age (years) Mean ..................................................... - 75.0 70.2 65.9 65.5 Median ................................................... - 75.0 75.0 68.0 67.0 25th Percentile ....................................... - 75.0 64.0 60.0 59.0 75th Percentile ....................................... - 75.0 79.0 74.0 74.0 Age >= 65 years old .............................. - 100.0% 70.6% 60.0% 59.7% Gender, Female ........................................ - 0.0% 29.4% 39.8% 36.9% Missing .................................................. - 0.0% 0.0% 0.1% 0.0% Race1 Caucasian ............................................. - 100.0% 100.0% 85.9% 86.9% Black ...................................................... - 0.0% 0.0% 6.1% 5.6% Asian ..................................................... - 0.0% 0.0% 1.4% 1.5% Native American .................................... - 0.0% 0.0% 0.6% 0.5% Native Hawaiian/Pacific Islander ........... - 0.0% 0.0% 0.4% 0.2% Other ..................................................... - 0.0% 0.0% 3.7% 3.0% Multiple Races ....................................... - 0.0% 0.0% 1.1% 0.6% Missing / Not Documented .................... - 0.0% 0.0% 2.9% 3.0% Pt. Declined to Disclose2 ....................... - 0.0% 0.0% 0.4% 0.6% Hispanic or Latino Ethnicity ...................... - 0.0% 41.2% 11.1% 7.2% Missing/ Not Documented ..................... - 0.0% 5.9% 4.0% 3.9% Body Mass Index3 Underweight (BMI < 18.5) ...................... - 0.0% 0.0% 0.9% 0.9% Normal (BMI 18.5 - 24.9) ....................... - 0.0% 23.5% 18.9% 19.0% Overweight (BMI 25.0 - 29.9) ................ - 100.0% 35.3% 31.4% 32.9% Obese I (BMI 30.0 - 34.9) ...................... - 0.0% 23.5% 26.2% 25.8% Obese II (BMI 35.0 - 39.9) ..................... - 0.0% 11.8% 13.2% 12.9% Morbid Obesity (BMI 40.0+) ................... - 0.0% 5.9% 9.2% 8.3% Missing Height ....................................... - 0.0% 0.0% 0.1% 0.2% 1 Data presented in the report represent the individual response rates for each race category Missing Weight ...................................... - 0.0% 0.0% 0.0% 0.2% shown; summing the individual non-caucasian categories will not result in the same rates as shown in the graph since non-caucasian, as defined for the graph, does not include races or ethnicities reported in combination with caucasian 2 Option added in v2.81 3 BMI = Weight(kg) / Height(m)2 AV Replace -- 45
  • 40. Isolated Aortic Valve Replacement Procedures Data Summary Participant 30863 STS Period Ending 09/30/2017 2017 is a partial year: Jan 2017 - Sept 2017 Participant 30863 Like Group STS 2015 2016 2017 2017 2017 Comorbidities Diabetes Mellitus ...................................... - 0.0% 23.5% 34.2% 30.4% Diet Control ........................................ - 0.0% 0.0% 2.2% 2.7% Oral Control ........................................ - 0.0% 17.6% 18.3% 16.2% Insulin Control .................................... - 0.0% 5.9% 9.7% 7.9% Other SQ Medication Control1 ............ - 0.0% 0.0% 0.3% 0.3% Other Control ...................................... - 0.0% 0.0% 0.2% 0.1% Missing Control ................................... - - 0.0% 1.0% 0.8% Missing .................................................. - 0.0% 0.0% 0.3% 0.4% Hypertension ............................................ - 0.0% 70.6% 81.0% 78.8% Missing .................................................. - 0.0% 5.9% 0.3% 0.3% Current/Recent Cigarette Smoker ............ - 0.0% 23.5% 16.1% 13.3% Smoker, Current Status Unknown1 ........ - 0.0% 5.9% 0.4% 0.4% Missing .................................................. - 0.0% 0.0% 0.8% 0.7% Chronic Lung Disease Mild ........................................................ - 0.0% 17.6% 10.2% 9.4% Moderate ............................................... - 0.0% 17.6% 4.6% 3.9% Severe ................................................... - 0.0% 0.0% 4.6% 3.4% Unknown Severity1 ................................ - 0.0% 29.4% 6.2% 5.6% Missing .................................................. - 0.0% 23.5% 3.1% 1.8% Congestive Heart Failure .......................... - 0.0% 64.7% 28.2% 33.8% CHF / NYHA Class I2 .......................... - 0.0% 23.5% 1.9% 3.1% CHF / NYHA Class II .......................... - 0.0% 5.9% 9.4% 13.6% CHF / NYHA Class III ......................... - 0.0% 17.6% 14.1% 17.0% CHF / NYHA Class IV ......................... - 0.0% 11.8% 5.8% 5.0% CHF / Missing Class ........................... - - 0.0% 2.2% 2.0% Missing .................................................. - 0.0% 17.6% 1.5% 1.2% Peripheral Arterial Disease ....................... - 0.0% 11.8% 7.9% 7.6% Missing .................................................. - 0.0% 0.0% 1.2% 0.5% Cerebrovascular Disease ......................... - 0.0% 23.5% 15.0% 15.2% 1 Option added in v2.81 Missing .................................................. - 0.0% 0.0% 1.2% 0.9% 2 NYHA Class is only collected for patients with CHF % represents proportion of cases that had both CHF and the indicated NYHA class Coma/Nonresponsive State ................... - 0.0% 0.0% 0.3% 0.3% Missing ............................................... - 0.0% 0.0% 0.9% 1.4% AV Replace -- 46
  • 41. Isolated Aortic Valve Replacement Procedures Data Summary Participant 30863 STS Period Ending 09/30/2017 2017 is a partial year: Jan 2017 - Sept 2017 Participant 30863 Like Group STS 2015 2016 2017 2017 2017 CVD TIA ................................................ - 0.0% 0.0% 3.9% 4.0% Missing ............................................... - 0.0% 11.8% 1.6% 1.1% Carotid Stenosis1 None ................................................... - 100.0% 82.4% 92.6% 93.0% 50-79%2 .............................................. - 0.0% 11.8% 4.5% 4.6% 80-100% ............................................. - 0.0% 0.0% 0.7% 0.6% Missing/Not Documented ................... - 0.0% 5.9% 2.3% 1.7% CVD Prior Carotid Surgery .................... - 0.0% 11.8% 1.5% 1.5% Missing ............................................... - 0.0% 0.0% 1.3% 0.9% Cerebrovascular Accident ..................... - 0.0% 5.9% 6.7% 6.9% Missing ............................................... - 0.0% 5.9% 1.3% 0.9% Renal Failure, Dialysis-Dependent ........... - 0.0% 0.0% 3.1% 2.1% Missing .................................................. - 0.0% 5.9% 0.4% 0.4% Last Creatinine Preop Mean ..................................................... - 1.0 1.0 1.1 1.1 Median ................................................... - 1.0 1.0 1.0 0.9 25th Percentile ....................................... - 1.0 0.9 0.8 0.8 75th Percentile ....................................... - 1.0 1.2 1.2 1.1 Missing .................................................. - 0.0% 0.0% 0.3% 0.4% Value >= 4.0 mg/dL ............................... - 0.0% 0.0% 1.9% 1.5% Immunosuppressive Treatment ................ - 0.0% 5.9% 3.6% 4.1% Missing .................................................. - 0.0% 0.0% 1.2% 0.8% Infectious Endocarditis .............................. - 0.0% 0.0% 6.8% 7.3% Missing .................................................. - 0.0% 0.0% 0.1% 0.3% Previous Interventions Previous Cardiac Surgery3 ....................... - 0.0% 17.6% 7.3% 10.7% First reoperation .................................... - 0.0% 17.6% 6.9% 9.8% 1 Defined as highest level of occlusion in either carotid. Previous CABG ........................................ - 0.0% 11.8% 2.2% 2.8% 2 Option added in v2.81 3 Previous cardiac surgery reflects any prior CABG, valve, or other cardiac surgery Previous Valve .......................................... - 0.0% 5.9% 5.2% 7.8% Previous AICD .......................................... - 0.0% 5.9% 1.1% 1.0% AV Replace -- 47
  • 42. Isolated Aortic Valve Replacement Procedures Data Summary Participant 30863 STS Period Ending 09/30/2017 2017 is a partial year: Jan 2017 - Sept 2017 Participant 30863 Like Group STS 2015 2016 2017 2017 2017 Previous Pacemaker ................................. - 0.0% 0.0% 2.6% 2.8% Status Surgery Status Elective .................................................. - 0.0% 58.8% 77.9% 80.7% Urgent .................................................... - 100.0% 41.2% 21.4% 18.4% Emergent ............................................... - 0.0% 0.0% 0.6% 0.7% Emergent Salvage ................................. - 0.0% 0.0% 0.1% 0.1% Missing .................................................. - 0.0% 0.0% 0.0% 0.1% MI .............................................................. - 0.0% 0.0% 10.3% 9.6% Missing .................................................. - 0.0% 23.5% 0.8% 0.6% Cardiogenic Shock At the time of surgery ............................ - 0.0% 5.9% 0.5% 0.7% Within 24 hrs of surgery1 ....................... - 0.0% 0.0% 0.2% 0.2% Missing .................................................. - 0.0% 0.0% 0.2% 0.3% Hemodynamics and Catheterization Ejection Fraction Mean ..................................................... - 60.0 54.8 57.2 57.7 Median ................................................... - 60.0 55.0 60.0 60.0 25th Percentile ....................................... - 60.0 50.0 55.0 55.0 75th Percentile ....................................... - 60.0 65.0 63.0 65.0 EF missing or not measured .................. - 0.0% 11.8% 4.3% 2.8% EF <40%2 .............................................. - 0.0% 13.3% 7.6% 7.1% Pulmonary Hypertension3 ......................... - - 70.0% 48.7% 45.5% PA mean/systolic pressure missing or not measured .................................... - 100.0% 41.2% 47.9% 46.5% Aortic Stenosis .......................................... - 100.0% 94.1% 84.2% 82.7% Missing .................................................. - 0.0% 0.0% 0.1% 0.1% Aortic Insufficiency 1 Option added in v2.81 Trivial ..................................................... - 0.0% 0.0% 11.2% 14.4% 2 Among patients with measured EF Mild ........................................................ - 0.0% 5.9% 22.8% 24.1% 3 PA systolic pressure > 35mmHg Moderate ............................................... - 0.0% 0.0% 14.1% 15.2% Severe ................................................... - 100.0% 94.1% 24.6% 21.9% Missing/Not Documented ...................... - 0.0% 0.0% 6.7% 4.9% AV Replace -- 48
  • 43. Isolated Aortic Valve Replacement Procedures Data Summary Participant 30863 STS Period Ending 09/30/2017 2017 is a partial year: Jan 2017 - Sept 2017 Participant 30863 Like Group STS 2015 2016 2017 2017 2017 Preoperative Medications Aspirin ....................................................... - 0.0% 47.1% 54.4% 49.2% Among Eligible Cases ........................... - 0.0% 47.1% 54.9% 49.7% Contraindicated / Not Indicated ............. - 0.0% 0.0% 1.0% 1.1% Missing .................................................. - 0.0% 5.9% 1.1% 0.8% Inotropics .................................................. - 0.0% 5.9% 1.0% 1.1% Missing .................................................. - 0.0% 0.0% 0.3% 0.2% Beta Blockers ........................................... - 0.0% 23.5% 64.2% 60.2% Among Eligible Cases ........................... - 0.0% 25.0% 68.1% 64.3% Contraindicated / Not Indicated ............. - 0.0% 5.9% 5.6% 6.2% Missing .................................................. - 0.0% 0.0% 0.0% 0.2% Steroids .................................................... - 0.0% 5.9% 2.4% 2.1% Among Eligible Cases ........................... - 0.0% 5.9% 2.4% 2.1% Contraindicated / Not Indicated ............. - 0.0% 0.0% 0.0% 0.0% Missing .................................................. - 0.0% 0.0% 0.5% 0.4% Nitrates IV ................................................. - 0.0% 5.9% 0.6% 0.4% Missing .................................................. - 0.0% 0.0% 0.5% 0.4% ACE Inhibitors ........................................... - 0.0% 5.9% 36.5% 33.5% Among Eligible Cases ........................... - 0.0% 6.3% 37.2% 34.0% Contraindicated / Not Indicated ............. - 0.0% 5.9% 1.8% 1.3% Missing .................................................. - 0.0% 0.0% 1.3% 0.9% Anticoagulants .......................................... - 0.0% 29.4% 13.0% 11.4% Missing .................................................. - 0.0% 0.0% 0.5% 0.4% Coumadin1 ................................................ - 0.0% 0.0% 0.7% 0.4% Missing .................................................. - 0.0% 0.0% 0.7% 0.5% Coumadin w/in 5 Days 2 ........................... - - 0.0% 0.9% 0.8% Among Eligible Cases ........................... - - 0.0% 0.9% 0.8% Contraindicated / Not Indicated ............. - - 0.0% 0.2% 0.2% 1 Variable dropped in v2.9 Missing .................................................. - - 0.0% 0.6% 0.5% 2 Variable added in v2.9 AV Replace -- 49
  • 44. Isolated Aortic Valve Replacement Procedures Data Summary Participant 30863 STS Period Ending 09/30/2017 2017 is a partial year: Jan 2017 - Sept 2017 Participant 30863 Like Group STS 2015 2016 2017 2017 2017 Lipid-Lowering agents ............................... - 0.0% 23.5% 55.4% 53.6% Among Eligible Cases ........................... - 0.0% 23.5% 56.0% 54.1% Contraindicated / Not Indicated ............. - 0.0% 0.0% 1.1% 0.9% Missing .................................................. - 0.0% 0.0% 1.1% 0.8% Glycoprotein IIb/IIIa Inhibitor ..................... - 0.0% 0.0% 0.1% 0.1% Missing .................................................. - 0.0% 0.0% 0.4% 0.3% ADP Inhibitors within 5 Days .................... - 0.0% 0.0% 1.4% 1.5% Among Eligible Cases ........................... - 0.0% 0.0% 1.4% 1.5% Contraindicated / Not Indicated ............. - 0.0% 0.0% 0.1% 0.2% Missing .................................................. - 0.0% 0.0% 0.4% 0.4% ADP Inhibitor Discontinuation1 < 1 Day ............................................... - - - 11.8% 21.2% 1 Day .................................................. - - - 19.6% 19.4% 2 Days ................................................ - - - 17.6% 10.1% 3 Days ................................................ - - - 15.7% 10.4% 4 Days ................................................ - - - 11.8% 18.8% 5 Days ................................................ - - - 19.6% 19.4% Missing .................................................. - - - 3.9% 0.7% Antiplatelets within 5 Days2 ...................... - 0.0% 0.0% 1.8% 1.4% Among Eligible Cases ........................... - 0.0% 0.0% 1.8% 1.4% Contraindicated / Not Indicated ............. - 0.0% 0.0% 0.1% 0.2% Missing .................................................. - 0.0% 0.0% 0.6% 0.5% Operative Information Blood Products Used ................................ - 100.0% 70.6% 31.1% 26.3% Number of Blood Product Units Used 1 Red Blood Cell Unit ......................... - 0.0% 5.9% 6.3% 5.9% 2 Red Blood Cell Units ....................... - 0.0% 11.8% 8.7% 6.4% 3 Red Blood Cell Units ....................... - 0.0% 11.8% 3.0% 2.0% 4+ Red Blood Cell Units ..................... - 100.0% 17.6% 2.9% 2.4% 1+ Fresh Frozen Plasma Units ........... - 0.0% 58.8% 11.7% 9.6% 1+ Cryoprecipitate Units ..................... - 100.0% 47.1% 4.8% 4.9% 1 Excludes patients not on ADP Inhibitors within 5 Days 1+ Platelet Units ................................. - 100.0% 52.9% 17.4% 15.3% 2 Variable dropped in v2.9 Missing .................................................. - 0.0% 0.0% 0.5% 0.6% AV Replace -- 50
  • 45. Isolated Aortic Valve Replacement Procedures Data Summary Participant 30863 STS Period Ending 09/30/2017 2017 is a partial year: Jan 2017 - Sept 2017 Participant 30863 Like Group STS 2015 2016 2017 2017 2017 IABP ......................................................... - 0.0% 29.4% 1.9% 1.7% Preop .................................................. - 0.0% 23.5% 0.3% 0.2% Intraop ................................................ - 0.0% 5.9% 1.3% 1.2% Postop ................................................ - 0.0% 0.0% 0.3% 0.2% Missing timing ..................................... - - 0.0% 0.0% 0.3% Missing .................................................. - 0.0% 0.0% 0.1% 0.1% Robotic Technology Assisted ................... - 0.0% 5.9% 0.1% 0.0% Missing .................................................. - 0.0% 0.0% 0.1% 0.9% Cross-Clamp Time (min) Mean ..................................................... - 89.0 75.0 80.8 74.8 Median ................................................... - 89.0 69.0 75.0 70.0 25th Percentile ....................................... - 89.0 65.0 61.0 55.0 75th Percentile ....................................... - 89.0 80.0 95.0 88.0 Cardiopulmonary Bypass Time (min) Mean ..................................................... - 114.0 117.4 108.8 100.8 Median ................................................... - 114.0 98.0 101.0 93.0 25th Percentile ....................................... - 114.0 89.0 81.0 74.0 75th Percentile ....................................... - 114.0 124.0 126.0 118.0 Circulatory Arrest ...................................... - 0.0% 0.0% 0.8% 0.4% Missing .................................................. - 0.0% 0.0% 0.2% 0.3% Circulatory Arrest Time (min) Mean ..................................................... - - - 17.8 18.0 Median ................................................... - - - 7.0 9.0 25th Percentile ....................................... - - - 3.0 1.0 75th Percentile ....................................... - - - 30.0 20.0 Skin Incision Duration (min) Mean ..................................................... - 234.0 259.4 216.5 204.2 Median ................................................... - 234.0 221.0 204.0 191.0 25th Percentile ....................................... - 234.0 200.0 170.0 157.0 75th Percentile ....................................... - 234.0 302.0 247.0 236.0 AV Replace -- 51
  • 46. Isolated Aortic Valve Replacement Procedures Data Summary Participant 30863 STS Period Ending 09/30/2017 2017 is a partial year: Jan 2017 - Sept 2017 Participant 30863 Like Group STS 2015 2016 2017 2017 2017 OR Duration (min) Mean ..................................................... - 331.0 350.2 300.5 290.1 Median ................................................... - 331.0 318.0 289.0 277.0 25th Percentile ....................................... - 331.0 290.0 246.0 234.0 75th Percentile ....................................... - 331.0 382.0 340.0 330.0 Valve Surgery Aortic Annular Enlargement ...................... - 0.0% 5.9% 4.0% 4.4% Missing .................................................. - 0.0% 0.0% 0.4% 0.9% Valve Replacement Type Mechanical ............................................ - 0.0% 5.9% 11.8% 11.3% Bioprosthetic .......................................... - 100.0% 94.1% 87.9% 88.3% Homograft .............................................. - 0.0% 0.0% 0.0% 0.1% Autograft ................................................ - - - - - Missing .................................................. - 0.0% 0.0% 0.2% 0.4% Antibiotic Selection1, 2 ............................... - 100.0% 100.0% 99.2% 99.4% Exclusions ............................................. - 0.0% 0.0% 1.8% 1.6% Missing .................................................. - 0.0% 0.0% 0.0% 0.1% Antibiotic Timing1, 3 ................................... - 100.0% 100.0% 99.1% 99.0% Exclusions ............................................. - 0.0% 0.0% 1.2% 1.1% Missing .................................................. - 0.0% 0.0% 0.0% 0.1% Antibiotics Discontinued1, 4 ........................ - 100.0% 100.0% 99.1% 99.2% Exclusions ............................................. - 0.0% 0.0% 3.0% 2.8% Missing .................................................. - 0.0% 0.0% 0.1% 0.2% Postoperative Information Blood Products Used ................................ - 100.0% 52.9% 33.1% 27.7% Number of Blood Product Units Used 1 Red Blood Cell Unit ......................... - 0.0% 11.8% 9.2% 8.7% 2 Red Blood Cell Units ....................... - 0.0% 23.5% 10.0% 7.6% 3 Red Blood Cell Units ....................... - 0.0% 0.0% 3.0% 2.8% 4+ Red Blood Cell Units ..................... - 100.0% 17.6% 6.6% 5.1% 1 All antibiotic measures are calculated among patients without exclusions 1+ Fresh Frozen Plasma Units ........... - 0.0% 11.8% 10.3% 8.2% 2 First or second generation cephalosporin prescribed/given prophylactically 1+ Cryoprecipitate Units ..................... - 100.0% 11.8% 5.1% 5.1% 3 Appropriate timing of prophylactic antibiotics 1+ Platelet Units ................................. - 0.0% 29.4% 11.1% 9.4% 4 Prophylactic antibiotics discontinued within 48 hours Missing .................................................. - 0.0% 0.0% 0.1% 0.3% AV Replace -- 52
  • 47. Isolated Aortic Valve Replacement Procedures Data Summary Participant 30863 STS Period Ending 09/30/2017 2017 is a partial year: Jan 2017 - Sept 2017 Participant 30863 Like Group STS 2015 2016 2017 2017 2017 Intraop/Postop Blood Products Used ........ - 100.0% 82.4% 48.1% 41.3% Total Number of Blood Product Units 1 Red Blood Cell Unit ......................... - 0.0% 11.8% 9.8% 9.6% 2 Red Blood Cell Units ....................... - 0.0% 5.9% 12.7% 10.0% 3 Red Blood Cell Units ....................... - 0.0% 11.8% 5.4% 4.5% 4+ Red Blood Cell Units ..................... - 100.0% 41.2% 12.0% 8.9% 1+ Fresh Frozen Plasma Units ........... - 0.0% 58.8% 19.8% 15.6% 1+ Cryoprecipitate Units ..................... - 100.0% 58.8% 9.6% 9.4% 1+ Platelet Units ................................. - 100.0% 58.8% 24.9% 21.6% Missing .................................................. - 0.0% 0.0% 0.0% 0.0% Ventilation Total Ventilation Hours Mean .................................................. - 19.5 14.1 18.4 15.4 Median ............................................... - 19.5 6.0 5.6 5.3 25th Percentile .................................... - 19.5 4.5 3.7 3.6 75th Percentile .................................... - 19.5 20.5 10.9 9.0 Initial Ventilation Hours Mean .................................................. - 19.5 13.6 12.9 11.3 Median ............................................... - 19.5 5.6 5.5 5.2 Initial Ventilation <6 hours1 ................. - 0.0% 52.9% 55.1% 59.4% Extubated in OR .................................... - 0.0% 17.6% 2.9% 2.8% Missing .................................................. - 0.0% 0.0% 0.1% 0.3% Reintubation .......................................... - 0.0% 11.8% 4.3% 3.2% Missing .................................................. - 0.0% 0.0% 0.2% 0.4% Additional Ventilation Hours2 Mean .................................................. - - 4.0 126.8 129.7 Median ............................................... - - 4.0 65.0 65.0 ICU Stay Total ICU Hours 2 Among patients reintubated Mean .................................................. - 121.9 167.3 84.9 68.0 Median ............................................... - 121.9 137.3 53.9 46.3 25th Percentile .................................... - 121.9 114.4 31.2 25.0 75th Percentile .................................... - 121.9 194.2 98.0 74.8 AV Replace -- 53