QNBFS Weekly Market Report September 6, 2018
•
0 gostou•45 visualizações

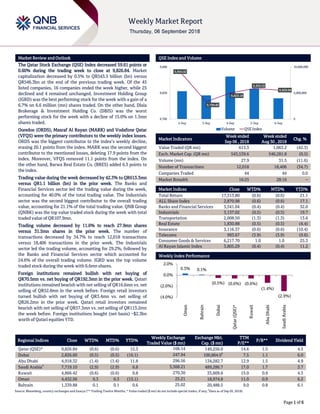
The Qatar Stock Exchange (QSE) Index decreased 59.61 points or 0.60% during the trading week to close at 9,826.84

Recomendados
Mais conteúdo relacionado
Mais procurados
Mais procurados (20)
Semelhante a QNBFS Weekly Market Report September 6, 2018
Semelhante a QNBFS Weekly Market Report September 6, 2018 (20)
Mais de QNB Group
Mais de QNB Group (20)
Último
Último (20)
QNBFS Weekly Market Report September 6, 2018
- 1. ` Page 1 of 6 Market Review and Outlook QSE Index and Volume The Qatar Stock Exchange (QSE) Index decreased 59.61 points or 0.60% during the trading week to close at 9,826.84. Market capitalization decreased by 0.5% to QR543.5 billion (bn) versus QR546.3bn at the end of the previous trading week. Of the 45 listed companies, 16 companies ended the week higher, while 25 declined and 4 remained unchanged. Investment Holding Group (IGRD) was the best performing stock for the week with a gain of a 6.7% on 6.6 million (mn) shares traded. On the other hand, Dlala Brokerage & Investment Holding Co. (DBIS) was the worst performing stock for the week with a decline of 15.0% on 1.5mn shares traded. Ooredoo (ORDS), Masraf Al Rayan (MARK) and Vodafone Qatar (VFQS) were the primary contributors to the weekly index losses. ORDS was the biggest contributor to the index’s weekly decline, erasing 20.1 points from the index. MARK was the second biggest contributor to the mentioned losses, deleting 17.9 points from the index. Moreover, VFQS removed 11.1 points from the index. On the other hand, Barwa Real Estate Co. (BRES) added 6.3 points to the index. Trading value during the week decreased by 42.3% to QR613.3mn versus QR1.1 billion (bn) in the prior week. The Banks and Financial Services sector led the trading value during the week, accounting for 40.0% of the total trading value. The Industrials sector was the second biggest contributor to the overall trading value, accounting for 21.1% of the total trading value. QNB Group (QNBK) was the top value traded stock during the week with total traded value of QR107.9mn. Trading volume decreased by 11.6% to reach 27.9mn shares versus 31.5mn shares in the prior week. The number of transactions decreased by 34.7% to reach 12,018 transactions versus 18,406 transactions in the prior week. The Industrials sector led the trading volume, accounting for 29.2%, followed by the Banks and Financial Services sector which accounted for 24.6% of the overall trading volume. IGRD was the top volume traded stock during the week with 6.6mn shares. Foreign institutions remained bullish with net buying of QR70.5mn vs. net buying of QR192.3mn in the prior week. Qatari institutions remained bearish with net selling of QR16.6mn vs. net selling of QR52.8mn in the week before. Foreign retail investors turned bullish with net buying of QR3.4mn vs. net selling of QR26.2mn in the prior week. Qatari retail investors remained bearish with net selling of QR57.3mn vs. net selling of QR113.2mn the week before. Foreign institutions bought (net basis) ~$2.3bn worth of Qatari equities YTD. Market Indicators Week ended Sep 06 , 2018 Week ended Aug 30 , 2018 Chg. % Value Traded (QR mn) 613.3 1,063.2 (42.3) Exch. Market Cap. (QR mn) 543,539.6 546,281.8 (0.5) Volume (mn) 27.9 31.5 (11.6) Number of Transactions 12,018 18,406 (34.7) Companies Traded 44 44 0.0 Market Breadth 16:25 28:16 – Market Indices Close WTD% MTD% YTD% Total Return 17,313.80 (0.6) (0.6) 21.1 ALL Share Index 2,870.98 (0.6) (0.6) 17.1 Banks and Financial Services 3,541.04 (0.4) (0.4) 32.0 Industrials 3,137.02 (0.5) (0.5) 19.7 Transportation 2,008.50 (1.3) (1.3) 13.6 Real Estate 1,830.88 (0.5) (0.5) (4.4) Insurance 3,116.37 (0.6) (0.6) (10.4) Telecoms 993.67 (3.9) (3.9) (9.6) Consumer Goods & Services 6,217.70 1.0 1.0 25.3 Al Rayan Islamic Index 3,805.29 (0.4) (0.4) 11.2 Market Indices Weekly Index Performance Regional Indices Close WTD% MTD% YTD% Weekly Exchange Traded Value ($ mn) Exchange Mkt. Cap. ($ mn) TTM P/E** P/B** Dividend Yield Qatar (QSE)* 9,826.84 (0.6) (0.6) 15.3 168.14 149,256.0 14.6 1.5 4.5 Dubai 2,826.60 (0.5) (0.5) (16.1) 247.94 100,864.0# 7.5 1.1 6.0 Abu Dhabi 4,918.32 (1.4) (1.4) 11.8 296.56 134,282.7 12.9 1.5 4.9 Saudi Arabia# 7,719.10 (2.9) (2.9) 6.8 3,368.21 489,286.7 17.0 1.7 3.7 Kuwait 4,866.42 (0.6) (0.6) 0.8 270.30 33,609.6 15.0 0.9 4.3 Oman 4,432.56 0.3 0.3 (13.1) 25.21 18,974.8 11.0 0.9 6.2 Bahrain 1,339.88 0.1 0.1 0.6 25.02 20,488.5 9.0 0.8 6.1 Source: Bloomberg, country exchanges and Zawya (** Trailing Twelve Months; * Value traded ($ mn) do not include special trades, if any; # Data as of Sep 05, 2018) 9,864.02 9,799.83 9,820.18 9,830.32 9,826.84 0 5,000,000 10,000,000 9,760 9,820 9,880 2-Sep 3-Sep 4-Sep 5-Sep 6-Sep Volume QSE Index 0.3% 0.1% (0.5%) (0.6%) (0.6%) (1.4%) (2.9%)(4.0%) (2.0%) 0.0% 2.0% Oman Bahrain Dubai Qatar(QSE)* Kuwait AbuDhabi SaudiArabia
- 2. Page 2 of 6 News Economic & Market News Moody's withdraws Ezdan Holding Group's credit rating – Ezdan Holding Group’s ‘B1’ corporate rating, as well as Ezdan Sukuk Company’s ‘B1’ senior unsecured MTN program rating and the associated senior unsecured debt instruments with ‘B1’ rating of Ezdan Sukuk Co. were all withdrawn, Moody’s Investors Service (Moody’s) stated. Moody’s stated ratings were withdrawn because it believes it has “insufficient or otherwise inadequate information to support the maintenance of the ratings.” (Bloomberg) Dlala Islamic Brokerage announces the last business day to be 6 September, 2018 – Dlala Islamic Brokerage announced that Thursday 6 September, 2018 will be the last business day, this is according to the merger of Dlala Islamic Brokerage and Dlala Brokerage and Investment Holding Company, which has been approved by QFMA. (QSE) QCB’s foreign reserves rise for fifth month in a row – Qatar Central Bank’s (QCB) July international reserves and foreign currency liquidity rose to QR165.091bn from QR164.610bn in the previous month. Foreign securities holdings grew for fifth month in row to QR39.359bn. July balance with foreign banks fell to QR48.243bn from QR53.268 in the previous month. (Bloomberg) Qatar’s central bank sells QR7.85bn of bonds, Sukuk – Qatar's central bank stated it sold QR7.85bn of conventional bonds and Sukuk. The central bank sold QR2.45bn of three-year conventional bonds and QR1.0bn of three-year Sukuk at a yield of 3.75%. It also sold QR3.2bn of five-year conventional bonds and QR1.2bn of five-year Sukuk at 4.25%. (Zawya) Qatar’s central bank sells QR1.1bn of Treasury-bills – Qatar's central bank sold QR1.1bn of Treasury bills with maturities of three, six and nine months. The bank sold QR600mn of three- month bills at a yield of 2.18%, QR300mn of six-month bills at 2.48% and QR200mn of nine-month bills at 2.73%. (Zawya) Ministry of Finance starts budget discussions – As a part of its efforts to prepare budget for 2019, which starts from January 1 and ends on December 31, the Ministry of Finance has issued directives to different Ministries and government institutions to prepare the budget. The instructions, a copy of which is with Lusail newspaper, issued by Minister of Finance HE Ali Shareef Al Emadi, include rules and guidelines for its implementation. The Ministry’s discussion with different Ministries and institutions started from September 2 and will continue until September 25. (Peninsula Qatar) ILO praises Qatar’s legislation ending exit permit system – Praising the new law pertaining to ending exit permit, the International Labour Organization (ILO) stated that the new legislation marks a ‘significant step in upholding the fundamental rights’ of migrant workers in Qatar. Under the new legislation, migrant workers in Qatar covered by the Labor Law will no longer have to obtain exit permits in order to leave the country. Emir HH Sheikh Tamim bin Hamad Al Thani issued the Law No. 13 of 2018, amending certain provisions of the Law No. 21 of 2015 regulating the entry, exit and residency of expatriates. The law has amended the article No. 7 of the law 21 of 2015. The amendment stipulates that the expatriates under the labor law have the right to leave the country temporarily or permanently without exit permit while his work contract is valid. The law stipulates that the employers have the right to submit a list of employees who require prior permit to leave the country to the Ministry of Administrative Development, Labor and Social Affairs. The request must indicate clearly the reasons and the list must not exceed 5% of the company’s employees to take approval before leaving the country, as per the nature of their works. (Peninsula Qatar) New law allows permanent residency for expats in Qatar – Emir HH Sheikh Tamim Bin Hamad Al Thani issued the Law No. 10 of 2018 on permanent residency. The law, consisting of 13 articles, is effective and is to be published in the official gazette and the Minister of Interior will issue decisions and executive regulations needed for the implementation of the law. A permanent committee called ‘Committee for Granting Permanent Residency Permit’ will be set up at the Ministry of Interior to look into the application as per the provisions of this law. According to the law, the expatriates in Qatar could obtain permanent residency permit (PRP) of Qatar under certain rules and conditions. For obtaining PRP, any expatriate in Qatar should complete 20 years in the country on a legal ordinary residency permit if he/she is born abroad and 10 years for those expatriates who are born in Qatar. The residency duration should be uninterrupted and completed prior to the date of application. Under the law, the continuation of the residency should not be interrupted by staying outside Qatar for more than 60 days in a year and in all cases the duration of stay out of the country will be deducted from the balance of the residency duration in Qatar. (Peninsula Qatar) GWCS signs joint venture deal with Shipping Investment Limited – The Gulf Warehousing Company (GWCS) has signed a joint venture agreement with Silver for Shipping Investment Limited to provide shipping, logistics, and other related services in Qatar. The agreement allows both companies to provide enhanced shipping and logistics services benefiting from each of their experiences in their individual domains. In a regulatory filing to Qatar Stock Exchange (QSE), GWCS noted that the purpose is to provide improved shipping, logistics, and other related services to liner and non-liner companies requiring them. GWCS expects the yearly revenue from this business to start from QR3mn, with the first full financial year for this service to begin in 2019. The service will improve the company’s local market, adding value to the company’s current range of services, and therefore a marginal growth is expected for the company’s overall financial position. (Peninsula Qatar) Al Meera Consumer Goods Company begins construction work for its new branch in Oman – Al Meera Consumer Goods Company in Oman announced that it is moving towards the construction of its new branch in Al-Amarat area in September 2018. The estimated cost of construction and development works of this site is approximately QR70mn. (QSE)
- 3. Page 3 of 6 Qatar Stock Exchange Top Gainers Top Decliners Source: Qatar Stock Exchange (QSE) Source: Qatar Stock Exchange (QSE) Most Active Shares by Value (QR Million) Most Active Shares by Volume (Million) Source: Qatar Stock Exchange (QSE) Source: Qatar Stock Exchange (QSE) Investor Trading Percentage to Total Value Traded Net Traded Value by Nationality (QR Million) Source: Qatar Stock Exchange (QSE) Source: Qatar Stock Exchange (QSE) 6.7% 4.3% 2.4% 2.1% 2.0% 0.0% 3.0% 6.0% 9.0% Investment Holding Group Qatar First Bank The Group Islamic Insurance Co. Qatar Fuel Company Qatar General Ins. & Reins. Co. -15.0% -4.2% -3.4% -2.6% -2.4% -18.0% -12.0% -6.0% 0.0% Dlala Brokerage & Inv. HoldingCo. Ooredoo Vodafone Qatar MannaiCorporation Qatar Industrial ManufacturingCo. 107.9 47.1 45.2 41.3 38.0 0.0 40.0 80.0 120.0 QNB Group Industries Qatar Qatar Islamic Bank Ezdan Holding Group Investment Holding Group 6.6 4.0 2.2 2.0 1.9 0.0 3.0 6.0 9.0 Investment Holding Group Ezdan Holding Group Qatar First Bank Qatar Gas Transport Co. Ltd. Vodafone Qatar 0% 20% 40% 60% 80% 100% Buy Sell 26.94% 36.27% 16.52% 19.23% 13.46% 12.91% 43.08% 31.59% Qatari Individuals Qatari Institutions Non-Qatari Individuals Non-Qatari Institutions 267 347 340 273 (74) 74 (100) - 100 200 300 400 Qatari Non-Qatari Net Investment Total Sold Total Bought
- 4. Page 4 of 6 TECHNICAL ANALYSIS OF THE QSE INDEX Source: Bloomberg The General Index closed marginally down for the week at 9,826.84 (dropped by only 0.6% on weekly basis). We mentioned in the previous report that the signs of strong recovery and momentum gave us the indication of strong weeks to come. That being said, we stress that such strength would unfold once the index breaches and sustains a breakout above the 10,000 resistance level. Our weekly support is placed at the 9,200 level. DEFINITIONS OF KEY TERMS USED IN TECHNICAL ANALYSIS RSI (Relative Strength Index) indicator – RSI is a momentum oscillator that measures the speed and change of price movements. The RSI oscillates between 0 to 100. The index is deemed to be overbought once the RSI approaches the 70 level, indicating that a correction is likely. On the other hand, if the RSI approaches 30, it is an indication that the index may be getting oversold and therefore likely to bounce back. MACD (Moving Average Convergence Divergence) indicator – The indicator consists of the MACD line and a signal line. The divergence or the convergence of the MACD line with the signal line indicates the strength in the momentum during the uptrend or downtrend, as the case may be. When the MACD crosses the signal line from below and trades above it, it gives a positive indication. The reverse is the situation for a bearish trend. Candlestick chart – A candlestick chart is a price chart that displays the high, low, open, and close for a security. The ‘body’ of the chart is portion between the open and close price, while the high and low intraday movements form the ‘shadow’. The candlestick may represent any time frame. We use a one-day candlestick chart (every candlestick represents one trading day) in our analysis. Doji candlestick pattern – A Doji candlestick is formed when a security's open and close are practically equal. The pattern indicates indecisiveness, and based on preceding price actions and future confirmation, may indicate a bullish or bearish trend reversal. Shooting Star/Inverted Hammer candlestick patterns – These candlestick patterns have a small real body (open price and close price are near to each other), and a long upper shadow (large intraday movement on the upside). The Shooting Star is a bearish reversal pattern that forms after a rally. The Inverted Hammer looks exactly like a Shooting Star, but forms after a downtrend. Inverted Hammers represent a potential bullish trend reversal.
- 5. Page 5 of 6 Source: Bloomberg Company Name Price September 06 % Change WTD % Change YTD Market Cap. QR Million TTM P/E P/B Div. Yield Qatar National Bank 178.10 0.06 41.34 164,501 12.9 2.5 3.4 Qatar Islamic Bank 139.00 (0.71) 43.30 32,845 13.9 2.3 3.6 Commercial Bank of Qatar 39.30 (0.25) 35.99 15,906 15.3 1.0 2.5 Doha Bank 25.50 (0.78) (10.53) 7,906 11.8 0.9 11.8 Al Ahli Bank 30.55 1.46 (17.73) 6,427 9.8 1.2 3.1 Qatar International Islamic Bank 56.90 1.57 4.21 8,613 10.1 1.6 7.0 Masraf Al Rayan 37.06 (1.70) (1.83) 27,795 13.4 2.3 5.4 Al Khalij Commercial Bank 11.00 (1.61) (22.54) 3,960 7.8 0.7 6.8 Qatar First Bank 5.32 4.31 (18.53) 1,064 N/A 0.9 N/A National Leasing 9.27 (1.38) (13.45) 459 28.5 0.5 5.4 Dlala Holding 12.32 (15.03) (16.19) 350 64.8 1.5 N/A Qatar & Oman Investment 6.08 0.83 (23.04) 192 45.2 0.7 8.2 Islamic Holding Group 27.02 (1.21) (27.95) 153 N/A 1.1 N/A Banking and Financial Services 270,169 Zad Holding 90.01 0.00 22.24 1,295 11.0 1.5 6.6 Qatar German Co. for Medical Devices 5.11 0.00 (20.90) 59 N/A 1.2 N/A Salam International Investment 5.12 0.99 (25.69) 585 N/A 0.4 N/A Medicare Group 66.89 (0.67) (4.24) 1,883 23.3 2.0 2.7 Qatar Cinema & Film Distribution 16.51 0.00 (33.96) 104 14.6 0.8 6.1 Qatar Fuel 144.00 2.13 41.09 14,317 13.1 2.1 5.6 Widam Food Co. 71.40 1.25 14.24 1,285 11.2 4.0 6.0 Mannai Corp. 51.10 (2.57) (14.12) 2,331 4.6 0.9 7.8 Al Meera Consumer Goods 153.52 1.30 5.95 3,070 16.6 2.3 5.5 Consumer Goods and Services 24,930 Qatar Industrial Manufacturing 40.00 (2.44) (8.47) 1,901 9.5 12.4 7.5 Qatar National Cement 56.15 (2.35) (10.73) 3,670 11.2 1.2 8.0 Industries Qatar 124.00 0.00 27.84 75,020 17.8 2.2 4.0 Qatari Investors Group 30.25 (2.42) (17.35) 3,761 15.9 1.4 2.5 Qatar Electricity and Water 190.00 (0.73) 6.74 20,900 12.9 2.2 4.1 Aamal 9.50 (1.14) 9.45 5,985 12.3 0.8 6.3 Gulf International Services 17.45 0.52 (1.41) 3,243 31.4 0.9 N/A Mesaieed Petrochemical Holding 15.65 (0.95) 24.31 19,661 15.3 1.4 4.5 Invesment Holding Group 5.72 6.72 (6.23) 475 11.1 0.5 4.4 Industrials 134,615 Qatar Insurance 36.20 (1.68) (19.96) 11,544 57.3 1.5 3.6 Doha Insurance 13.63 (1.87) (2.64) 682 15.8 0.7 5.5 Qatar General Insurance & Reinsurance 50.00 2.04 2.04 4,375 13.6 0.7 4.5 Al Khaleej Takaful Insurance 10.00 (1.19) (24.47) 255 41.5 0.5 5.0 Qatar Islamic Insurance 55.00 2.42 0.05 825 12.3 2.4 6.4 Insurance 17,682 United Development 14.10 1.44 (1.95) 4,993 9.7 0.5 8.9 Barw a Real Estate 36.39 1.06 13.72 14,160 8.9 0.8 6.9 Ezdan Real Estate 10.18 (1.64) (15.73) 27,002 27.7 0.9 N/A Mazaya Qatar Real Estate Development 6.91 0.14 (23.22) 800 25.9 0.5 N/A Real Estate 46,955 Ooredoo 70.13 (4.19) (22.72) 22,464 14.4 1.0 5.0 Vodafone Qatar 8.83 (3.39) 10.10 7,465 N/A 1.7 N/A Telecoms 29,929 Qatar Navigation (Milaha) 64.70 (1.01) 15.66 7,410 14.7 0.5 5.4 Gulf Warehousing 39.60 (1.00) (9.98) 2,321 10.3 1.4 4.3 Qatar Gas Transport (Nakilat) 17.20 (1.66) 6.83 9,529 10.8 1.5 5.8 Transportation 19,260 Qatar Exchange 543,540
- 6. Contacts Saugata Sarkar, CFA, CAIA Shahan Keushgerian Zaid al-Nafoosi , CMT, CFTe Head of Research Senior Research Analyst Senior Research Analyst Tel: (+974) 4476 6534 Tel: (+974) 4476 6509 Tel: (+974) 4476 6535 saugata.sarkar@qnbfs.com.qa shahan.keushgerian@qnbfs.com.qa zaid.alnafoosi@qnbfs.com.qa QNB Financial Services Co. W.L.L. Contact Center: (+974) 4476 6666 PO Box 24025 Doha, Qatar Disclaimer and Copyright Notice: This publication has been prepared by QNB Financial Services Co. W.L.L. (“QNBFS”) a wholly-owned subsidiary of Qatar National Bank (Q.P.S.C.). QNBFS is regulated by the Qatar Financial Markets Authority and the Qatar Exchange. Qatar National Bank (Q.P.S.C.) is regulated by the Qatar Central Bank. This publication expresses the views and opinions of QNBFS at a given time only. It is not an offer, promotion or recommendation to buy or sell securities or other investments, nor is it intended to constitute legal, tax, accounting, or financial advice. QNBFS accepts no liability whatsoever for any direct or indirect losses arising from use of this report. Any investment decision should depend on the individual circumstances of the investor and be based on specifically engaged investment advice. We therefore strongly advise potential investors to seek independent professional advice before making any investment decision. Although the information in this report has been obtained from sources that QNBFS believes to be reliable, we have not independently verified such information and it may not be accurate or complete. QNBFS does not make any representations or warranties as to the accuracy and completeness of the information it may contain, and declines any liability in that respect. For reports dealing with Technical Analysis, expressed opinions and/or recommendations may be different or contrary to the opinions/recommendations of QNBFS Fundamental Research as a result of depending solely on the historical technical data (price and volume). QNBFS reserves the right to amend the views and opinions expressed in this publication at any time. It may also express viewpoints or make investment decisions that differ significantly from, or even contradict, the views and opinions included in this report. This report may not be reproduced in whole or in part without permission from QNBFS COPYRIGHT: No part of this document may be reproduced without the explicit written permission of QNBFS. Page 6 of 6