QNBFS Weekly Market Report July 05, 2018
•
0 gostou•83 visualizações

The Qatar Stock Exchange (QSE) Index increased 235.92 points or 2.61% during the trading week to close at 9259.95 during the trading week

Recomendados
Recomendados
Mais conteúdo relacionado
Mais de QNB Group
Mais de QNB Group (20)
Último
Último (20)
QNBFS Weekly Market Report July 05, 2018
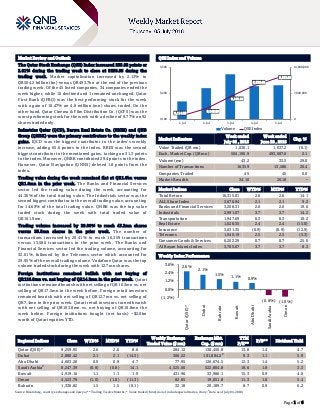
- 1. ` Page 1 of 6 Market Review and Outlook QSE Index and Volume The Qatar Stock Exchange (QSE) Index increased 235.92 points or 2.61% during the trading week to close at 9259.95 during the trading week. Market capitalization increased by 2.13% to QR504.2 billion (bn) versus QR493.7bn at the end of the previous trading week. Of the 45 listed companies, 34 companies ended the week higher, while 10 declined and 1 remained unchanged. Qatar First Bank (QFBQ) was the best performing stock for the week with a gain of 10.47% on 4.8 million (mn) shares traded. On the other hand, Qatar Cinema & Film Distribution Co. (QCFS) was the worst performing stock for the week with a decline of 9.77% on 92 shares traded only. Industries Qatar (QCD), Barwa Real Estate Co. (BRES) and QNB Group (QNBK) were the primary contributors to the weekly index gains. IQCD was the biggest contributor to the index’s weekly increase, adding 65.6 points to the index. BRES was the second biggest contributor to the mentioned gains, tacking on 31.3 points to the index. Moreover, QNBK contributed 29.4 points to the index. However, Qatar Navigation (QNNS) deleted 1.8 points from the index. Trading value during the week remained flat at QR1.0bn versus QR1.0mn in the prior week. The Banks and Financial Services sector led the trading value during the week, accounting for 44.36% of the total trading value. The Industrials sector was the second biggest contributor to the overall trading value, accounting for 14.69% of the total trading value. QNBK was the top value traded stock during the week with total traded value of QR161.9mn. Trading volume increased by 29.00% to reach 43.2mn shares versus 33.5mn shares in the prior week. The number of transactions increased by 20.41% to reach 16,359 transactions versus 13,586 transactions in the prior week. The Banks and Financial Services sector led the trading volume, accounting for 32.01%, followed by the Telecoms sector which accounted for 29.95% of the overall trading volume. Vodafone Qatar was the top volume traded stock during the week with 12.7mn shares. Foreign institutions remained bullish with net buying of QR126.8mn vs. net buying of QR14.2mn in the prior week. Qatari institutions remained bearish with net selling of QR10.3mn vs. net selling of QR17.5mn in the week before. Foreign retail investors remained bearish with net selling of QR12.7mn vs. net selling of QR7.4mn in the prior week. Qatari retail investors turned bearish with net selling of QR103.8mn vs. net buying of QR10.8mn the week before. Foreign institutions bought (net basis) ~$2.0bn worth of Qatari equities YTD. Market Indicators Week ended July 05 , 2018 Week ended June 28 , 2018 Chg. % Value Traded (QR mn) 1,036.1 1,037.2 (0.1) Exch. Market Cap. (QR mn) 504,190.9 493,687.0 2.1 Volume (mn) 43.2 33.5 29.0 Number of Transactions 16,359 13,586 20.4 Companies Traded 45 45 0.0 Market Breadth 34:10 26:18 – Market Indices Close WTD% MTD% YTD% Total Return 16,315.01 2.6 2.6 14.1 ALL Share Index 2,676.94 2.1 2.1 9.2 Banks and Financial Services 3,208.31 2.0 2.0 19.6 Industrials 2,991.07 3.7 3.7 14.2 Transportation 1,947.69 0.3 0.3 10.2 Real Estate 1,628.35 2.4 2.4 (15.0) Insurance 3,031.35 (0.9) (0.9) (12.9) Telecoms 1,040.19 2.5 2.5 (5.3) Consumer Goods & Services 6,202.29 0.7 0.7 25.0 Al Rayan Islamic Index 3,705.67 3.7 3.7 8.3 Market Indices Weekly Index Performance Regional Indices Close WTD% MTD% YTD% Weekly Exchange Traded Value ($ mn) Exchange Mkt. Cap. ($ mn) TTM P/E** P/B** Dividend Yield Qatar (QSE)* 9,259.95 2.6 2.6 8.6 284.12 138,450.8 13.8 1.4 4.7 Dubai 2,880.42 2.1 2.1 (14.5) 306.22 101,884.2# 9.3 1.1 5.9 Abu Dhabi 4,603.20 0.9 0.9 4.7 77.95 126,674.5 12.3 1.4 5.2 Saudi Arabia# 8,247.39 (0.8) (0.8) 14.1 4,525.06 522,804.8 18.6 1.8 3.3 Kuwait 4,919.16 1.1 1.1 1.9 431.96 33,986.1 15.3 0.9 4.0 Oman 4,523.79 (1.0) (1.0) (11.3) 82.05 19,051.8 11.3 1.0 5.4 Bahrain 1,330.82 1.5 1.5 (0.1) 32.18 20,189.7 8.7 0.9 6.2 Source: Bloomberg, country exchanges and Zawya (** Trailing Twelve Months; * Value traded ($ mn) do not include special trades, if any; # Data as of July 04, 2018) 9,114.23 9,142.28 9,188.16 9,230.60 9,259.95 0 7,000,000 14,000,000 9,100 9,200 9,300 1-Jul 2-Jul 3-Jul 4-Jul 5-Jul Volume QSE Index 2.6% 2.1% 1.5% 1.1% 0.9% (0.8%) (1.0%) (1.2%) 0.0% 1.2% 2.4% 3.6% Qatar(QSE)* Dubai Bahrain Kuwait AbuDhabi SaudiArabia Oman
- 2. Page 2 of 6 News Economic & Market News Qatar’s central bank sold QR800mn of Treasury bills – Qatar’s central bank sold QR800mn of Treasury bills in its monthly auction, with yields dropping from the previous sale, the bank stated. It sold QR400mn of three-month bills at 2.26%, QR200mn of six-month at 2.56% and QR200mn of nine-month at 2.79%. (Zawya) QCB: Qatari Riyal now trading close to fixed peg rate – Qatari Riyal is now trading close to its fixed peg rate, in both off-shore and on-shore forex market and confidence has been regained after the speculative attack in the offshore market since the blockade, according to Qatar Central Bank (QCB). QCB has adopted the exchange rate policy, through fixing the value of the Qatari Riyal against the US Dollar at a rate of QR3.64 per Dollar as a nominal anchor for its monetary policy. “Qatari Riyal was subject to speculative attack in the offshore market since the embargo. As per the data provided by Reuters, the exchange rate reached the highest of 3.865 in November 2017,” QCB stated in its report. (Gulf-Times.com) Qatari banks cut interconnectedness risk by distributing exposure – Major Qatari lenders appear to have distributed their exposure to many banks, thereby reducing the interconnectedness risk, according to the Qatar Central Bank. The banking sector’s interconnectedness is mostly reflected through their activities in the domestic interbank market, QCB stated and an active market reflect the depth of the development of the market, while it leads to vulnerabilities if one, or more, of the market participants exposure is high compared to others. During 2017, daily average volumes (QR2.75bn) remained more or less at the same level compared to last year. However, across the months, the volume of transactions varied. Prior to the blockade, until May 31, 2017, the daily average volume was around QR2.4bn, which increased to QR4.4bn during the period from June to August 2017. Thereafter it declined to QR1.9bn until December 31, 2017. (Gulf-Times.com) Ahli Bank to disclose its semi-annual financials on July 19 – Ahli Bank announced that it will disclose its semi-annual financial reports for the period ending June 30, 2018 on July 19, 2018. (QSE) United Development Company to disclose its semi-annual financials on July 18 – United Development Company announced that it will disclose its semi-annual financial reports for the period ending June 30, 2018 on July 18, 2018. (QSE) Widam Food Company to disclose its semi-annual financials on July 17 – Widam Food Company announced that it will disclose its semi-annual financial reports for the period ending June 30, 2018 on July 17, 2018. (QSE) Ezdan Holding Group to disclose its semi-annual financials on July 17 – Ezdan Holding Group announced that it will disclose its semi-annual financial reports for the period ending June 30, 2018 on July 17, 2018. (QSE) Ooredoo to disclose its semi-annual financials on July 29 – Ooredoo announced that it will disclose its semi-annual financial reports for the period ending June 30, 2018 on July 29, 2018. (QSE) Al Khalij Commercial Bank to disclose its semi-annual financials on July 19 – Al Khalij Commercial Bank announced that it will disclose its semi-annual financial reports for the period ending June 30, 2018 on July 19, 2018. (QSE) Alijarah Holding to disclose its semi-annual financials on July 26 – Alijarah Holding announced that it will disclose its semi- annual financial reports for the period ending June 30, 2018 on July 26, 2018. (QSE) Qatar Electricity & Water Company to disclose its semi-annual financials on July 18 – Qatar Electricity & Water Company announced that it will disclose its semi-annual financial reports for the period ending June 30, 2018 on July 18, 2018. (QSE) QIIK to disclose its semi-annual financials on July 19 – Qatar International Islamic Bank (QIIK) announced that it will disclose its semi-annual financial reports for the period ending June 30, 2018 on July 19, 2018. (QSE) QNCD to disclose its semi-annual financials on July 23 – Qatar National Cement Company (QNCD) announced that it will disclose its semi-annual financial reports for the period ending June 30, 2018 on July 23, 2018. (QSE) DBIS to disclose its semi-annual financials on July 25 – Dlala Brokerage & Investment Holding Company (DBIS) announced that it will disclose its semi-annual financial reports for the period ending June 30, 2018 on July 25, 2018. (QSE) Ahli Bank files legal suit against Investment Holding Group – Investment Holding Group announced that, Ahli Bank Qatar has filed a legal case amount of QR178,529,133.61 against Investment Holding Group and a group of defendants, all being guarantors of bank facilities for Doha Convention Center project, executed by the Joint Venture of Debbas Contracting Qatar and ETA Star Engineering and Contracting, being the ‘Sub-Contractor’; where Investment Holding Group share is 25.5%. (QSE) Barwa Al Sadd Company signs agreement for purchasing of Millennium Plaza Hotel and The Wellness Center’s 25% stake – Barwa Real Estate Company’s (BRES) subsidiary, Barwa Al Sadd Company signed an agreement for purchasing 25% of Millennium Plaza Hotel and the Wellness Center located at Barwa Al Sadd Development, from Katara Hospitality at a purchase price of QR167,214,172. The company aims from this purchase transaction to support the operating real estate portfolio of BRES in a way that contributes in realizing the sustainable growth and enhances the rights of the stakeholders. (QSE) QNCD announces provisional acceptance at its plant number five – Qatar National Cement Company (QNCD) announced that the remaining parts (kiln, crusher, raw mill and homogenizing) of plant number five has been handed over to QNCD. The designed capacity of the kiln is 5000 ton per day clinker. Accordingly the full plant has been handed over to QNCD. (QSE)
- 3. Page 3 of 6 Qatar Stock Exchange Top Gainers Top Decliners Source: Qatar Stock Exchange (QSE) Source: Qatar Stock Exchange (QSE) Most Active Shares by Value (QR Million) Most Active Shares by Volume (Million) Source: Qatar Stock Exchange (QSE) Source: Qatar Stock Exchange (QSE) Investor Trading Percentage to Total Value Traded Net Traded Value by Nationality (QR Million) Source: Qatar Stock Exchange (QSE) Source: Qatar Stock Exchange (QSE) 10.5% 9.3% 8.1% 7.0% 5.7% 0.0% 4.0% 8.0% 12.0% Qatar First Bank Medicare Group Mazaya Qatar Aamal Vodafone Qatar -9.8% -3.6% -1.6% -1.6% -1.6% -12.0% -8.0% -4.0% 0.0% QatarCinema& FilmDistribution DlalaHolding Al AhliBank MannaiCorp. QatarInsurance 161.9 161.5 116.0 75.3 53.8 0.0 60.0 120.0 180.0 QNB Group Masraf Al Rayan Vodafone Qatar Industries Qatar Qatar Gas Transport (Nakilat) 12.7 4.8 4.6 3.4 2.0 0.0 5.0 10.0 15.0 Vodafone Qatar Qatar First Bank Masraf Al Rayan Qatar Gas Transport (Nakilat) Mazaya Qatar 0% 20% 40% 60% 80% 100% Buy Sell 37.95% 47.98% 19.77% 20.77% 9.62% 10.85% 32.65% 20.41% Qatari Individuals Qatari Institutions Non-Qatari Individuals Non-Qatari Institutions 598 438 712 324 (114) 114 (200) - 200 400 600 800 Qatari Non-Qatari Net Investment Total Sold Total Bought
- 4. Page 4 of 6 TECHNICAL ANALYSIS OF THE QSE INDEX Source: Bloomberg The General Index managed to close up 2.61% from the week before. Better yet, the Index managed to sustain a close above the 9,000 level, which puts it in a strong position to reach the 9,500 level. We wait on how that challenge will unfold to determine the next direction for the Index. The major resistance levels are around the 9,500-9,600 points and the closest support is around the 8,600 level. DEFINITIONS OF KEY TERMS USED IN TECHNICAL ANALYSIS RSI (Relative Strength Index) indicator – RSI is a momentum oscillator that measures the speed and change of price movements. The RSI oscillates between 0 to 100. The index is deemed to be overbought once the RSI approaches the 70 level, indicating that a correction is likely. On the other hand, if the RSI approaches 30, it is an indication that the index may be getting oversold and therefore likely to bounce back. MACD (Moving Average Convergence Divergence) indicator – The indicator consists of the MACD line and a signal line. The divergence or the convergence of the MACD line with the signal line indicates the strength in the momentum during the uptrend or downtrend, as the case may be. When the MACD crosses the signal line from below and trades above it, it gives a positive indication. The reverse is the situation for a bearish trend. Candlestick chart – A candlestick chart is a price chart that displays the high, low, open, and close for a security. The ‘body’ of the chart is portion between the open and close price, while the high and low intraday movements form the ‘shadow’. The candlestick may represent any time frame. We use a one-day candlestick chart (every candlestick represents one trading day) in our analysis. Doji candlestick pattern – A Doji candlestick is formed when a security's open and close are practically equal. The pattern indicates indecisiveness, and based on preceding price actions and future confirmation, may indicate a bullish or bearish trend reversal. Shooting Star/Inverted Hammer candlestick patterns – These candlestick patterns have a small real body (open price and close price are near to each other), and a long upper shadow (large intraday movement on the upside). The Shooting Star is a bearish reversal pattern that forms after a rally. The Inverted Hammer looks exactly like a Shooting Star, but forms after a downtrend. Inverted Hammers represent a potential bullish trend reversal.
- 5. Page 5 of 6 Source: Bloomberg Company Name Price July 05 % Change WTD % Change YTD Market Cap. QR Million TTM P/E P/B Div. Yield Qatar National Bank 155.00 1.97 23.01 143,165 11.4 2.3 3.9 Qatar Islamic Bank 118.00 1.72 21.65 27,883 12.6 2.0 4.2 Commercial Bank of Qatar 38.77 1.79 34.15 15,691 23.1 1.0 2.6 Doha Bank 27.00 0.93 (5.26) 8,371 8.7 1.0 11.1 Al Ahli Bank 30.50 (1.61) (17.86) 6,416 9.8 1.3 3.1 Qatar International Islamic Bank 54.70 3.17 0.18 8,280 9.8 1.3 7.3 Masraf Al Rayan 35.79 2.46 (5.19) 26,843 13.1 2.3 5.6 Al Khalij Commercial Bank 10.90 1.68 (23.24) 3,924 7.8 0.8 6.9 Qatar First Bank 5.70 10.47 (12.71) 1,140 N/A 0.8 N/A National Leasing 9.54 1.49 (10.92) 472 126.5 0.5 5.2 Dlala Holding 16.00 (3.56) 8.84 455 48.7 2.0 N/A Qatar & Oman Investment 6.20 0.81 (21.52) 195 37.7 0.7 8.1 Islamic Holding Group 28.58 3.89 (23.79) 162 N/A 1.2 N/A Banking and Financial Services 242,996 Zad Holding 87.90 5.14 19.37 1,265 10.7 1.6 6.7 Qatar German Co. for Medical Devices 5.24 2.14 (18.89) 61 N/A 1.2 N/A Salam International Investment 5.28 1.34 (23.37) 604 N/A 0.4 N/A Medicare Group 68.86 9.28 (1.42) 1,938 23.4 2.1 2.6 Qatar Cinema & Film Distribution 16.26 (9.77) (34.96) 102 13.4 0.8 6.2 Qatar Fuel 146.35 (0.44) 43.40 14,551 13.4 2.2 5.5 Widam Food Co. 64.25 1.98 2.80 1,157 10.3 4.0 6.6 Mannai Corp. 48.52 (1.58) (18.45) 2,213 4.4 0.8 8.2 Al Meera Consumer Goods 151.00 (0.66) 4.21 3,020 15.3 2.4 5.6 Consumer Goods and Services 24,910 Qatar Industrial Manufacturing 40.60 (0.73) (7.09) 1,929 9.8 1.3 7.4 Qatar National Cement 57.00 3.32 (9.38) 3,725 11.2 1.3 7.9 Industries Qatar 112.50 5.14 15.98 68,063 18.6 2.1 4.4 Qatari Investors Group 31.19 4.38 (14.78) 3,878 15.3 1.5 2.4 Qatar Electricity and Water 189.00 0.55 6.18 20,790 12.5 2.3 4.1 Aamal 9.62 7.01 10.83 6,061 12.1 0.7 6.2 Gulf International Services 17.42 2.29 (1.58) 3,237 40.9 0.9 N/A Mesaieed Petrochemical Holding 15.30 1.12 21.53 19,222 15.7 1.4 4.6 Invesment Holding Group 5.46 1.87 (10.49) 453 10.6 0.5 10.1 Industrials 127,357 Qatar Insurance 34.94 (1.58) (22.74) 11,143 41.0 1.2 3.7 Doha Insurance 13.05 4.40 (6.79) 653 15.3 0.6 5.7 Qatar General Insurance & Reinsurance 49.90 0.00 1.84 4,367 13.7 0.7 4.4 Al Khaleej Takaful Insurance 11.20 (1.58) (15.41) 286 42.7 0.6 4.5 Qatar Islamic Insurance 50.55 0.06 (8.04) 758 12.2 2.4 6.9 Insurance 17,206 United Development 14.26 2.15 (0.83) 5,049 9.6 0.5 8.8 Barw a Real Estate 36.10 5.56 12.81 14,047 8.6 0.8 6.9 Ezdan Real Estate 8.23 0.37 (31.87) 21,830 25.1 0.7 N/A Mazaya Qatar Real Estate Development 7.24 8.06 (19.56) 838 51.2 0.6 N/A Real Estate 41,765 Ooredoo 73.05 0.47 (19.50) 23,399 12.5 1.0 4.8 Vodafone Qatar 9.31 5.68 16.08 7,871 N/A 1.8 N/A Telecoms 31,270 Qatar Navigation (Milaha) 64.60 (0.62) 15.48 7,398 14.9 0.5 5.4 Gulf Warehousing 42.50 2.14 (3.39) 2,491 11.2 1.6 4.0 Qatar Gas Transport (Nakilat) 15.88 0.51 (1.37) 8,798 10.1 1.5 6.3 Transportation 18,687 Qatar Exchange 504,191
- 6. Contacts Saugata Sarkar, CFA, CAIA Shahan Keushgerian Zaid al-Nafoosi , CMT, CFTe Head of Research Senior Research Analyst Senior Research Analyst Tel: (+974) 4476 6534 Tel: (+974) 4476 6509 Tel: (+974) 4476 6535 saugata.sarkar@qnbfs.com.qa shahan.keushgerian@qnbfs.com.qa zaid.alnafoosi@qnbfs.com.qa QNB Financial Services Co. W.L.L. Contact Center: (+974) 4476 6666 PO Box 24025 Doha, Qatar Disclaimer and Copyright Notice: This publication has been prepared by QNB Financial Services Co. W.L.L. (“QNBFS”) a wholly-owned subsidiary of Qatar National Bank (Q.P.S.C.). QNBFS is regulated by the Qatar Financial Markets Authority and the Qatar Exchange. Qatar National Bank (Q.P.S.C.) is regulated by the Qatar Central Bank. This publication expresses the views and opinions of QNBFS at a given time only. It is not an offer, promotion or recommendation to buy or sell securities or other investments, nor is it intended to constitute legal, tax, accounting, or financial advice. QNBFS accepts no liability whatsoever for any direct or indirect losses arising from use of this report. Any investment decision should depend on the individual circumstances of the investor and be based on specifically engaged investment advice. We therefore strongly advise potential investors to seek independent professional advice before making any investment decision. Although the information in this report has been obtained from sources that QNBFS believes to be reliable, we have not independently verified such information and it may not be accurate or complete. QNBFS does not make any representations or warranties as to the accuracy and completeness of the information it may contain, and declines any liability in that respect. For reports dealing with Technical Analysis, expressed opinions and/or recommendations may be different or contrary to the opinions/recommendations of QNBFS Fundamental Research as a result of depending solely on the historical technical data (price and volume). QNBFS reserves the right to amend the views and opinions expressed in this publication at any time. It may also express viewpoints or make investment decisions that differ significantly from, or even contradict, the views and opinions included in this report. This report may not be reproduced in whole or in part without permission from QNBFS COPYRIGHT: No part of this document may be reproduced without the explicit written permission of QNBFS. Page 6 of 6