QNBFS Daily Market Report July 08, 2018
•
1 gostou•156 visualizações

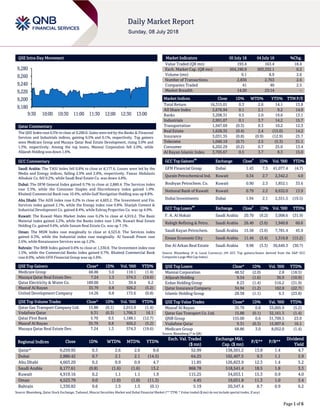
The QSE Index rose 0.3% to close at 9,260.0

Recomendados
Recomendados
Mais conteúdo relacionado
Mais procurados
Mais procurados (20)
Semelhante a QNBFS Daily Market Report July 08, 2018
Semelhante a QNBFS Daily Market Report July 08, 2018 (20)
Mais de QNB Group
Mais de QNB Group (20)
Último
Último (20)
QNBFS Daily Market Report July 08, 2018
- 1. Page 1 of 6 QSE Intra-Day Movement Qatar Commentary The QSE Index rose 0.3% to close at 9,260.0. Gains were led by the Banks & Financial Services and Industrials indices, gaining 0.5% and 0.1%, respectively. Top gainers were Medicare Group and Mazaya Qatar Real Estate Development, rising 3.0% and 1.3%, respectively. Among the top losers, Mannai Corporation fell 2.0%, while Alijarah Holding was down 1.6%. GCC Commentary Saudi Arabia: The TASI Index fell 0.8% to close at 8,177.6. Losses were led by the Media and Energy indices, falling 2.9% and 2.8%, respectively. Fawaz Abdulaziz Alhokair Co. fell 9.2%, while Saudi Real Estate Co. was down 4.8%. Dubai: The DFM General Index gained 0.7% to close at 2,880.4. The Services index rose 3.3%, while the Consumer Staples and Discretionary index gained 1.9%. Khaleeji Commercial Bank rose 10.4%, while Gulf Navigation Holding was up 8.8%. Abu Dhabi: The ADX index rose 0.2% to close at 4,603.2. The Investment and Fin. Services index gained 2.1%, while the Energy index rose 0.8%. Sharjah Cement & Industrial Development Co. gained 8.4%, while Eshraq Properties Co. was up 4.9%. Kuwait: The Kuwait Main Market Index rose 0.2% to close at 4,919.2. The Basic Material index gained 2.2%, while the Banks index rose 1.0%. Kuwait Real Estate Holding Co. gained 9.6%, while Sanam Real Estate Co. was up 7.1%. Oman: The MSM Index rose marginally to close at 4,523.8. The Services index gained 0.3%, while the Industrial index rose marginally. Al Suwadi Power rose 2.6%, while Renaissance Services was up 2.2%. Bahrain: The BHB Index gained 0.6% to close at 1,330.8. The Investment index rose 1.5%, while the Commercial Banks index gained 0.7%. Khaleeji Commercial Bank rose 8.0%, while GFH Financial Group was up 5.6%. QSE Top Gainers Close* 1D% Vol. ‘000 YTD% Medicare Group 68.86 3.0 118.1 (1.4) Mazaya Qatar Real Estate Dev. 7.24 1.3 574.3 (19.6) Qatar Electricity & Water Co. 189.00 1.1 39.4 6.2 Masraf Al Rayan 35.79 0.8 926.2 (5.2) United Development Company 14.26 0.8 172.6 (0.8) QSE Top Volume Trades Close* 1D% Vol. ‘000 YTD% Qatar Gas Transport Company Ltd. 15.88 (0.1) 2,015.9 (1.4) Vodafone Qatar 9.31 (0.3) 1,706.3 16.1 Qatar First Bank 5.70 0.5 1,188.1 (12.7) Masraf Al Rayan 35.79 0.8 926.2 (5.2) Mazaya Qatar Real Estate Dev. 7.24 1.3 574.3 (19.6) Market Indicators 05 July 18 04 July 18 %Chg. Value Traded (QR mn) 193.4 163.4 18.4 Exch. Market Cap. (QR mn) 504,190.9 503,332.1 0.2 Volume (mn) 9.1 8.9 2.6 Number of Transactions 2,836 2,763 2.6 Companies Traded 41 40 2.5 Market Breadth 14:20 23:14 – Market Indices Close 1D% WTD% YTD% TTM P/E Total Return 16,315.01 0.3 2.6 14.1 13.8 All Share Index 2,676.94 0.1 2.1 9.2 14.0 Banks 3,208.31 0.5 2.0 19.6 13.1 Industrials 2,991.07 0.1 3.7 14.2 15.7 Transportation 1,947.69 (0.3) 0.3 10.2 12.3 Real Estate 1,628.35 (0.4) 2.4 (15.0) 14.2 Insurance 3,031.35 (0.8) (0.9) (12.9) 25.7 Telecoms 1,040.19 (0.7) 2.5 (5.3) 31.1 Consumer 6,202.29 (0.2) 0.7 25.0 13.4 Al Rayan Islamic Index 3,705.67 0.5 3.7 8.3 15.0 GCC Top Gainers ## Exchange Close # 1D% Vol. ‘000 YTD% GFH Financial Group Dubai 1.43 7.5 41,077.4 (4.7) Qurain Petrochemical Ind. Kuwait 0.34 2.7 2,342.2 4.0 Boubyan Petrochem. Co. Kuwait 0.90 2.3 1,852.1 33.6 National Bank of Kuwait Kuwait 0.79 2.2 8,632.0 13.9 Dubai Investments Dubai 1.94 2.1 2,551.5 (19.5) GCC Top Losers ## Exchange Close # 1D% Vol. ‘000 YTD% F. A. Al Hokair Saudi Arabia 20.70 (9.2) 3,008.6 (31.9) Rabigh Refining & Petro. Saudi Arabia 26.40 (3.6) 1,940.8 60.6 Saudi Kayan Petrochem. Saudi Arabia 15.58 (3.6) 7,781.4 45.9 Emaar Economic City Saudi Arabia 11.44 (3.4) 1,316.8 (15.2) Dar Al Arkan Real Estate Saudi Arabia 9.98 (3.3) 36,649.3 (30.7) Source: Bloomberg (# in Local Currency) (## GCC Top gainers/losers derived from the S&P GCC Composite Large Mid Cap Index) QSE Top Losers Close* 1D% Vol. ‘000 YTD% Mannai Corporation 48.52 (2.0) 2.8 (18.5) Alijarah Holding 9.54 (1.6) 36.9 (10.9) Ezdan Holding Group 8.23 (1.4) 516.2 (31.9) Qatar Insurance Company 34.94 (1.2) 182.8 (22.7) Islamic Holding Group 28.58 (1.1) 6.3 (23.8) QSE Top Value Trades Close* 1D% Val. ‘000 YTD% Masraf Al Rayan 35.79 0.8 33,005.9 (5.2) Qatar Gas Transport Co. Ltd. 15.88 (0.1) 32,161.3 (1.4) QNB Group 155.00 0.6 31,709.5 23.0 Vodafone Qatar 9.31 (0.3) 15,907.6 16.1 Medicare Group 68.86 3.0 8,052.0 (1.4) Source: Bloomberg (* in QR) Regional Indices Close 1D% WTD% MTD% YTD% Exch. Val. Traded ($ mn) Exchange Mkt. Cap. ($ mn) P/E** P/B** Dividend Yield Qatar* 9,259.95 0.3 2.6 2.6 8.6 52.99 138,501.2 13.8 1.4 4.7 Dubai 2,880.42 0.7 2.1 2.1 (14.5) 64.25 102,407.5 9.3 1.1 5.9 Abu Dhabi 4,603.20 0.2 0.9 0.9 4.7 11.85 126,823.9 12.3 1.4 5.2 Saudi Arabia 8,177.61 (0.8) (1.6) (1.6) 13.2 868.78 518,541.4 18.5 1.8 3.3 Kuwait 4,919.16 0.2 1.1 1.1 1.9 115.25 34,053.1 15.3 0.9 4.0 Oman 4,523.79 0.0 (1.0) (1.0) (11.3) 4.45 19,051.8 11.3 1.0 5.4 Bahrain 1,330.82 0.6 1.5 1.5 (0.1) 5.19 20,347.4 8.7 0.9 6.2 Source: Bloomberg, Qatar Stock Exchange, Tadawul, Muscat Securities Market and Dubai Financial Market (** TTM; * Value traded ($ mn) do not include special trades, if any) 9,180 9,200 9,220 9,240 9,260 9,280 9:30 10:00 10:30 11:00 11:30 12:00 12:30 13:00
- 2. Page 2 of 6 Qatar Market Commentary The QSE Index rose 0.3% to close at 9,260.0. The Banks & Financial Services and Industrials indices led the gains. The index rose on the back of buying support from GCC and non-Qatari shareholders despite selling pressure from Qatari shareholders. Medicare Group and Mazaya Qatar Real Estate Development were the top gainers, rising 3.0% and 1.3%, respectively. Among the top losers, Mannai Corporation fell 2.0%, while Alijarah Holding was down 1.6%. Volume of shares traded on Thursday rose by 2.6% to 9.1mn from 8.9mn on Wednesday. However, as compared to the 30-day moving average of 11.4mn, volume for the day was 20.3% lower. Qatar Gas Transport Company Limited and Vodafone Qatar were the most active stocks, contributing 22.1% and 18.7% to the total volume, respectively. Source: Qatar Stock Exchange (* as a % of traded value) Ratings, Global Economic Data and Earnings Calendar Ratings Updates Company Agency Market Type* Old Rating New Rating Rating Change Outlook Outlook Change GFH Financial Group Fitch Bahrain – – – – Stable – Bahrain Kuwait Insurance Co. A.M. Best Bahrain LT-Credit Outlook/ Financial Strength Outlook – – – Stable – Source: News reports (* LT – Long Term, ST – Short Term, FSR- Financial Strength Rating, FCR – Foreign Currency Rating, LCR – Local Currency Rating, IDR – Issuer Default Rating, SR – Support Rating) Global Economic Data Date Market Source Indicator Period Actual Consensus Previous 07/05 US Department of Labor Initial Jobless Claims 30-June 231k 225k 228k 07/05 US Department of Labor Continuing Claims 23-June 1,739k 1,718k 1,707k 07/05 US Markit Markit US Services PMI June 56.5 56.5 56.5 07/05 US Markit Markit US Composite PMI June 56.2 – 56.0 07/06 US US Census Bureau Trade Balance May -$43.1bn -$43.6bn -$46.1bn 07/05 EU Markit Markit Eurozone Retail PMI June 51.8 – 51.7 07/05 Germany Markit Markit Germany Construction PMI June 53.0 – 53.9 07/05 Germany Markit Markit Germany Retail PMI June 57.1 – 55.5 07/05 France Markit Markit France Retail PMI June 48.1 – 50.7 07/06 France Ministry of the Economy, France Trade Balance May -6,005mn -5,050mn -5,210mn 07/06 France Banque De France Current Account Balance May -2.9bn – -1.3bn Source: Bloomberg (s.a. = seasonally adjusted; n.s.a. = non-seasonally adjusted; w.d.a. = working day adjusted) Earnings Calendar Tickers Company Name Date of reporting 2Q2018 results No. of days remaining Status QNBK QNB Group 11-Jul-18 3 Due QGTS Qatar Gas Transport Company Limited (Nakilat) 11-Jul-18 3 Due QIBK Qatar Islamic Bank 15-Jul-18 7 Due MARK Masraf Al Rayan 16-Jul-18 8 Due WDAM Widam Food Company 17-Jul-18 9 Due ERES Ezdan Holding Group 17-Jul-18 9 Due QEWS Qatar Electricity & Water Company 18-Jul-18 10 Due UDCD United Development Company 18-Jul-18 10 Due CBQK The Commercial Bank 18-Jul-18 10 Due GWCS Gulf Warehousing Company 19-Jul-18 11 Due QIIK Qatar International Islamic Bank 19-Jul-18 11 Due IHGS Islamic Holding Group 19-Jul-18 11 Due KCBK Al Khalij Commercial Bank 19-Jul-18 11 Due ABQK Ahli Bank 19-Jul-18 11 Due DHBK Doha Bank 19-Jul-18 11 Due Overall Activity Buy %* Sell %* Net (QR) Qatari Individuals 43.69% 53.47% (18,926,891.73) Qatari Institutions 14.03% 23.54% (18,392,945.39) Qatari 57.72% 77.01% (37,319,837.12) GCC Individuals 1.04% 0.38% 1,274,646.20 GCC Institutions 1.80% 0.32% 2,869,457.86 GCC 2.84% 0.70% 4,144,104.06 Non-Qatari Individuals 9.45% 9.53% (161,067.32) Non-Qatari Institutions 29.99% 12.76% 33,336,800.38 Non-Qatari 39.44% 22.29% 33,175,733.06
- 3. Page 3 of 6 QNCD Qatar National Cement Company 23-Jul-18 15 Due BRES Barwa Real Estate Company 24-Jul-18 16 Due DBIS Dlala Brokerage & Investment Holding Company 25-Jul-18 17 Due QIMD Qatar Industrial Manufacturing Company 26-Jul-18 18 Due NLCS Alijarah Holding 26-Jul-18 18 Due ORDS Ooredoo 29-Jul-18 21 Due QISI Qatar Islamic Insurance Company 30-Jul-18 22 Due DOHI Doha Insurance Group 31-Jul-18 23 Due AKHI Al Khaleej Takaful Insurance Company 3-Aug-18 26 Due Source: QSE News Qatar BRES to disclose its semi-annual financials on July 24 – Barwa Real Estate Group (BRES) announced that it will disclose its semi-annual financial reports for the period ending June 30, 2018 on July 24, 2018. (QSE) Doha Bank’s CEO: Green economy is an enabler for sustainable growth – The Public-private partnership (PPP) funding models can potentially address the challenges posed by climate change in sectors like housing, communication, infrastructure, health, agriculture, livelihood, water, and sanitation, Doha Bank’s CEO R Seetharaman said. Delivering a special address at the just- concluded 20th World Congress on Environment Management and Climate Change, organized by Institute of Directors (IOD), in New Delhi, India, R Seetharaman said “G20 countries which account for 85% of global GDP and 80% of CO2 emissions should adopt a combination of pro-growth and pro-environment policies in developing their overall growth and development strategies. Infrastructure is at the heart of economic growth and yet there has been chronic underinvestment in most G20 countries. The major green carbon emitters are China, US, EU and India. Global Green Bond issuances exceeded $155.5bn in 2017 with US, China and France leading the issuances.” (Peninsula Qatar) Ezdan Holding Group to hold its EGM on July 23 – Ezdan Holding Group to hold its Extraordinary Meeting (EGM) on July 23, 2018, in case of lack of quorum a second date will be on August 15, 2018. (Peninsula Qatar) Qatar-Pakistan trade jumps 104% to QR5.83bn – The bilateral trade volume between Qatar and Pakistan witnessed a remarkable tripled digit-growth in 2017 compared to 2016. The two-way trade exchange between the two friendly nations jumped by 104% to about QR5.83bn in 2017 from QR2.84bn in 2016. The bilateral trade volume is set to witness further jump in the coming years as both the countries are working in close cooperation to further strengthen and deep economic cooperation in several promising areas. (Peninsula Qatar) MEC: 1,043 new firms registered in June – The Ministry of Economy and Commerce (MEC) issued the business process report for June 2018, pointing that 1,043 new companies have been registered. According to the report, the number of new major business records reached 791, while the number of new sub-registries reached 252 records. Limited liability companies accounted for 64% of the major business registers, while the category of single owner limited liability companies came in second place with 25%, and the individual institution came in third place with 10%. (Peninsula Qatar) Deputy Emir launches mega reservoir project in Al Thumama – Deputy Emir HH Sheikh Abdullah Bin Hamad Al Thani launched the first phase of water pumping in the strategic mega reservoir project in Al Thumama. The Deputy Amir took a tour in the pumping station and received a briefing on the operating mechanism and the modern techniques used in the project. (Peninsula Qatar) Hamad Port received 803 ships in six months – Showing a robust half yearly performance, Hamad Port received 803 ships in the first six months of the current year. It was performance driven time for the $7.4bn port as it achieved many significant milestones during the first six months of the year. (Peninsula Qatar) International US services sector activity picks up; jobless claims rise – US services sector activity picked up in June amid strong growth in new orders, but trade tariffs and a shortage of workers were starting to strain the supply chain, which could slow momentum in the coming months. While other data showed private payrolls rising less than expected last month and a surprise increase in new applications for unemployment benefits last week, overall labor market conditions continue to tighten. The labor market is considered to be near or at full employment, with the jobless rate at an 18-year low of 3.8%. The unemployment rate has dropped by three-tenths of a percentage point this year and is near the Federal Reserve’s forecast of 3.6% by the end of this year. The Institute for Supply Management (ISM) stated its non-manufacturing activity index rose 0.5 point to 59.1 last month. A reading above 50 indicates expansion in the sector, which accounts for more than two-thirds of US economic activity. (Reuters) UK’s productivity problem resurfaces in early 2018 – British productivity contracted at the fastest pace in a year in early 2018, reversing some of the gains made last year and highlighting a long-standing problem in Britain’s economy, official data showed. There were also signs of the kind of inflation pressure that the Bank of England (BoE) is expected to douse by raising interest rates. Productivity in Britain has stagnated since the global financial crisis, even more than in most other advanced economies, and has played a key role in squeezing Britons’ living standards. Over the past 10 years, productivity growth was the weakest since modern records began and appears to be the slowest since the early 1820s, when Britain was emerging from the Napoleonic wars. From January through March, output per hour worked fell by 0.4% QoQ, the biggest decline in a year, following a 0.6% rise in late
- 4. Page 4 of 6 2017, the Office for National Statistics (ONS) noted. Some of the weakness might reflect a broad economic slowdown during snowy and icy weather in early 2018, but analysts said they saw the same old picture emerging from recent data. (Reuters) BoE’s Carney boosts expectations for August rate hike – BoE’s Governor, Mark Carney boosted expectations of an interest rate hike next month, saying he had become increasingly confident that the British economy’s weak start to the year mostly reflected bad weather. Sterling hit a day’s high against the Dollar after Carney said inflation pressures had continued to firm, as the BoE expected, and that there was widespread evidence that slack in the economy had been largely used up. Carney also warned of the potential costs of a trade war in a speech delivered a week before US President Donald Trump is due to visit Britain. Last month investors were surprised when three out of nine BoE rate-setters, more than expected, voted for an immediate rise in rates, increasing the chances of a hike in August. (Reuters) France’s trade deficit widened in May, with the figures worse than forecast – France’s trade deficit widened in May compared to the previous month, according to seasonally adjusted data published by the customs office, with the figures coming in worse-than-forecast. The May trade deficit stood at 6.01bn Euros, versus a revised figure of a 5.21bn Euros deficit in April. A Reuters poll of nine analysts had given an average forecast for a May deficit of 5.1bn Euros. The French economy has started to show signs of a slowdown after initially recovering in the wake of President Emmanuel Macron’s election in May 2017, and the customs office said that lower exports in the aerospace and automobile sectors had impacted the overall deficit figure. (Reuters) Japan unveils bullish GDP growth estimates for FY2019 – Japan’s government forecast the economy will grow faster than private-sector projections in fiscal 2019, with exports, domestic private consumption and capital spending expected to offset the hit from a planned sales tax hike. The Cabinet Office’s projections, presented at the Council on Economic and Fiscal Policy - the government’s top economic panel, showed the economy was likely to grow 1.5% in price-adjusted real terms in the fiscal year starting in April 2019. It is expected to expand 2.8% in nominal terms. Market economists see the economy growing just 0.8% in real terms and 1.8% in nominal terms, reflecting the impact of a planned sales tax increase in October 2019. (Reuters) Official think tank: China’s 2H2018 GDP growth seen easing to around 6.6% – China’s broad economic growth was expected to ease to around 6.6% in the second half of this year, the State Information Center stated. The official China Securities Journal quoted the State Information Center (SIC) saying the Chinese economy is likely to experience a mild slowdown in the second half of the year as financial market risks become “obvious” and demand is expected to decline. The SIC is an official think tank affiliated with the National Development and Reform Commission, the country’s top economic planning agency. The economy has already felt the pinch from a crackdown on riskier lending that has driven up corporate borrowing costs. The central bank has since pumped more cash into the economy to ease fears from the start of a trade war with the US by cutting reserve requirements for banks. (Reuters) Regional Middle East’s air passenger demand growth slips in May – Middle East carriers’ demand growth slowed to 0.8% in May, compared to a year ago, from 2.9% annual growth recorded in April. The earlier timing of the holy month of Ramadan this year may have affected the result, but broadly, the upward trend in traffic slowed compared to last year. May capacity increased 3.7%, and load factor fell 1.9 percentage points to 67.5%. The International Air Transport Association’s (IATA) global passenger traffic results for May showed that demand rose 6.1% compared to the same month in 2017, which was a slight pickup from 6.0% YoY growth for April 2018. Capacity climbed 5.9% and load factor rose 0.1 percentage point to 80.1%. (Peninsula Qatar) Saudi Arabia’s total reserve assets fell to SR1,892.2bn in May – Saudi Arabian Monetary Authority reported that total reserve assets fell to SR1,892.2bn in May from SR1,899.6bn in April. Investment in foreign securities fell to SR1,203.3bn from SR1,220.4bn in April. FX and deposits abroad rose to SR651.7bn in May from SR641.5bn in April. (Bloomberg) Saudi Arabia’s oil output rose to 10.488mn bpd in June – Saudi Arabia pumped 10.488mn barrels per day (bpd) of crude oil last month, an increase of 458,000 bpd from the level it said it produced in May, sources said. Saudi Arabia’s total supplies to the market in June were even higher than well-head production, the sources said, suggesting the Kingdom sold crude from storage. The sources said Saudi Arabia supplied 10.579mn bpd in June, a figure that includes domestic consumption and all exports, including from storage tanks. (Reuters) Payrolls in Saudi Arabia and the UAE could rise over the long- term – Salaries for highly skilled workers could boom as talent shortages take hold across EMEA (Europe, the Middle East and Africa), according to a study. Left unchecked, the salary rise could add more than $2.5tn to annual payrolls by 2030 in 20 leading economic markets analyzed, $593bn in the EMEA region alone. This potential salary rise is the direct result of a shortage of estimated 85mn highly skilled workers required for companies to succeed in the new digital economy. Salaries for in-demand workers in Saudi Arabia and the UAE and could add as much as $33.6bn and $5.9bn to the total national payroll by 2030, marking wage growth of 9% and over 17% respectively. (GulfBase.com) Credit and deposit growth picks up pace in the UAE – Aggregate monetary data for the first five months of the year from Central Bank of the UAE showed a pick in both credit and deposit growth across the banking system. According to an analysis of the central bank data by Abu Dhabi Commercial Bank’s Economics team, system-wide loans and deposits in the banking sector saw solid monthly rise in May, both expanding by 0.7% MoM. The overall pace of credit growth has been moderately stronger year to date, averaging 0.5% from 0.3% in the corresponding period in 2017. The MoM increase in credit in May resulted in YoY growth rate accelerating to 2.5% from 2.1% in April. The rise in gross credit was largely driven by private sector corporate loans, which expanded by 1.6% MoM (up AED12.3bn) in May. (GulfBase.com)
- 5. Page 5 of 6 UAE-China trade increases 15% to top $53bn in 2017 – The value of trade exchange between the UAE and China in 2017 grew to $53.3bn, compared to $46.3bn in 2016, an increase of 15.1%. This increase is the result of the rise in re-exports by 37.4%, valued at $3.5bn, as well as growth in imports by 14.7%, valued at $48.3bn. The UAE’s foreign trade with China in 2017 varied between direct trade, which was valued at $25.685bn or 48% of the country’s total foreign trade, and free zones, which was valued at $27.644bn or 52%. (GulfBase.com) DIB to leverage balance sheet amid rising rates – Commercial lending should drive Dubai Islamic Bank’s (DIB) double-digit growth this year, underpinned by higher risk appetite fed by strong capital base, economic growth and improved liquidity. Since loan books take longer to re-price vs. deposits, the bank may use its ample lending capacity to capture more business at higher rates, which is favorable to net interest margin. (Bloomberg) Waha Capital plans to hire for new fund targeting US, Europe – Abu Dhabi investment firm Waha Capital is planning to hire more people as it seeks to start new funds, one of which will target undervalued US and European equities. Waha Capital’s CEO, Michael Raynes said, “Our strategy is to increase fee income by raising third-party assets under management. The focus is to take opportunities to investors, in this region and in Europe, the United States and Asia.” The company, which has AED2.4bn in assets under management, is reorganizing its fund-marketing division to support its investment drive, which may also include a fund that caters to regional demand for Shari’ah-compliant investments. (GulfBase.com)
- 6. Contacts Saugata Sarkar, CFA, CAIA Shahan Keushgerian Zaid al-Nafoosi, CMT, CFTe Head of Research Senior Research Analyst Senior Research Analyst Tel: (+974) 4476 6534 Tel: (+974) 4476 6509 Tel: (+974) 4476 6535 saugata.sarkar@qnbfs.com.qa shahan.keushgerian@qnbfs.com.qa zaid.alnafoosi@qnbfs.com.qa QNB Financial Services Co. W.L.L. Contact Center: (+974) 4476 6666 PO Box 24025 Doha, Qatar Disclaimer and Copyright Notice: This publication has been prepared by QNB Financial Services Co. W.L.L. (“QNBFS”) a wholly-owned subsidiary of Qatar National Bank (Q.P.S.C.). QNBFS is regulated by the Qatar Financial Markets Authority and the Qatar Exchange. Qatar National Bank (Q.P.S.C.) is regulated by the Qatar Central Bank. This publication expresses the views and opinions of QNBFS at a given time only. It is not an offer, promotion or recommendation to buy or sell securities or other investments, nor is it intended to constitute legal, tax, accounting, or financial advice. QNBFS accepts no liability whatsoever for any direct or indirect losses arising from use of this report. Any investment decision should depend on the individual circumstances of the investor and be based on specifically engaged investment advice. We therefore strongly advise potential investors to seek independent professional advice before making any investment decision. Although the information in this report has been obtained from sources that QNBFS believes to be reliable, we have not independently verified such information and it may not be accurate or complete. QNBFS does not make any representations or warranties as to the accuracy and completeness of the information it may contain, and declines any liability in that respect. For reports dealing with Technical Analysis, expressed opinions and/or recommendations may be different or contrary to the opinions/recommendations of QNBFS Fundamental Research as a result of depending solely on the historical technical data (price and volume). QNBFS reserves the right to amend the views and opinions expressed in this publication at any time. It may also express viewpoints or make investment decisions that differ significantly from, or even contradict, the views and opinions included in this report. This report may not be reproduced in whole or in part without permission from QNBFS. COPYRIGHT: No part of this document may be reproduced without the explicit written permission of QNBFS. Page 6 of 6 Rebased Performance Daily Index Performance Source: Bloomberg Source: Bloomberg Source: Bloomberg Source: Bloomberg (*$ adjusted returns) 40.0 60.0 80.0 100.0 120.0 Jun-14 Jun-15 Jun-16 Jun-17 Jun-18 QSE Index S&P Pan Arab S&P GCC (0.8%) 0.3% 0.2% 0.6% 0.0% 0.2% 0.7% (1.0%) (0.5%) 0.0% 0.5% 1.0% SaudiArabia Qatar Kuwait Bahrain Oman AbuDhabi Dubai Asset/Currency Performance Close ($) 1D% WTD% YTD% Global Indices Performance Close 1D%* WTD%* YTD%* Gold/Ounce 1,255.20 (0.2) 0.2 (3.7) MSCI World Index 2,113.74 0.8 1.2 0.5 Silver/Ounce 16.04 (0.1) (0.5) (5.3) DJ Industrial 24,456.48 0.4 0.8 (1.1) Crude Oil (Brent)/Barrel (FM Future) 77.11 (0.4) (2.9) 15.3 S&P 500 2,759.82 0.8 1.5 3.2 Crude Oil (WTI)/Barrel (FM Future) 73.80 1.2 (0.5) 22.1 NASDAQ 100 7,688.39 1.3 2.4 11.4 Natural Gas (Henry Hub)/MMBtu 2.91 1.7 (2.0) (17.8) STOXX 600 382.36 0.6 1.2 (4.0) LPG Propane (Arab Gulf)/Ton 95.75 (0.5) 1.9 (3.3) DAX 12,496.17 0.7 2.1 (5.5) LPG Butane (Arab Gulf)/Ton 105.00 1.2 2.2 (3.2) FTSE 100 7,617.70 0.5 0.3 (2.8) Euro 1.17 0.5 0.5 (2.2) CAC 40 5,375.77 0.6 1.6 (1.1) Yen 110.47 (0.2) (0.3) (2.0) Nikkei 21,788.14 1.3 (2.0) (2.5) GBP 1.33 0.5 0.6 (1.7) MSCI EM 1,059.97 0.5 (0.9) (8.5) CHF 1.01 0.4 0.1 (1.5) SHANGHAI SE Composite 2,747.23 0.5 (3.8) (18.6) AUD 0.74 0.6 0.3 (4.9) HANG SENG 28,315.62 0.5 (2.2) (5.8) USD Index 93.96 (0.5) (0.5) 2.0 BSE SENSEX 35,657.86 0.3 0.2 (2.8) RUB 62.97 (0.3) 0.4 9.3 Bovespa 75,010.39 1.1 2.1 (16.8) BRL 0.26 1.7 0.4 (14.2) RTS 1,173.47 0.2 1.7 1.6 81.7 79.8 67.6