TrustArc Webinar - How to Build Consumer Trust Through Data Privacy
Glaser: Nuclear Power after Fukushima. A primer on Nuclear Power.
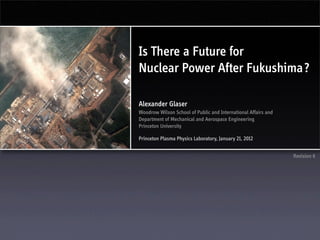
1. Is There a Future for
Nuclear Power After Fukushima?
Alexander Glaser
Woodrow Wilson School of Public and International Affairs and
Department of Mechanical and Aerospace Engineering
Princeton University
Princeton Plasma Physics Laboratory, January 21, 2012
Revision 6
2. Nuclear Power: Years of Boredom
Interrupted by Moments of Sheer Terror?
Fukushima
Chernobyl
Three Mile Island
Low estimate based on the age of reactors operating today, IAEA Power Reactor Information System
(actual value for 2010 closer to 14,000 reactor years)
Science on Saturday, Princeton Plasma Physics Laboratory, January 21, 2012 2
4. Nuclear Fission
(discovered by L. Meitner, O. Hahn, F. Strassmann, 1938)
Uranium-235 (0.7% in natural uranium, rest is U-238)
Fission fragments are positively charged and repel each other
Science on Saturday, Princeton Plasma Physics Laboratory, January 21, 2012 4
5. The 1939 Einstein Letter to President Roosevelt
... It may become possible to set up a
nuclear chain reaction in a large mass
of uranium, by which vast amounts of
power ... would be generated. Now it
appears almost certain that this could
be achieved in the immediate future.
This new phenomenon would also
lead to the construction of bombs, ...
Science on Saturday, Princeton Plasma Physics Laboratory, January 21, 2012 5
6. Two Isotopes in Natural Uranium
(Only about 0.7% is U-235, virtually all the rest is U-238)
U-235
Science on Saturday, Princeton Plasma Physics Laboratory, January 21, 2012 6
8. It Takes Only a Few Kilograms of
Fissile Material to Make a Nuclear Weapon
Size of the plutonium sphere used in the Nagasaki Bomb (about 6 kg of plutonium)
Science on Saturday, Princeton Plasma Physics Laboratory, January 21, 2012 8
9. The First Nuclear Reactors Were Used
To Make Plutonium for Weapons
Hanford B Reactor, 1944
near Richland, WA
Chicago Pile-1 (CP-1), December 2, 1942
Science on Saturday, Princeton Plasma Physics Laboratory, January 21, 2012 9
10. Nuclear-Powered Submarines Came Next
USS Nautilus (SSN-571), launched in 1954, here entering New York Harbor, 1958
Science on Saturday, Princeton Plasma Physics Laboratory, January 21, 2012 10
11. The First Civilian Power Reactor, 1957
Shippingport Atomic Power Station, Pennsylvania (Source: LIFE Magazine/Google)
Science on Saturday, Princeton Plasma Physics Laboratory, January 21, 2012 11
12. Lewis Strauss, 1954/1955
“ It is not too much to expect that our children will enjoy in
their homes electrical energy too cheap to meter; will
know of great periodic regional famines in the world only
as matters of history; will travel effortlessly over the seas
and under them and through the air with a minimum of
danger and at great speed, and will experience a lifespan
far longer than ours, as disease yields and man comes to
understand what causes him to age. This is the forecast of
an age of peace.”
Lewis L. Strauss quoted in the New York Times, August 7, 1955
(NYT, 9/17/1954)
Science on Saturday, Princeton Plasma Physics Laboratory, January 21, 2012 12
13. Electricity for 800,000 U.S. Households
200 tons of uranium have to be mined
to produce 20 tons of nuclear fuel
(only 1 ton is ultimately fissioned)
3,000,000 tons of coal
(15,000x more)
Shown is annual fuel demand for 1000 MWe plant; average U.S. household consumption: 1.2 kW or about 30 kWh per day
Science on Saturday, Princeton Plasma Physics Laboratory, January 21, 2012 13
14. Nuclear Power Reactors in the World, 2011
(444 minus 4 reactors in 30 countries, providing about 14% of global electricity; still counting 17 reactors in Germany)
32
18 164
Europe
104 50–4
14
3 21
2 20 6
2
2
2
More than 10 GWe installed
Less than 10 GWe installed
Last update: May 27, 2011
15. Nuclear Power: Years of Boredom
Interrupted by Moments of Sheer Terror?
Fukushima
Chernobyl
Three Mile Island
Low estimate based on the age of reactors operating today, IAEA Power Reactor Information System
(actual value for 2010 closer to 14,000 reactor years)
Science on Saturday, Princeton Plasma Physics Laboratory, January 21, 2012 15
19. Explosions of Secondary Containment
Buildings of Units 1 and 3
Unit 1, March 12, 2011, 3:36 p.m. Unit 3, March 14, 2011, 11:01 a.m.
Science on Saturday, Princeton Plasma Physics Laboratory, January 21, 2012 19
22. Compared to Other Sources of Energy:
What Factors Tend to Put
Nuclear Power at an Advantage?
Time-tested
Small life-cycle CO2 Emissions
In principle: scalable () few “physical” constraints)
In principle: inexhaustible () few resource constraints)
High availability () good for baseload electricity generation)
Centralized production () adequate for today’s electric grid)
Attractive if projections for future electricity demand are high
Science on Saturday, Princeton Plasma Physics Laboratory, January 21, 2012 22
23. Compared to Other Sources of Energy:
What Factors Tend to Put
Nuclear Power at a Disadvantage?
Safety concerns () risk of catastrophic accidents)
Requirement for disposal of radioactive nuclear waste
Weapons connection () nuclear proliferation)
Possibility of radiological and nuclear terrorism
Public opinion
Can go either way: Economics
Can go either way: Energy security () reliable access to fuel resources)
Science on Saturday, Princeton Plasma Physics Laboratory, January 21, 2012 23
26. Nuclear Power Reactors in the World, 2011
(444 minus 4 reactors in 30 countries, providing about 14% of global electricity; still counting 17 reactors in Germany)
32
18 164
Europe
104 50–4
14
3 21
2 20 6
2
2
2
More than 10 GWe installed
Less than 10 GWe installed
Last update: May 27, 2011
27. The Existing Fleet of Power Reactors is Aging
United States 40 64 1/1
France 58 1
Japan 7 43 4/2
Russia 9 23 11
South Korea 21 5
India 3 17 5
United Kingdom 4 15 1
Canada 2/16
Germany 1/9/7
Ukraine 15 1/2
China 14 27
Sweden 4 6 Operating, nearing 40-year life (78)
Spain 1/7 Operating, first criticality after 1975 (355)
Belgium 1/6 Under construction (64)
Taiwan 6/2
Czech Republic 6
Destroyed in accidents (6)
Switzerland 3/2
Slovak Republic 4 2 Shutdown in response to accident (7)
Finland 4 1
4 Source: IAEA Power Reactor Information System
Hungary
May 27, 2011
ALL OTHERS 3 15 5
0 20 40 60 80 100 120
Science on Saturday, Princeton Plasma Physics Laboratory, January 21, 2012 27
28. 23 Operating Reactors in the United States
Are of the Fukushima-Type
(Boiling Water Reactors with MK-I Containment, built in the 1960s)
Browns Ferry Unit I near Athens, AL, under construction
Science on Saturday, Princeton Plasma Physics Laboratory, January 21, 2012 28
29. Ginna Seabrook
Vermont Yankee
Pilgrim
Millstone 2 & 3
Indian Point 2 & 3
Susquehanna 1 & 2
Limerick 1 & 2
Three Mile Island 1
Oyster Creek
Peach Bottom 2 & 3
Hope Creek and Salem 1 & 2
Calvert Cliffs 1 & 2
North Anna 1 & 2
Surry 1 & 2 100 miles
30. Ginna Seabrook
Vermont Yankee
Pilgrim
You are here Millstone 2 & 3
Indian Point 2 & 3
Susquehanna 1 & 2
10-mile
Limerick 1 & 2 emergency planning zone
Three Mile Island 1
Oyster Creek
Peach Bottom 2 & 3
Hope Creek and Salem 1 & 2
Calvert Cliffs 1 & 2 Recommendation for U.S. citizens
within 50 miles of Fukushima to evacuate the area
North Anna 1 & 2 or take shelter indoors if safe evacuation is not practical
(http://japan.usembassy.gov)
Surry 1 & 2 100 miles
32. Advanced Reactors Promise Enhanced Safety
Double-walled containment
Four separate emergency core cooling systems
(with independent and geographically separated trains)
Corium spreading area
(“core catcher”)
Shown: Areva EPR
Estimated core damage frequency: 6 x 10⁻⁷ per year
Science on Saturday, Princeton Plasma Physics Laboratory, January 21, 2012 32
33. Advanced Reactors Are Also Expensive
Olkiluoto 3 (Finland, Areva): Four years behind schedule (2013 vs 2009)
Turnkey agreement ($4.3 billion), currently estimated loss for Areva: $3.8 billion
Source: Francois de Beaupuy, “Areva’s Overruns at Finnish Nuclear Plant Approach Initial Cost,” Bloomberg Businessweek, June 24, 2010
Science on Saturday, Princeton Plasma Physics Laboratory, January 21, 2012 33
34. Could Small Nuclear Reactors Play a Role?
Some concepts are based on proven reactor technology
Babock & Wilcox mPower Concept
• Light-water cooled
• 125-750 MWe
• Underground construction
• 60-year spent fuel storage onsite
• Quasi-standard LWR fuel
Source: www.babcock.com/products/modular_nuclear/
Science on Saturday, Princeton Plasma Physics Laboratory, January 21, 2012 34
35. Could Small Nuclear Reactors Play a Role?
Some concepts are based on proven reactor technology
FlexBlue
DCNS (formerly Direction des Constructions Navales, DCN)
jointly with Areva, CEA, and EDF
Length: about 100 m
Diameter: 12–15 m
Power: 50–250 MWe
Siting: Seafloor mooring at a depth of 60 to 100 m
a few km off coast
http://en.dcnsgroup.com/energie/civil-nuclear-engineering/flexblue/
Science on Saturday, Princeton Plasma Physics Laboratory, January 21, 2012 35
36. What Scale of a Nuclear Expansion
Would Make a Difference?
37. Global Annual CO2(eq) Emissions
Likelihood of not exceeding 2
degrees Celsius less than 50%
Likelihood of not exceeding 2
degrees Celsius greater than 80%
Courtesy: Michael Oppenheimer (Princeton, EDF)
Science on Saturday, Princeton Plasma Physics Laboratory, January 21, 2012 37
38. Computer Models Can be Used
to Examine Possible Energy Futures
and understand the impact of technologies and policies related to GHG emissions
Global Change Assessment Model (GCAM)
www.globalchange.umd.edu/models/gcam
Developed and maintained by the Joint Global Change Research Institute (JGCRI) at
University of Maryland (UMD) and U.S. DOE Pacific Northwest National Laboratory (PNNL)
Numerous energy supply technologies
Sixteen types of GHG emissions, global coverage with 14 regions
But always remember: GIGO !
Science on Saturday, Princeton Plasma Physics Laboratory, January 21, 2012 38
39. Global CO2 Emissions
under the GCAM3 Reference Scenario
GCAM3 Reference Scenario
GCAM3 Policy Scenario
Science on Saturday, Princeton Plasma Physics Laboratory, January 21, 2012 39
40. Global CO2 Emissions
under the GCAM3 Reference and Policy Scenarios
GCAM3 Reference Scenario
GCAM3 Policy Scenario
(shown GCAM3 Policy Scenario assumes escalating price of carbon beginning with $20/tC in 2020)
Science on Saturday, Princeton Plasma Physics Laboratory, January 21, 2012 40
41. Global Mean Temperature Change
under the GCAM3 Reference and Policy Scenarios
GCAM3 Reference Scenario
GCAM3 Policy Scenario
Science on Saturday, Princeton Plasma Physics Laboratory, January 21, 2012 41
42. Global Installed Nuclear Capacity
under the GCAM3 Reference and Policy Scenarios (pre-Fukushima)
GCAM3 Policy Scenario
2008 Projections of the
International Atomic Energy Agency
for 2030 (low and high)
GCAM3 Reference Scenario
Residual Capacity
of Existing Fleet
(without life extensions)
Global nuclear electricity under Policy Scenario: 1910 GWe in 2060 (23% of total) and 5190 GWe in 2095 (34% of total)
Science on Saturday, Princeton Plasma Physics Laboratory, January 21, 2012 42
43. Achieving These Targets Would Require
Unprecedented Construction Rates
100
GCAM3 Reference Scenario GCAM 3 Policy Scenario
peaks at 170 GW added in the year 2070 415 GW
Total nuclear capacity added annually [GW/yr]
in 5 years
372 GW
in 5 years
75
247 GW
in 5 years
50 208 GW 211 GW
201 GW
in 5 years in 5 years
in 5 years
Historic maximum
126 GW
(32 GW added in 1984)
in 5 years
25 94 GW
in 5 years
28 GW
11 GW in 5 years
in 5 years
0
2010–2015 2015–2020 2020–2025 2025–2030 2030–2035 2035–2040 2040–2045 2045–2050 2050–2055 2055–2060
This is already next to impossible
Science on Saturday, Princeton Plasma Physics Laboratory, January 21, 2012 43
44. If an early large-scale global buildup of nuclear power is unrealistic:
What Should Be Done Instead?
46. Enriched Uranium
(visually)
HEU
(weapon-usable)
Natural uranium Low-enriched uranium Highly enriched uranium Weapon-grade uranium
0.7% U-235 typically 3-5%, 20% U-235 and above more than 90% U-235
but less than 20% U-235
U-235
Uranium
U-238
Science on Saturday, Princeton Plasma Physics Laboratory, January 21, 2012 46
47. Global Uranium Enrichment Capacities, 2010
(14 operational plants in 10 countries, not including 3+ military plants)
26,200
20,000
10,000 1,500
2,000
120
120
tSWU/yr Total SWU-production in country/region
48. Why Centrifuges Are Different
Zippe Centrifuge, 1959
Characteristics of centrifuge technology relevant to nuclear proliferation
Rapid Breakout and Clandestine Option
Science on Saturday, Princeton Plasma Physics Laboratory, January 21, 2012 48
49.
50. Iran’s Second Enrichment Site, near Qom
(Fordow Plant, revealed in September 2009 at 34.885 N, 50.996 E)
Science on Saturday, Princeton Plasma Physics Laboratory, January 21, 2012 50
51. Newcomer Countries
According to the IAEA, 60+ countries were considering nuclear programs in 2010
More than 10 GWe installed
Less than 10 GWe installed
Considering nuclear program 63 countries shown
Last update: Fall 2010
52. Global Uranium Enrichment Capacities, 2010
(14 operational plants in 10 countries, not including two military plants)
26,200
20,000
10,000 1,500
2,000
120
120
tSWU/yr Total SWU-production in country/region
53. Global Uranium Enrichment Capacities, 2060
Based on the requirements for GCAM3 Policy Scenario in 14 World Regions
16,440
3,120
5,400
19,560 57,840
31,320 7,920
10,320
5,640
33,240
10,560
17,640
8,880
1,320
Note: 10 tSWU/yr are enough
to make HEU for 2–4 weapons per year
tSWU/yr Total SWU-production in country/region
54. Concluding Remarks
The Fukushima accidents have reminded us that we continue to rely on
a reactor technology that is not “state-of-the-art”
Critical debate needed about life-extensions and safety objectives for future reactors
The economics of nuclear power are highly uncertain
Advanced reactors promise enhanced safety but are also more expensive
Small modular reactors would have to be “mass-produced” to overcome “economy-of-scale” penalty
This decade is critical
Not much new nuclear capacity will be added in the United States and Europe
Time to establish adequate technologies and new norms of governance
Science on Saturday, Princeton Plasma Physics Laboratory, January 21, 2012 54