This document provides information about Ocean City High School in Ocean City, New Jersey. It summarizes that the school's academic performance is average compared to other schools statewide but lags behind its peer schools. Its college and career readiness is average statewide but significantly lags peer schools. Graduation and post-secondary performance is very high statewide and high compared to peers. The school meets most academic achievement targets but fewer career readiness targets.
BDSM⚡Call Girls in Sector 135 Noida Escorts >༒8448380779 Escort Service
Ocean city high school report card 2011 2012
1. State of New Jersey
09-3780-050
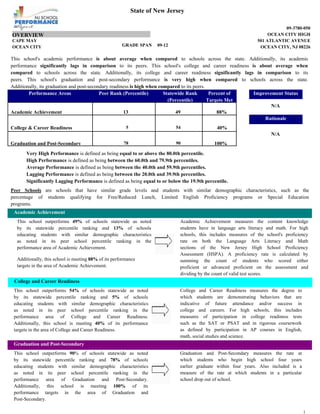
OVERVIEW OCEAN CITY HIGH
CAPE MAY 501 ATLANTIC AVENUE
OCEAN CITY GRADE SPAN 09-12 OCEAN CITY, NJ 08226
This school's academic performance is about average when compared to schools across the state. Additionally, its academic
performance significantly lags in comparison to its peers. This school's college and career readiness is about average when
compared to schools across the state. Additionally, its college and career readiness significantly lags in comparison to its
peers. This school's graduation and post-secondary performance is very high when compared to schools across the state.
Additionally, its graduation and post-secondary readiness is high when compared to its peers.
Performance Areas Peer Rank (Percentile) Statewide Rank Percent of Improvement Status
(Percentile) Targets Met
N/A
Academic Achievement 13 49 88%
Rationale
College & Career Readiness 5 54 40%
N/A
Graduation and Post-Secondary 78 90 100%
Very High Performance is defined as being equal to or above the 80.0th percentile.
High Performance is defined as being between the 60.0th and 79.9th percentiles.
Average Performance is defined as being between the 40.0th and 59.9th percentiles.
Lagging Performance is defined as being between the 20.0th and 39.9th percentiles.
Significantly Lagging Performance is defined as being equal to or below the 19.9th percentile.
Peer Schools are schools that have similar grade levels and students with similar demographic characteristics, such as the
percentage of students qualifying for Free/Reduced Lunch, Limited English Proficiency programs or Special Education
programs.
Academic Achievement
This school outperforms 49% of schools statewide as noted Academic Achievement measures the content knowledge
by its statewide percentile ranking and 13% of schools students have in language arts literacy and math. For high
educating students with similar demographic characteristics schools, this includes measures of the school's proficiency
as noted in its peer school percentile ranking in the rate on both the Language Arts Literacy and Math
performance area of Academic Achievement. sections of the New Jersey High School Proficiency
Assessment (HSPA). A proficiency rate is calculated by
Additionally, this school is meeting 88% of its performance summing the count of students who scored either
targets in the area of Academic Achievement. proficient or advanced proficient on the assessment and
dividing by the count of valid test scores.
College and Career Readiness
This school outperforms 54% of schools statewide as noted College and Career Readiness measures the degree to
by its statewide percentile ranking and 5% of schools which students are demonstrating behaviors that are
educating students with similar demographic characteristics indicative of future attendance and/or success in
as noted in its peer school percentile ranking in the college and careers. For high schools, this includes
performance area of College and Career Readiness. measures of participation in college readiness tests
Additionally, this school is meeting 40% of its performance such as the SAT or PSAT and in rigorous coursework
targets in the area of College and Career Readiness. as defined by participation in AP courses in English,
math, social studies and science.
Graduation and Post-Secondary
This school outperforms 90% of schools statewide as noted Graduation and Post-Secondary measures the rate at
by its statewide percentile ranking and 78% of schools which students who begin high school four years
educating students with similar demographic characteristics earlier graduate within four years. Also included is a
as noted in its peer school percentile ranking in the measure of the rate at which students in a particular
performance area of Graduation and Post-Secondary. school drop out of school.
Additionally, this school is meeting 100% of its
performance targets in the area of Graduation and
Post-Secondary.
1
2. State of New Jersey
09-3780-050
DEMOGRAPHIC INFORMATION OCEAN CITY HIGH
CAPE MAY 501 ATLANTIC AVENUE
OCEAN CITY GRADE SPAN 09-12 OCEAN CITY, NJ 08226
Enrollment by Grade
This graph presents the count of students who were 'on roll' by Language Diversity
grade in October of each school year. This table presents the percentage of students who
1400
primarily speak each language in their home.
1200 18 21
330 331
1000 2011-12 Percent
Enrollment Count
UG
English 98.9%
800 12
320 295
11 Spanish 0.6%
600 10
Chinese 0.2%
285 298 09
400
Bulgarian 0.1%
200 Russian 0.1%
289 314
0 Philippine languages 0.1%
2010-11 2011-12
Total School Enrollment Trends
Other 0.1%
Note: "UG" represents the count of students who are 'on roll' in this
Enrollment by Ethnic/Racial Subgroup
school but who are educated in ungraded classrooms, meaning that the
classrooms may contain students from multiple grade levels. This graph presents the percentages of enrollment for each
subgroup defined by the No Child Left Behind Act of 2001
Total School Enrollment Two or More
Races
2010-11 1,242 0.2% White
2011-12 1,258 American Black
Indian Hispanic
0.2% Asian
Enrollment Trends by Program Asian American Indian
16 15 Participation 1.3% Pacific Islander
14 Hispanic White Two or More Races
14 2.8%
12
92.6%
12 Black
3.0%
Percent of Enrollment
10
2010-11
8
2011-12
6
Enrollment by Gender
4 This graph presents the count of students by gender who were 'on
3 roll' in October of each school year.
2 700
0 0 600
0
DISABILITY ECONDIS LEP
500
400 Male
Current Year Enrollment by Program Participation
300 Female
Count of % of
2011-2012 200
Students Enrollment
100
Students with Disability 192 15%
0
Economically Disadvantaged 2010-11 2011-12
34 2.7%
Students Male Female
Limited English Proficient
2010-11 615 627
Students 0 0.0%
2011-12 607 652
2
3. State of New Jersey
09-3780-050
ACADEMIC ACHIEVEMENT OCEAN CITY HIGH
CAPE MAY 501 ATLANTIC AVENUE
OCEAN CITY GRADE SPAN 09-12 OCEAN CITY, NJ 08226
Academic Achievement measures the content knowledge students have in Language Arts Literacy and Math. In high schools, this
includes the outcomes of the New Jersey High School Proficiency Assessment (HSPA). The first column - Schoolwide Performance - in
the table below includes measures of the total schoolwide proficiency rate in both Language Arts Literacy and Math across multiple
administrations of the assessment. The second column - Peer School Percentile Rank - indicates where the school's proficiency rate
compares to its group of peer schools. For example, a school that has a peer school percentile rank of 65 has a proficiency rate that is
higher than 65% of its peer schools. The third column - Statewide Percentile Rank - indicates where the school's proficiency rate
compares to schools across the state. For example, a school that has a statewide percentile rank of 30 has a proficiency rate that is higher
than 30% of all schools with HSPA scores statewide. The last column - Percent of Targets Met - presents the percentage of progress
targets met as defined by the NJDOE’s NCLB waiver.
The Summary row presents the averages of the peer school percentile ranks, the average of statewide percentile ranks and the
percentage of statewide targets met.
Schoolwide Peer Rank State Rank Percent of Targets Met
Academic Achievement Indicators
Performance (Percentile) (Percentile)
HSPA Language Arts Proficiency and above 95% 13 45 100%
HSPA Math Proficiency and above 88% 13 53 75%
SUMMARY - Academic Achievement 13 49 88%
NCLB Progress Targets - Language Arts Literacy Proficiency Trends - Language Arts Literacy
This table presents the Progress Targets as uniquely calculated for each
This graph presents the percentage of students who scored in the
subgroup in each school under NJDOE’s NCLB waiver. The
Advanced Proficient, Proficient and Partially Proficient
methodology - as defined by the United States Department of Education
categories of the statewide Language Arts Literacy assessment
- is calculated so that each subgroup will halve the gap between their
over the prior four years.
2011 proficiency rate and 100% proficiency by 2017.
Subgroups Total Valid Pass Target Met
Scores Rate Target?
Schoolwide 311 94.9 90 YES
100
10 11
White 290 94.5 90 YES 19 24
80
Black - - --
60
Hispanic - - --
87 83
40 76 71
American Indian - - --
Asian - - -- 20
Two or More Races - - -- 3 6 5 5
0
2008-09 2009-10 2010-11 2011-12
Limited English Proficient - - --
Advanced Proficient Proficient
Students
Partially Proficient
Economically 50 88 85.4 YES
Disadvantaged Students
Students with Disability 50 68 73.4 YES*
YES* = Met Progress Target (Confidence Interval Applied)
Data is presented for subgroups when the count is high enough under
NCLB suppression rules.
3
4. State of New Jersey
09-3780-050
ACADEMIC ACHIEVEMENT OCEAN CITY HIGH
CAPE MAY 501 ATLANTIC AVENUE
OCEAN CITY GRADE SPAN 09-12 OCEAN CITY, NJ 08226
NCLB Progress Targets - Math Proficiency Trends - Math
This table presents the Progress Targets as uniquely calculated for each
subgroup in each school under NJDOE’s NCLB waiver. The This graph presents the percentage of students who scored in the
methodology - as defined by the United States Department of Advanced Proficient, Proficient and Partially Proficient
Education - is calculated so that each subgroup will halve the gap categories of the statewide Math assessment over the prior four
between their 2011 proficiency rate and 100% proficiency by 2017. years.
Total Valid Pass Met
Subgroups Target
Scores Rate Target?
Schoolwide 312 88.1 90 YES*
White 291 89.1 90 YES*
100
Black - - -- 28 29 28
32
80
Hispanic - - --
60
American Indian - - --
40 66 59 62 60
Asian - - --
Two or More Races - - -- 20
6 9 9 12
Limited English Proficient Students - - -- 0
2008-09 2009-10 2010-11 2011-12
Economically Disadvantaged 50 70 77.5 YES*
Advanced Proficient Proficient
Students Partially Proficient
Students with Disability 50 48 62.3 NO
YES* = Met Progress Target(Confidence Interval Applied)
Data is presented for subgroups when the count is high enough under
NCLB suppression rules.
Proficiency Outcomes - Biology Proficiency Trends - Biology
This table presents the percentage of students who scored in the
This graph presents the percentage of students who scored in
Advanced Proficient, Proficient and Partially Proficient categories of
the Advanced Proficient, Proficient, and Partially Proficient
the New Jersey Biology Competency Test (NJBCT) in the latest school
categories of the Biology Competency Test over the last two
year.
years.
Partially
Subgroups Advanced Proficient
Proficient
Schoolwide 17% 43% 40%
White 17% 44% 39%
Black - - -
100
Hispanic - - - 17 17
80
American Indian - - -
60 46 43
Asian - - -
Two or More Races - - - 40
Students with Disability 0% 31% 69% 20 40
37
Limited English Proficient Students - - -
0
2010-11 2011-12
Economically Disdvantaged Students 15% 39% 45%
Data is presented for subgroups when the count is high enough under Advanced Proficient Proficient
Partially Proficient
NCLB suppression rules.
4
5. State of New Jersey
09-3780-050
COLLEGE AND CAREER READINESS OCEAN CITY HIGH
CAPE MAY 501 ATLANTIC AVENUE
OCEAN CITY GRADE SPAN 09-12 OCEAN CITY, NJ 08226
Students in high schools begin to demonstrate college readiness behaviors long before they actually graduate from high school.
Among those behaviors are taking college entrance exams and challenging themselves with rigorous course work. The table below
presents five such indicators: the percentage of students enrolled in the 12th grade who took the SAT, the percentage of 10th and
11th graders who took the PSAT, the percentage of students who scored above the SAT benchmark of 1550, the percentage of 11th
and 12th graders who took at least one AP test in English, math, social studies or science, and the percentage of those AP tests that
were scored a 3 or higher.
The first column - Schoolwide Performance - represents the outcomes for these particular inidcators in the school. The second
column - Peer School Percentile Rank - indicates how the school's performance compares to its group of peer schools. For example, a
school whose peer school rank is 65 in SAT participation has a higher SAT Participation than 65% of its peer group. The third
column - Statewide Percentile Rank - indicates how the school's performance compares to schools across the state. The fourth
column - Statewide Target - provides the statewide targets for each of these indicators. The last column - Met Target? - indicates
whether the School Performance met or exceeded the statewide target.
The Summary row presents the averages of the peer school percentile ranks, the average of statewide percentile ranks and the
percentage of statewide targets met.
College and Career Readiness Schoolwide Peer Rank Statewide Rank Statewide Met Target?
Indicators Performance (Percentile) (Percentile) Target
% of Students Participating in SAT YES
82% 0 57 80%
% of Students Participating in PSAT NO
41% 0 36 60%
% of Students Scoring Above 1550 on SAT YES
40% 0 54 40%
% of Students Taking at least one AP Test in
NO
English, Math, Social Studies or Science 25% 23 73 35%
% of AP Tests in English, Math, Social
NO
Studies or Science with Score 3 or Greater 68% 0 49 75%
Summary 40%
5 54
College Readiness Test Participation AP Participation - 'Unique' Students
The first column of the table below presents the percentage of The table below presents the proportion of 'unique' students
students enrolled in the 12th grade who took the SAT and the percentage enrolled in at least 11th and 12th grade i.e, each student is counted
of students enrolled in 10th and 11th grade who took the PSAT. The once regardless of how many AP courses he/she may take. The
second column provides the average across the school's peer group for table also presents the proportion of how many 'unique' students
these two metrics. took at least one AP test to the school's enrollment in 11th and 12th
grade.
2011-12 School Peer Avg.
% of Students 2011-12 School Peer Avg.
Participating in SAT 82% 90% % of Students Taking 1+
% of Students Course 50.6% 48%
Participating in PSAT 41% 69% % of Students Taking 1+
Test 37.7% 42%
Participation Trends - SAT Testing Note: Students who are enrolled in AP coursework or take AP tests
This graph presents the participation rate in the SAT over the last four years. in grades other than 11th and 12th are included in the numerator of
100
this calculation.
80
Advanced Placement (AP) Test Results
Participation Rate
60
This table presents the percentage of all AP tests taken by
students enrolled in the school that were scored as 3 or
40 82 82
74 74
Greater.
20
2011-12 School Peer Avg.
0
2008-09 2009-10 2010-11 2011-12
% of AP Tests scored 3
Year 77.1% 86%
or Greater
5
6. State of New Jersey
09-3780-050
COLLEGE AND CAREER READINESS OCEAN CITY HIGH
CAPE MAY 501 ATLANTIC AVENUE
OCEAN CITY GRADE SPAN 09-12 OCEAN CITY, NJ 08226
Scholastic Assessment Test (SAT) Results AP Courses Offered
This table presents the percentage of students who achieved a This table presents the count of students enrolled in each AP
composite SAT score of 1550 or higher. The SAT benchmark score of course offered in this school in the first column. The second
1550 (Critical Reading, Mathematics and Writing Score combined) column presents the count of tests taken in each AP course. The
indicates a 65 percent likelihood of achieveing a B- average or higher numbers may not match as some students do not take the test in the
during the first year of college, which in turn has been found by the same year as they take the course and some students may take the
College Board's research to be indicative of a high likelihood of college course without taking the test or vice versa.
success and completion.
Students Students
AP Course Name
2011-12 School Peer Avg. Enrolled Tested
AP Psychology 114 91
% of Students Scoring
40% 65% AP U.S. History 86 25
Above 1550 on SAT
AP Statistics 55 51
SAT Benchmark Trends
This chart presents the percentage of students who achieved a composite SAT score of 1550 or AP Chemistry 47 44
higher over the past four years.
50
AP Human Geography 44 36
40
AP English Literature and Composition 41 27
% above 1550
30
PERCENT SAT ABOVE AP English Language and Composition 36 36
43.7 46.1 1550
20 40.0 40.2
AP Calculus AB 35 34
10
AP U.S. Government and Politics 34 26
0
2008-09 2009-10 2010-11 2011-12
Year AP Biology 34 25
Composite SAT Score AP Calculus BC 27 22
This chart presents the average composite SAT score from the last AP Physics B 25 20
academic year for students enrolled in this school as well as the average
scores achieved in Critical Reading, Mathematics and Writing. The AP World History 20 18
averages from this school’s peer group are also presented.
AP Studio Art—Drawing Portfolio 13 6
2011-12 School Peer Avg. AP Spanish Language 8 8
Composite SAT Score 1,501.0 1,671 AP French Language 7 6
AP Computer Science A 3 3
Critical Reading 496.0 546
Mathematics 517.8 572
Writing 487.7 554
This chart presents the scores achieved in Critical Reading,
Mathematics and Writing by the students at the 25th percentile, the
50th percentile and the 75th percentile of the school's distribution
of SAT scores.
2011-12 Critical Reading Mathematics Writing
75th Percentile 560.0 580.0 550.0
50th Percentile 490.0 510.0 480.0
25th Percentile 430.0 450.0 420.0
6
7. State of New Jersey
09-3780-050
GRADUATION AND POST-SECONDARY OCEAN CITY HIGH
CAPE MAY 501 ATLANTIC AVENUE
OCEAN CITY GRADE SPAN 09-12 OCEAN CITY, NJ 08226
This section of the performance report presents data about graduation, dropout and post-secondary attendance. The
graduation rate is calculated according to the NCLB Cohort methodology as required by the United States Department of
Education. Dropout rates are calculated from student-level data submitted by districts for students officially classified as
dropouts. The graduation rate plus the dropout rate will likely not total to 100% due to some students who are continuing past
the 4th year of enrollment to complete graduation requirements.
The first column - Schoolwide Performance - represents the outcomes for these particular indicators in this school. The
second column - Peer School Percentile Rank - indicates how the school’s performance compares to its group of peer schools.
For example, a school whose peer school rank is 65 in Graduation Rate has a higher Graduation Rate than 65% of its peer
group. The third column - Statewide Percentile Rank - indicates how the school’s performance compares to schools across the
state. The fourth column - Statewide Target - provides the statewide targets for each of these indicators. The Statewide Target
for Graduation Rate was established pursuant to NJDOE’s NCLB Accountability Workbook. The last column - Met Target -
indicates whether the School Performance met or exceeded the statewide target.
The Summary row presents the averages of the peer school percentile ranks, the average of statewide percentile ranks and
the percentage of statewide targets met.
Graduation & Post Secondary Schoolwide Peer Rank Statewide Rank Statewide Met Target
Indicators Performance (Percentile) (Percentile) Targets
Overall Graduation Rate 99.4% 94 93 75% YES
Dropout Rate 0.1% 61 87 2% YES
SUMMARY - Graduation & Post-Secondary
78 90 100%
Graduation Rate by Subgroup Dropout Rate by Subgroup
This table presents for all NCLB-identified subgroups the “4 This table presents for all NCLB-identified subgroups
-year Adjusted Graduation Rate.” This rate calculates the the Dropout rate. This rate calculates the percentage of
percentage of students who are awarded a regular, high school students who are classified as dropouts who were identified
diploma within four years of becoming a first-time ninth grader. four years earlier as first-time ninth graders. The rate is
The rate is adjusted to account for students who ‘transfer-in’ and adjusted to account for students who ‘transfer-in’ and for
for students who are verified as ‘transfers-out'. students who are verified as ‘transfers-out’.
School State Target
School State Target
Schoolwide 99% 75%
Schoolwide .1% 2%
White 99.4% White .1%
Black 100% Black 0%
Hispanic 100% Hispanic 0%
American Indian N/A American Indian 0%
Asian 100% Asian 0%
Native Hawaiian 100% Native Hawaiian 0%
Two or More Races N/A Two or More Races N/A
Students with Disability 100% Students with Disability .5%
Limited English Proficient Students 100% Limited English Proficient Students N/A
Economically Disadvantaged Students 100% Economically Disadvantaged Students 0%
7
8. State of New Jersey
09-3780-050
GRADUATION AND POST-SECONDARY OCEAN CITY HIGH
CAPE MAY 501 ATLANTIC AVENUE
OCEAN CITY GRADE SPAN 09-12 OCEAN CITY, NJ 08226
Graduation Pathway Rates Extended Year Graduation Rate
This chart presents the percentage of high school The chart below presents the 4-year and 5-year graduation
graduates who graduated by passing both sections of the rate for the prior school year’s cohort in addition to the 4-year
HSPA, who were exempt from passing the HSPA, or who graduation rate for last year’s cohort.
demonstrated proficiency through an alternative pathway
such as through the Alternative High School Assessment,
achievement of the ‘Just Proficient Mean’ or an appeal Class of 4-year Rate 5-year Rate
process.
2011 97 % 98 %
EXEMPT 2012 99 %
7.0
OTHER
9.1
HSPA
83.9
HSPA OTHER EXEMPT
Post-Secondary Enrollment Rates
This chart presents the enrollment rates of this school’s high
school graduates, 16-months after high school graduation. The data
is from the National Student Clearinghouse which reports that it
collects student-level enrollment data from 95% of Institutions of
Higher Education nationwide.
School
Schoolwide 73%
White 73.5%
Black 58.3%
Hispanic 75%
American Indian N/A
Asian 71.4%
Native Hawaiian N/A
Two or More Races 100%
Students with Disability 51%
Limited English Proficient Students N/A
Economically Disadvantaged Students 60%
8
9. State of New Jersey
09-3780-050
WITHIN SCHOOL ACHIEVEMENT GAP OCEAN CITY HIGH
CAPE MAY 501 ATLANTIC AVENUE
OCEAN CITY GRADE SPAN 09-12 OCEAN CITY, NJ 08226
This section of the performance report presents data about the achievement gap that exists within a school - as measured by
the difference between the students’ scale scores at the 25th and 75th percentile in the school, the so-called Interquartile Range
(IQR). Taken together with an understanding of the overall and average achievement levels in the school, the IQR furthers an
understanding of the range of student outcomes that exist in a school. A school gap smaller than the state gap indicates that the
school’s range of student outcomes is narrower than the state’s while a school gap larger than the state gap indicates that the
school’s range of student outcomes is larger than the state’s.
High School High School
HSPA Language Arts 25th %ile vs 75th % ile HSPA Math 25th %ile vs 75th % ile
This table presents the scale scores associated with students This table presents the scale scores associated with students
at the bottom (0th percentile), the 25th percentile, the 50th at the bottom (0th percentile), the 25th percentile, the 50th
percentile, the 75th percentile and the top (99th percentile) percentile, the 75th percentile and the top (99th percentile)
of school's distribution of school's distribution
Percentile Scale Score
Percentile Scale Score
99th 266
99th 271
75th 248
75th 250
50th 239
50th 233
25th 224
25th 216
0th 100
0th 140
Scale Score Gap - Scale Score Gap - Scale Score Gap - Scale Score Gap -
School State School State
25th vs 75th Gap 24 28 25th vs 75th Gap 34 44
9
10. State of New Jersey
09-3780-050
SCHOOL CLIMATE OCEAN CITY HIGH
CAPE MAY 501 ATLANTIC AVENUE
OCEAN CITY GRADE SPAN 09-12 OCEAN CITY, NJ 08226
Length of School Day Instructional Time
This table presents the amount of time a This table presents the amount of time that a
school is in session for a typical student on a typical student is engaged in instructional
normal school day. activities under the supervision of a certified
teacher.
School 2011-12 School
2011-12 6 Hrs 37 Mins Full Time 5 Hrs 36 Mins.
Shared Time 2 Hrs. 48 Mins.
Student Suspension Rate Student Expulsions
This table presents the percentage of students This table presents the number of students
who were suspended one or more times during who were expelled from the school and
the school year. district during the school year.
School School
2011-12 4.9%
2011-12 0
Student to Staff Ratio
This table presents the count of students per faculty member
or administrator in the school. All staff are counted in
full-time equivalents.
2011-12 School
Faculty 11.3
Administrators 314.5
10
11. SCHOOL PEER GROUP OCEAN CITY HIGH 09-3780-050
This table presents the list of peer schools in alphabetical order by county name that was created specifically for this school
(highlighted in yellow). Peer schools are drawn from across the state and represent schools that have similar grade configurations
and that are educating students of similar demographic characteristics, as measured by enrollment in Free/Reduced Lunch
Programs, Limited English Proficiency or Special Education Programs.
CDS GRADE
COUNTY NAME DISTRICT NAME SCHOOL NAME
CODE SPAN FRPL LEP SpED
BERGEN MIDLAND PARK BORO MIDLAND PARK HIGH 03-3170-050 07-12 6.1% 0.0% 7.6%
BERGEN NORTHERN VALLEY N VALLEY REG H DEMAREST 03-3710-050 09-12 0.7% 0.4% 17.9%
REGIONAL
BERGEN PARK RIDGE BORO PARK RIDGE HIGH 03-3940-050 07-12 2.9% 0.6% 12.5%
BERGEN PASCACK VALLEY PASCACK HILLS HIGH 03-3960-040 09-12 0.9% 0.7% 16.6%
REGIONAL
BERGEN PASCACK VALLEY PASCACK VALLEY HIGH 03-3960-050 09-12 2.3% 0.3% 16.0%
REGIONAL
BERGEN RAMAPO-INDIAN HILL REG INDIAN HILLS HIGH 03-4300-030 09-12 1.4% 0.0% 16.3%
BERGEN RIDGEWOOD VILLAGE RIDGEWOOD HIGH 03-4390-050 09-12 1.9% 0.8% 12.3%
BERGEN RUTHERFORD BORO RUTHERFORD HIGH 03-4600-050 09-12 2.1% 0.8% 11.5%
CAMDEN HADDONFIELD BORO HADDONFIELD MEMORIAL HIGH 07-1900-050 09-12 1.2% 0.1% 14.7%
CAPE MAY OCEAN CITY OCEAN CITY HIGH 09-3780-050 09-12 2.7% 0.0% 14.7%
ESSEX CALDWELL-WEST JAMES CALDWELL HIGH SCH 13-0660-050 09-12 1.8% 0.4% 14.4%
CALDWELL
ESSEX CEDAR GROVE TWP CEDAR GROVE HIGH 13-0760-050 09-12 2.8% 0.7% 11.8%
ESSEX LIVINGSTON TWP LIVINGSTON SR HIGH 13-2730-050 09-12 1.0% 0.5% 13.4%
ESSEX MILLBURN TWP MILLBURN SR HIGH 13-3190-050 09-12 1.3% 1.3% 14.2%
ESSEX WEST ESSEX REGIONAL WEST ESSEX HIGH 13-5630-050 09-12 2.0% 0.5% 14.6%
MERCER HOPEWELL VALLEY CENTRAL HIGH 21-2280-030 09-12 2.8% 0.1% 12.0%
REGIONAL
MERCER ROBBINSVILLE TWP ROBBINSVILLE HIGH SCHOOL 21-5510-030 09-12 3.2% 0.1% 14.1%
MONMOUTH FREEHOLD REGIONAL MANALAPAN HIGH 25-1650-070 09-12 4.9% 0.0% 11.8%
MONMOUTH RUMSON-FAIR HAVEN REG RUMSON FAIR HAVEN REG H 25-4580-050 09-12 0.7% 0.1% 14.7%
MONMOUTH WALL TWP WALL HIGH 25-5420-050 09-12 2.2% 0.4% 14.3%
MORRIS HANOVER PARK REGIONAL WHIPPANY PARK HIGH 27-1990-070 09-12 1.5% 0.8% 11.8%
MORRIS MONTVILLE TWP MONTVILLE HIGH 27-3340-010 09-12 1.5% 1.5% 11.1%
MORRIS MOUNTAIN LAKES BORO MOUNTAIN LAKES HIGH 27-3460-050 09-12 0.7% 0.3% 16.8%
MORRIS PEQUANNOCK TWP PEQUANNOCK TWP HIGH 27-4080-050 09-12 3.7% 0.3% 13.7%
MORRIS SCH DIST OF THE CHATHAM HIGH 27-0785-010 09-12 2.0% 0.6% 15.5%
CHATHAMS
MORRIS WEST MORRIS REGIONAL WEST MORRIS CENTRAL HIGH 27-5660-030 09-12 0.9% 0.0% 15.1%
SOMERSET BERNARDS TWP RIDGE HIGH 35-0350-050 09-12 2.0% 0.3% 13.8%
SOMERSET WATCHUNG HILLS WATCHUNG HILLS REG H 35-5550-050 09-12 2.8% 0.4% 14.9%
REGIONAL
SUSSEX SPARTA TWP SPARTA HIGH SCHOOL 37-4960-050 09-12 3.8% 0.3% 11.0%
UNION NEW PROVIDENCE BORO NEW PROVIDENCE HIGH 39-3560-050 09-12 2.9% 0.3% 11.6%
UNION WESTFIELD TOWN WESTFIELD SENIOR HIGH 39-5730-050 09-12 2.2% 0.1% 16.9%
11