Monthly Inventory Analysis Shows Decreasing Active Inventory and Rising Home Prices
•
0 gostou•235 visualizações


Recomendados
Recomendados
Mais conteúdo relacionado
Mais procurados
Mais procurados (17)
Destaque
Destaque (10)
Semelhante a Monthly Inventory Analysis Shows Decreasing Active Inventory and Rising Home Prices
Semelhante a Monthly Inventory Analysis Shows Decreasing Active Inventory and Rising Home Prices (20)
Último
Último (20)
Monthly Inventory Analysis Shows Decreasing Active Inventory and Rising Home Prices
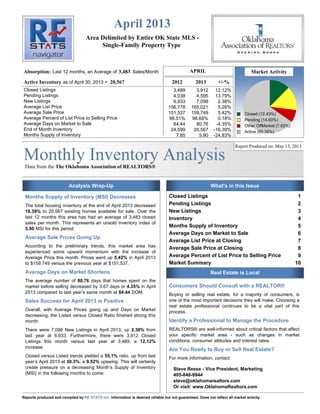
- 1. Monthly Inventory AnalysisData from the The Oklahoma Association of REALTORS® Area Delimited by Entire OK State MLS - Single-Family Property Type April 2013 Report Produced on: May 13, 2013 Absorption: Active Inventory 3,483 20,567 APRIL Market Activity 2012 2013 +/-% Last 12 months, an Average of Sales/Month as of April 30, 2013 = Closed Listings Pending Listings New Listings Average List Price Average Sale Price Average Percent of List Price to Selling Price Average Days on Market to Sale End of Month Inventory Months Supply of Inventory Closed Listings 1 Pending Listings 2 New Listings 3 Inventory 4 Months Supply of Inventory 5 Average Days on Market to Sale 6 Average List Price at Closing 7 Average Sale Price at Closing 8 Average Percent of List Price to Selling Price 9 Market Summary 10 3,489 3,912 12.12% 4,038 4,595 13.79% 6,933 7,098 2.38% 156,778 165,021 5.26% 151,537 159,749 5.42% 96.51% 96.68% 0.18% 84.44 80.76 -4.35% 24,599 20,567 -16.39% 7.85 5.90 -24.83% Analysis Wrap-Up What's in this Issue Real Estate is Local Closed (12.43%) Pending (14.60%) Other OffMarket (7.62%) Active (65.35%) Months Supply of Inventory (MSI) Decreases The total housing inventory at the end of April 2013 decreased 16.39% to 20,567 existing homes available for sale. Over the last 12 months this area has had an average of 3,483 closed sales per month. This represents an unsold inventory index of 5.90 MSI for this period. Average Sale Prices Going Up According to the preliminary trends, this market area has experienced some upward momentum with the increase of Average Price this month. Prices went up 5.42% in April 2013 to $159,749 versus the previous year at $151,537. Average Days on Market Shortens The average number of 80.76 days that homes spent on the market before selling decreased by 3.67 days or 4.35% in April 2013 compared to last year’s same month at 84.44 DOM. Sales Success for April 2013 is Positive Overall, with Average Prices going up and Days on Market decreasing, the Listed versus Closed Ratio finished strong this month. There were 7,098 New Listings in April 2013, up 2.38% from last year at 6,933. Furthermore, there were 3,912 Closed Listings this month versus last year at 3,489, a 12.12% increase. Closed versus Listed trends yielded a 55.1% ratio, up from last year’s April 2013 at 50.3%, a 9.52% upswing. This will certainly create pressure on a decreasing Month’s Supply of Inventory (MSI) in the following months to come. Consumers Should Consult with a REALTOR® Buying or selling real estate, for a majority of consumers, is one of the most important decisions they will make. Choosing a real estate professional continues to be a vital part of this process. Identify a Professional to Manage the Procedure REALTORS® are well-informed about critical factors that affect your specific market area - such as changes in market conditions, consumer attitudes and interest rates. Are You Ready to Buy or Sell Real Estate? For more information, contact: Steve Reese - Vice President, Marketing 405-848-9944 steve@oklahomarealtors.com Or visit: www.OklahomaRealtors.com Reports produced and compiled by Information is deemed reliable but not guaranteed. Does not reflect all market activity.RE STATS Inc.
- 2. Monthly Inventory Analysis The Oklahoma Association of REALTORS® April 2013 ClosedListings Closed Listings ReadytoBuyorSellRealEstate? ContactanexperiencedREALTOR Data from the Area Delimited by Entire OK State MLS - Single-Family Property Type Closed Sales as of May 12, 2013 Report Produced on: May 13, 2013 APRIL YEAR TO DATE (YTD) 5 YEAR MARKET ACTIVITY TRENDS 5yr APR AVG = 3,527 3 MONTHS CLOSED LISTINGS & BEDROOMS DISTRIBUTION BY PRICE High Low Jul 2009 = 4,131 Jan 2010 = 1,728 Closed Listingsthis month at above the 5 yr APR average of 3,912, 3,527 F E B M A R A P R Distribution of Closed Listings by Price Range % AVDOM 2 Beds 3 Beds 4 Beds 5 Beds+ 2009 3,096 2010 3,894 2011 3,246 2012 3,489 2013 3,912 1 Year 2 Year +12.12% +20.52% 2009 10,447 2010 11,156 2011 10,188 2012 11,971 2013 12,799 1 Year 2 Year +6.92% +25.63% 2,723 3,665 34.59% 3,912 6.74% 152 3.89% 92.8 76 68 5 3 $25,000 and less 640 16.36% 78.1 239 346 53 2 $25,001 $75,000 424 10.84% 86.6 105 277 38 4 $75,001 $100,000 1,064 27.20% 76.6 160 769 128 7 $100,001 $150,000 750 19.17% 84.7 98 436 200 16 $150,001 $200,000 472 12.07% 76.2 56 186 208 22 $200,001 $275,000 410 10.48% 83.1 32 110 219 49 $275,001 and up 5,000 4,000 3,000 2,000 1,000 0 Jun 2009 Dec 2009 Jun 2010 Dec 2010 Jun 2011 Dec 2011 Jun 2012 Dec 2012 Total Closed Units: Total Closed Volume: Average Closed Price: 3,912 624,939,258 $159,749 80.8 766 85.52M $111,647 2192 300.60M $137,136 851 199.21M $234,095 103 39.60M $384,478 pp. 1Reports produced and compiled by Information is deemed reliable but not guaranteed. Does not reflect all market activity.RE STATS Inc. Steve Reese 405-848-9944 steve@oklahomarealtors.com
- 3. Monthly Inventory Analysis The Oklahoma Association of REALTORS® April 2013 PendingListings Pending Listings ReadytoBuyorSellRealEstate? ContactanexperiencedREALTOR Data from the Area Delimited by Entire OK State MLS - Single-Family Property Type Pending Listings as of May 12, 2013 Report Produced on: May 13, 2013 APRIL YEAR TO DATE (YTD) 5 YEAR MARKET ACTIVITY TRENDS 5yr APR AVG = 4,131 3 MONTHS PENDING LISTINGS & BEDROOMS DISTRIBUTION BY PRICE High Low Apr 2010 = 4,963 Dec 2009 = 2,048 Pending Listingsthis month at above the 5 yr APR average of 4,595, 4,131 F E B M A R A P R Distribution of Pending Listings by Price Range % AVDOM 2 Beds 3 Beds 4 Beds 5 Beds+ 2009 3,656 2010 4,963 2011 3,402 2012 4,038 2013 4,595 1 Year 2 Year +13.79% +35.07% 2009 12,555 2010 14,549 2011 11,991 2012 14,445 2013 15,961 1 Year 2 Year +10.49% +33.11% 3,732 4,159 11.44% 4,595 10.48% 447 9.73% 68.5 197 225 22 3 $50,000 and less 490 10.66% 79.2 146 305 37 2 $50,001 $80,000 800 17.41% 63.4 171 538 87 4 $80,001 $120,000 978 21.28% 61.8 141 681 150 6 $120,001 $160,000 847 18.43% 65.6 106 468 257 16 $160,001 $220,000 561 12.21% 63.4 58 204 279 20 $220,001 $300,000 472 10.27% 72.0 50 100 258 64 $300,001 and up 5,000 4,000 3,000 2,000 1,000 0 Jun 2009 Dec 2009 Jun 2010 Dec 2010 Jun 2011 Dec 2011 Jun 2012 Dec 2012 Total Pending Units: Total Pending Volume: Average Listing Price: 4,595 784,189,737 $146,405 76.6 869 108.21M $124,520 2521 361.24M $143,292 1090 267.88M $245,762 115 46.86M $407,506 pp. 2Reports produced and compiled by Information is deemed reliable but not guaranteed. Does not reflect all market activity.RE STATS Inc. Steve Reese 405-848-9944 steve@oklahomarealtors.com
- 4. Monthly Inventory Analysis The Oklahoma Association of REALTORS® April 2013 NewListings New Listings ReadytoBuyorSellRealEstate? ContactanexperiencedREALTOR Data from the Area Delimited by Entire OK State MLS - Single-Family Property Type New Listings as of May 12, 2013 Report Produced on: May 13, 2013 APRIL YEAR TO DATE (YTD) 5 YEAR MARKET ACTIVITY TRENDS 5yr APR AVG = 6,966 3 MONTHS NEW LISTINGS & BEDROOMS DISTRIBUTION BY PRICE High Low Apr 2010 = 7,848 Dec 2012 = 3,712 New Listings this month at above the 5 yr APR average of 7,098, 6,966 F E B M A R A P R Distribution of New Listings by Price Range % 2 Beds 3 Beds 4 Beds 5 Beds+ 2009 6,100 2010 7,848 2011 6,853 2012 6,933 2013 7,098 1 Year 2 Year +2.38% +3.58% 2009 22,625 2010 25,964 2011 23,855 2012 25,606 2013 25,311 1 Year 2 Year -1.15% +6.10% 5,516 6,740 22.19% 7,098 5.31% 599 8.44% 290 281 25 3 $50,000 and less 612 8.62% 225 330 46 11 $50,001 $75,000 1,488 20.96% 348 1,003 129 8 $75,001 $125,000 1,705 24.02% 270 1,112 301 22 $125,001 $175,000 944 13.30% 116 501 307 20 $175,001 $225,000 1,004 14.14% 138 341 470 55 $225,001 $325,000 746 10.51% 74 175 374 123 $325,001 and up 8,000 7,000 6,000 5,000 4,000 3,000 2,000 1,000 0 Jun 2009 Dec 2009 Jun 2010 Dec 2010 Jun 2011 Dec 2011 Jun 2012 Dec 2012 Total New Listed Units: Total New Listed Volume: Average New Listed Listing Price: 7,098 1,325,150,530 $166,639 1461 192.72M $131,912 3743 577.79M $154,366 1652 441.74M $267,399 242 112.89M $466,489 pp. 3Reports produced and compiled by Information is deemed reliable but not guaranteed. Does not reflect all market activity.RE STATS Inc. Steve Reese 405-848-9944 steve@oklahomarealtors.com
- 5. Monthly Inventory Analysis The Oklahoma Association of REALTORS® April 2013 ActiveInventory Active Inventory ReadytoBuyorSellRealEstate? ContactanexperiencedREALTOR Data from the Area Delimited by Entire OK State MLS - Single-Family Property Type Active Inventory as of May 12, 2013 Report Produced on: May 13, 2013 END OF APRIL ACTIVE DURING APRIL 5 YEAR MARKET ACTIVITY TRENDS 5yr APR AVG = 23,166 3 MONTHS INVENTORY & BEDROOMS DISTRIBUTION BY PRICE High Low Jul 2011 = 27,607 Dec 2009 = 20,275 Inventory this month at below the 5 yr APR average of 20,567, 23,166 F E B M A R A P R Distribution of Inventory by Price Range % AVDOM 2 Beds 3 Beds 4 Beds 5 Beds+ 2009 22,119 2010 22,778 2011 25,783 2012 24,584 2013 20,567 1 Year 2 Year -16.34% -20.23% 2009 28,151 2010 29,776 2011 31,729 2012 30,935 2013 27,559 1 Year 2 Year -10.91% -13.14% 20,672 20,468 -0.99% 20,567 0.48% 1,878 9.13% 126.5 1,024 746 99 9 $50,000 and less 2,178 10.59% 118.6 843 1,157 150 28 $50,001 $75,000 2,454 11.93% 111.8 705 1,507 226 16 $75,001 $100,000 6,209 30.19% 98.0 1,255 3,886 981 87 $100,001 $175,000 2,561 12.45% 99.5 394 1,255 840 72 $175,001 $225,000 3,070 14.93% 99.4 483 1,034 1,343 210 $225,001 $350,000 2,217 10.78% 118.9 203 465 1,049 500 $350,001 and up 30,000 20,000 10,000 0 Jun 2009 Dec 2009 Jun 2010 Dec 2010 Jun 2011 Dec 2011 Jun 2012 Dec 2012 Total Active Inventory by Units: Total Active Inventory by Volume: Average Active Inventory Listing Price: 20,567 4,118,996,524 $200,272 107.1 4,907 664.45M $135,408 10,050 1.58B $157,154 4,688 1.34B $286,859 922 530.35M $575,218 pp. 4Reports produced and compiled by Information is deemed reliable but not guaranteed. Does not reflect all market activity.RE STATS Inc. Steve Reese 405-848-9944 steve@oklahomarealtors.com
- 6. Monthly Inventory Analysis The Oklahoma Association of REALTORS® April 2013 MonthsSupply Months Supply of Inventory ReadytoBuyorSellRealEstate? ContactanexperiencedREALTOR Data from the Area Delimited by Entire OK State MLS - Single-Family Property Type Active Inventory as of May 12, 2013 Report Produced on: May 13, 2013 MSI FOR APRIL INDICATORS FOR APRIL 2013 5 YEAR MARKET ACTIVITY TRENDS 5yr APR AVG = 7.3 3 MONTHS MONTHS SUPPLY & BEDROOMS DISTRIBUTION BY PRICE High Low Jun 2011 = 9.9 Apr 2013 = 5.9 Months Supply this month at below the 5 yr APR average of 5.9, 7.3 F E B M A R A P R Distribution of Active Inventory by Price Range and MSI % MSI 2 Beds 3 Beds 4 Beds 5 Beds+ 2009 6.8 2010 6.9 2011 9.1 2012 7.9 2013 5.9 1 Year 2 Year -24.79% -35.44% Inventory 20,567 End of Month Active Inventory Closed 41,800 Closed Last 12 Months Absorption 3,483 Average Closed per Month over 12 Months MSI 5.9 Months Supply of Inventory MSI % 16.937% Percent Months Supply of Inventory 6.0 5.9 -1.55% 5.9 -0.53% 1,878 9.13% 4.3 5.5 3.5 3.3 2.4 $50,000 and less 2,716 13.21% 6.8 8.3 6.1 6.4 10.5 $50,001 $80,000 2,609 12.69% 5.7 6.5 5.3 6.2 7.2 $80,001 $110,000 5,194 25.25% 4.9 6.1 4.6 4.9 9.0 $110,001 $170,000 3,455 16.80% 5.9 7.3 5.8 5.3 7.6 $170,001 $240,000 2,586 12.57% 7.0 9.3 7.5 6.0 8.2 $240,001 $360,000 2,129 10.35% 11.9 15.9 12.9 10.3 14.2 $360,001 and up 10 9 8 7 6 5 4 3 2 1 0 Jun 2009 Dec 2009 Jun 2010 Dec 2010 Jun 2011 Dec 2011 Jun 2012 Dec 2012 MSI: Total Active Inventory: 20,567 5.9 6.9 4,907 5.3 10,050 6.1 4,688 10.3 922 pp. 5Reports produced and compiled by Information is deemed reliable but not guaranteed. Does not reflect all market activity.RE STATS Inc. Steve Reese 405-848-9944 steve@oklahomarealtors.com
- 7. Monthly Inventory Analysis The Oklahoma Association of REALTORS® April 2013 AverageDaysonMarket Average Days on Market to Sale ReadytoBuyorSellRealEstate? ContactanexperiencedREALTOR Data from the Area Delimited by Entire OK State MLS - Single-Family Property Type Closed Sales as of May 12, 2013 Report Produced on: May 13, 2013 APRIL YEAR TO DATE (YTD) 5 YEAR MARKET ACTIVITY TRENDS 5yr APR AVG = 85 3 MONTHS AVERAGE DOM OF CLOSED SALES & BEDROOMS DISTRIBUTION BY PRICE High Low Mar 2011 = 98 May 2010 = 74 Average DOM this month at below the 5 yr APR average of 81, 85 F E B M A R A P R Distribution of Average Days on Market to Sale by Price Range % AVDOM 2 Beds 3 Beds 4 Beds 5 Beds+ 2009 88 2010 75 2011 96 2012 84 2013 81 1 Year 2 Year -4.35% -15.63% 2009 90 2010 81 2011 96 2012 91 2013 83 1 Year 2 Year -9.03% -13.56% 87 82 -5.79% 81 -1.92% 152 3.89% 92.8 96.0 96.0 34.8 34.0 $25,000 and less 640 16.36% 78.1 84.9 74.8 72.0 9.0 $25,001 $75,000 424 10.84% 86.6 93.1 83.6 91.8 81.0 $75,001 $100,000 1,064 27.20% 76.6 95.7 72.5 76.3 104.7 $100,001 $150,000 750 19.17% 84.7 115.7 79.4 79.0 107.4 $150,001 $200,000 472 12.07% 76.2 98.8 76.0 68.7 92.5 $200,001 $275,000 410 10.48% 83.1 85.5 71.7 82.6 109.3 $275,001 and up 100 90 80 70 60 50 40 30 20 10 0 Jun 2009 Dec 2009 Jun 2010 Dec 2010 Jun 2011 Dec 2011 Jun 2012 Dec 2012 Average Closed DOM: Total Closed Units: Total Closed Volume: 80.8 3,912 624,939,258 94.4 766 85.52M 76.6 2192 300.60M 76.9 851 199.21M 99.9 103 39.60M pp. 6Reports produced and compiled by Information is deemed reliable but not guaranteed. Does not reflect all market activity.RE STATS Inc. Steve Reese 405-848-9944 steve@oklahomarealtors.com
- 8. Monthly Inventory Analysis The Oklahoma Association of REALTORS® April 2013 AverageListPrice Average List Price at Closing ReadytoBuyorSellRealEstate? ContactanexperiencedREALTOR Data from the Area Delimited by Entire OK State MLS - Single-Family Property Type Closed Sales as of May 12, 2013 Report Produced on: May 13, 2013 APRIL YEAR TO DATE (YTD) 5 YEAR MARKET ACTIVITY TRENDS 5yr APR AVG = 152K 3 MONTHS AVERAGE LIST PRICE OF CLOSED SALES & BEDROOMS DISTRIBUTION BY PRICE High Low Nov 2012 = 168,289 Jan 2010 = 139,108 Average LPrice this month at above the 5 yr APR average of 165,021, 152,234 F E B M A R A P R Distribution of Average List Price at Closing by Price Range % AVL$ 2 Beds 3 Beds 4 Beds 5 Beds+ 2009 144,490 2010 144,883 2011 150,000 2012 156,778 2013 165,021 1 Year 2 Year +5.26% +10.01% 2009 143,088 2010 143,911 2011 148,354 2012 151,102 2013 162,394 1 Year 2 Year +7.47% +9.46% 162,252 165,175 1.80% 165,021 -0.09% 130 3.32% 17,806 19,930 19,748 19,060 21,267 $25,000 and less 621 15.87% 52,735 52,118 58,303 54,468 49,250 $25,001 $75,000 418 10.69% 88,782 92,555 91,276 92,364 89,800 $75,001 $100,000 1,055 26.97% 127,834 130,159 129,458 135,582 134,020 $100,001 $150,000 785 20.07% 174,433 175,668 174,869 180,677 183,981 $150,001 $200,000 468 11.96% 234,806 242,457 235,749 237,890 249,621 $200,001 $275,000 435 11.12% 440,697 432,635 387,897 439,031 648,756 $275,001 and up 200,000 100,000 0 Jun 2009 Dec 2009 Jun 2010 Dec 2010 Jun 2011 Dec 2011 Jun 2012 Dec 2012 Average List Price: Total Closed Units: Total List Volume: $165,021 3,912 645,560,403 $116,386 766 89.15M $141,019 2192 309.11M $241,611 851 205.61M $404,700 103 41.68M pp. 7Reports produced and compiled by Information is deemed reliable but not guaranteed. Does not reflect all market activity.RE STATS Inc. Steve Reese 405-848-9944 steve@oklahomarealtors.com
- 9. Monthly Inventory Analysis The Oklahoma Association of REALTORS® April 2013 AverageSoldPrice Average Sold Price at Closing ReadytoBuyorSellRealEstate? ContactanexperiencedREALTOR Data from the Area Delimited by Entire OK State MLS - Single-Family Property Type Closed Sales as of May 12, 2013 Report Produced on: May 13, 2013 APRIL YEAR TO DATE (YTD) 5 YEAR MARKET ACTIVITY TRENDS 5yr APR AVG = 147K 3 MONTHS AVERAGE SOLD PRICE OF CLOSED SALES & BEDROOMS DISTRIBUTION BY PRICE High Low Nov 2012 = 162,717 Jan 2010 = 133,466 Average SPrice this month at above the 5 yr APR average of 159,749, 146,905 F E B M A R A P R Distribution of Average Sold Price at Closing by Price Range % AVS$ 2 Beds 3 Beds 4 Beds 5 Beds+ 2009 139,301 2010 140,139 2011 143,797 2012 151,537 2013 159,749 1 Year 2 Year +5.42% +11.09% 2009 137,754 2010 138,704 2011 142,058 2012 145,414 2013 157,045 1 Year 2 Year +8.00% +10.55% 155,999 160,181 2.68% 159,749 -0.27% 152 3.89% 16,764 16,990 16,354 17,280 19,467 $25,000 and less 640 16.36% 51,949 48,439 54,560 50,920 47,000 $25,001 $75,000 424 10.84% 87,883 87,812 88,058 87,056 85,438 $75,001 $100,000 1,064 27.20% 127,027 126,018 126,530 131,172 128,857 $100,001 $150,000 750 19.17% 173,361 172,172 171,761 177,309 174,866 $150,001 $200,000 472 12.07% 233,586 236,901 230,978 234,558 237,999 $200,001 $275,000 410 10.48% 430,371 410,341 373,351 420,463 615,741 $275,001 and up 200,000 100,000 0 Jun 2009 Dec 2009 Jun 2010 Dec 2010 Jun 2011 Dec 2011 Jun 2012 Dec 2012 Average Closed Price: Total Closed Units: Total Closed Volume: $159,749 3,912 624,939,258 $111,647 766 85.52M $137,136 2192 300.60M $234,095 851 199.21M $384,478 103 39.60M pp. 8Reports produced and compiled by Information is deemed reliable but not guaranteed. Does not reflect all market activity.RE STATS Inc. Steve Reese 405-848-9944 steve@oklahomarealtors.com
- 10. Monthly Inventory Analysis The Oklahoma Association of REALTORS® April 2013 AverageList/SellPrice Average Percent of List Price to Selling Price ReadytoBuyorSellRealEstate? ContactanexperiencedREALTOR Data from the Area Delimited by Entire OK State MLS - Single-Family Property Type Closed Sales as of May 12, 2013 Report Produced on: May 13, 2013 APRIL YEAR TO DATE (YTD) 5 YEAR MARKET ACTIVITY TRENDS 5yr APR AVG=96.31% 3 MONTHS AVERAGE L/S% OF CLOSED SALES & BEDROOMS DISTRIBUTION BY PRICE High Low Mar 2013 = 97.21% Jan 2011 = 95.15% Average List/Sell this month at above the 5 yr APR average of 96.68%, 96.31% F E B M A R A P R Distribution of $avgmed L/S % by Price Range % AVL/S% 2 Beds 3 Beds 4 Beds 5 Beds+ 2009 96.05% 2010 96.70% 2011 95.62% 2012 96.51% 2013 96.68% 1 Year 2 Year +0.18% +1.11% 2009 95.71% 2010 96.29% 2011 95.49% 2012 95.83% 2013 96.62% 1 Year 2 Year +0.83% +1.19% 95.91% 97.21% 1.35% 96.68% -0.54% 152 3.89% 86.23% 86.83% 85.15% 89.99% 89.19% $25,000 and less 640 16.36% 94.22% 93.65% 94.63% 94.03% 96.57% $25,001 $75,000 424 10.84% 96.42% 95.88% 96.83% 94.98% 95.76% $75,001 $100,000 1,064 27.20% 97.63% 97.01% 97.86% 97.08% 96.95% $100,001 $150,000 750 19.17% 98.21% 98.15% 98.29% 98.26% 95.68% $150,001 $200,000 472 12.07% 98.89% 97.84% 98.15%100.17% 95.86% $200,001 $275,000 410 10.48% 96.85% 95.65% 96.93% 97.11% 96.29% $275,001 and up 98 97 96 95 Jun 2009 Dec 2009 Jun 2010 Dec 2010 Jun 2011 Dec 2011 Jun 2012 Dec 2012 Average List/Sell Ratio: Total Closed Units: Total Closed Volume: 96.70% 3,912 624,939,258 94.95% 766 85.52M 96.89% 2192 300.60M 97.79% 851 199.21M 95.93% 103 39.60M pp. 9Reports produced and compiled by Information is deemed reliable but not guaranteed. Does not reflect all market activity.RE STATS Inc. Steve Reese 405-848-9944 steve@oklahomarealtors.com
- 11. Monthly Inventory Analysis The Oklahoma Association of REALTORS® April 2013 Market Summary Data from the Area Delimited by Entire OK State MLS - Single-Family Property Type Inventory as of May 12, 2013 Report Produced on: May 13, 2013 Inventory Inventory Market Activity Market Activity New Listings Closed Sales Pending Sales Other Off Market Active Inventory Start Inventory Total Inventory Units Volume 7,098 = 25.75% 20,471 27,569 $5,381,565,848 3,912 = 12.43% 4,595 = 14.60% 2,398 = 7.62% 20,567 = 65.35% Absorption: Active Inventory 3,483 20,567 APRIL Year To Date 2012 2013 +/-% 2012 2013 +/-% Last 12 months, an Average of Sales/Month as of April 30, 2013 = Closed Sales Pending Sales New Listings Average List Price Average Sale Price Average Percent of List Price to Selling Price Average Days on Market to Sale Monthly Inventory Months Supply of Inventory 3,489 3,912 12.12% 4,038 4,595 13.79% 6,933 7,098 2.38% 156,778 165,021 5.26% 151,537 159,749 5.42% 96.51% 96.68% 0.18% 84.44 80.76 -4.35% 24,599 20,567 -16.39% 7.85 5.90 -24.83% 11,971 12,799 6.92% 14,445 15,961 10.49% 25,606 25,311 -1.15% 151,102 162,394 7.47% 145,414 157,045 8.00% 95.83% 96.62% 0.83% 91.16 82.93 -9.03% 24,599 20,567 -16.39% 7.85 5.90 -24.83% New Listings Pending Listings List Price Sale Price Active Inventory Monthly Supply of Inventory % of List to Sale Price Days on Market to Sale 2012 2013 2012 2013 2012 2013 2012 2013 APRIL MARKET AVERAGE PRICES INVENTORY AVERAGE L/S% & DOM 6,933 4,038 7,098 +2.38% 4,595 +13.79% 156,778 151,537 165,021 +5.26% 159,749 +5.42% 24,599 7.85 20,567 -16.39% 5.90 -24.83% 96.51% 84.4496.68% +0.18% 80.76 -4.35% pp. 10Reports produced and compiled by Information is deemed reliable but not guaranteed. Does not reflect all market activity.RE STATS Inc. Steve Reese 405-848-9944 steve@oklahomarealtors.com