
Recomendados
Mais conteúdo relacionado
Semelhante a Factory production analysis for NAFA-1 in February 2021
Semelhante a Factory production analysis for NAFA-1 in February 2021 (20)
Mais de Nittamallik216
Mais de Nittamallik216 (20)
Último
Último (20)
Factory production analysis for NAFA-1 in February 2021
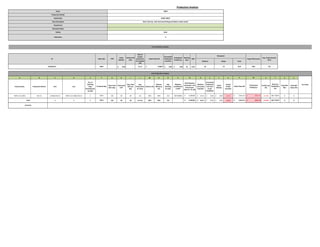
- 1. $ 8.90 Tk 15 $ 8.84 $ 0.06 10 6.99 1 1 A B C D E G H I L M N O P R S T U X Z Z Factory Name Production Month Unit Line No. of Working Days Including Set- up days Total Used M/C days Total Used H/P Avg. Used M/C per Day Avg. Production/ Hr. (Pcs) Achieve (%) Achieve Efficiency (%) Avg. Working Hr./Day Machine Cost/Month in BDT Machine Consumed Cost/Dzn Forecasted Production Cost /Dzn as per Feasibility Initial CM/Dzn Actual Profit/ Loss/Dzn Profit/ Loss (%) Total NPT Min Total NPT Value (Tk) NAFA-1 (U-2&3) Feb-21 U-2&3),Feb-21 NAFA-1 (U-2&3),Feb-21 5 101 30 20 111 85% 49% 8.8 BDT 90000 10.51 $ 8.84 $ 8.90 $ (1.61) -15.34% 0 0 1 1 5 101 30 20 111 Pcs 85% 49% 8.8 10.51 $ 8.84 $ 8.90 $ (1.61) -15.34% 0 0 BDT 76197 Rate of surplus production not shipped (TK) Forecasted Production Cost/Dzn Anticipated Profit/Loss Machine 26 Helper 7.8 Total 33.8 58% Manpower Target Efficiency% Avg. Production/Hr. (Pcs) 167 Post Production Analysis 3,614.14 $ Y Revenue TK/MC/Mo nth BDT 76197 (654.72) $ W V Initial Total CM 3,614.14 $ Total Coments: FOB Initial CM/Dzn Relized CM /Dzn Production Analysis Buyer H&M Production Month Fabrication Total Actual Profit/Loss (654.72) $ Working Hour SMV Department Merchant Name 0 F Re-marks Pre-Production Analysis 4873 ROMY BODY 4,268.86 $ Q Produced Qty Total Machine Consumed Cost (Conversion Rate $1= Tk. 82) 4873 4,268.86 $ Style/Order Item Description Styling Basic Tank top with neck and binding and bottom elastic attach Basic 35 FEASIBILITY 4839 $ 3,588.9 Order Qty Initial Total CM