
Recommended
Recommended
More Related Content
Viewers also liked
Viewers also liked (8)
More from Nicolasbruxelles
More from Nicolasbruxelles (6)
Recently uploaded
Recently uploaded (20)
The European Union environmental policy agenda (December 2008)
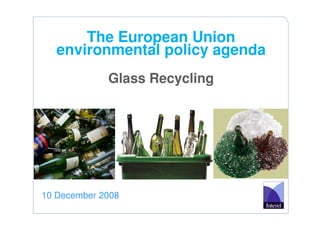
- 1. The European Union environmental policy agenda Glass Recycling 10 December 2008
- 2. Threats to Human Health Threats to Biodiversity Climate Change Degradation Pollution air, water, soil… Green House Depletion Gasses Resources Unsustainable Population growth Economic growth Production & Spending power Consumption Market Prices do not Distortions reflect costs Biased Unbalanced Fixed Information Markets behaviour of consumers
- 3. Policies across the Life-Cycle of Products Natural Natural Better Resources Resources Design Products Reuse, Recycling, Manufacturing Disposal Recovery Leaner Production Collection Distribution Waste & Recycling Use Smarter Consumption
- 4. Recent policy responses • New waste legislation • Energy & climate change package • Sustainable Production and Consumption Action Plan and Sustainable Industrial Policy • Raw Materials Initiative • Reviews of Sustainable Development Strategy
- 5. Waste & Recycling the European legislation • Stricter waste hierarchy • Household waste: 50% by weight by 2015 (paper, metal, plastic & glass) • 2015 separate collection must be set up for at least the following: paper, metal, plastic & glass • Emphasis on prevention • Packaging: 55 to 80%
- 6. The French example The approach: Consumers voluntarily return their glass packaging to bottle banks Producer responsibility: The producer pays a tax to the French system “eco-emballage” (0,36 Euro per kilo of glass) Around 60% of glass package is collected 75% of this collected glass in recycled Evolution of the glass collected (in KT)
- 7. The German example The approach: Deposit on one-way beverage containers & refillables deposit Producer responsibility: According to packaging legislation, manufacturers and distributors are obliged to take back all packaging sold in Germany and to have it recycled. Results of the German one-way deposit: Refillable quota for beer: 85% Mineral water and soft drinks: 34-37% Reference: Juices without deposit < 10%
- 8. The German example Wholesalers for beverages Mineral springs and bottlers Collection from retailers Cleaning and bottling Recirculation of empties to mineral springs / bottlers Retailers Wholesalers for beverages Take back of bottles / crates Purchase / pick up Pre-sorting Storage Consignment sale Distribution Consumers Retailers Allocation and sale Buy at point of sale Return of bottles
- 9. The Belgium example The approach: Consumers voluntarily return their glass packaging to glass collection points (+/- 1 site for 1.000 inhabitants) Producer responsibility: For all packaging, obligation of 80% of valorisation and of 50% of recycling. Every three years, companies have to present waste prevention plan Around 99% of glass package is recycled
- 10. The Belgium example Quantities of packaging waste generated in the Member State and recovered or incinerated at waste incineration plants with energy recovery in Belgium in 2006 Recovered or incinerated at waste incineration plants with energy recovery by Rate of recovery or Recycling Packaging waste incineration at waste rate Total recovery and incineration plants Other forms of Incineration at waste generated Other forms of Energy incineration at waste (%) Material recycling Total recycling with energy recovery incineration plants with incineration plants with recycling recovery recovery energy recovery energy recovery Material Glass 385.312 384.371 0 384.371 0 0 0 384.371 99,8 99,8 Plastic 302.334 116.585 0 116.585 2.604 0 138.383 257.572 38,6 85,2 Paper and board 635.316 565.996 0 565.996 183 0 39.102 605.281 89,1 95,3 Total 135.685 126.508 0 126.508 0 0 0 126.508 93,2 93,2 Metals Aluminium 0 0 0 0 Steel 0 0 0 0 Wood 191.053 121.879 0 121.879 12.123 0 57.051 191.053 63,8 100,0 Other 15.833 442 0 442 343 0 8.018 8.803 2,8 55,6 Total 1.665.533 1.315.781 0 1.315.781 15.253 0 242.554 1.573.588 79,0 94,5