Recomendados

Recomendados
Mais conteúdo relacionado
Semelhante a GPS TEC measurements over Purulia, West Bengal,India
Semelhante a GPS TEC measurements over Purulia, West Bengal,India (20)
Último
Último (20)
GPS TEC measurements over Purulia, West Bengal,India
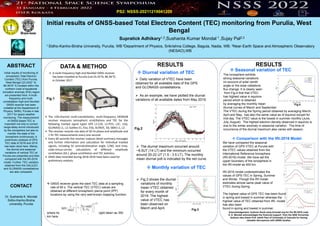
- 1. Initial results of GNSS-based Total Electron Content (TEC) monitoring from Purulia, West Bengal Supratick Adhikary1,2,Sushanta Kumar Mondal 1 ,Sujay Pal2,3 ABSTRACT Initial results of monitoring of ionospheric Total Electron Content (TEC) from Purulia, West Bengal (23.3322° N, 86.3616° E) located within the northern crest of equatorial ionization anomaly (EIA) region are presented here. A multi- frequency and multi- constellation high-end NovAtel GNSS receiver has been installed at the Department of Physics, SKBU, Purulia in late 2017 for space weather monitoring. The measurement of GNSS-based TEC is important not only to correct range-delay errors introduced by the ionosphere but also to monitor the state of the ionosphere continuously. A preliminary analysis of GPS TEC data of 2018 and 2019 has been done here. Mainly, the diurnal and seasonal variations of vertical TEC at Purulia are presented and then compared with the IRI-2016 model. Further, TEC variation obtained from the GALILEO and GLONASS constellations are also compared. CONTACT Dr. Sushanta K. Mondal Sidho-Kanho-Birsha university, Purulia 1 Sidho-Kanho-Birsha University, Purulia, WB 2Department of Physics, Srikrishna College, Bagula, Nadia, WB; 3Near-Earth Space and Atmospheric Observatory (NESAO),WB PS2: NSSS-20211219041200 DATA & METHOD RESULTS A multi-frequency high end NovAtel GNSS receiver has been installed at Purulia (Lat:23.33N, 86.36E) in October 2017. The 120-channel multi-constellation, multi-frequency OEM628 receiver measures ionospheric scintillations and TEC for the following tracked signal types GPS L1-C/A, L2-P(Y), L2C, L5Q; GLONASS L1, L2; Galileo E1, E5a, E5b, ALTBOC, E6; SBAS L1, L2. The receiver records raw data of 50 Hz phase and amplitude and 1 Hz TEC measurements every one second. Every 60 seconds the receiver outputs detail summary messages and further information and calculation for individual tracked signals, including SV azimuth/elevation angle, C/N0, lock time, code-minus-carrier, calculations of different amplitude scintillation (S4 ), phase scintillation and TEC statistics. GNSS data recorded during 2018-2019 have been used for preliminary analysis. Diurnal variation of TEC GNSS receiver gives the slant TEC data at a sampling rate of 60 s. The vertical TEC (VTEC) values are obtained at different ionospheric pierce point (IPP) locations by using the very well-known mapping function: where hs is the effective ionospheric height taken as 350 km here. Daily variation of VTEC have been obtained for all available data of the GPS and GLONASS constellations. As an example, we have plotted the diurnal variations of all available dates from May 2019. Comparison with the IRI-2016 Model RESULTS The diurnal maximum occurred around ~8.5UT (14 LT) and the minimum occurred around 20-22 UT (1.5 - 3.5 LT). The monthly mean diurnal polt is indicated by the red curve. Monthly variation of TEC Fig.1 Fig.2 Fig.4 Seasonal variation of TEC Fig.3 Fig.3 shows the diurnal variations of monthly mean VTEC obtained for every month of 2019. The highest value of VTEC has been observed on March and April.onth. The ionosphere exhibits strong seasonal variations on account of solar zenith angle or the solar radiations flux change. It is clearly seen from Fig.4 that that VTEC has highest value in equinox period which is obtained by averaging the monthly mean diurnal curves of March and September. The VTEC during the Spring period obtained by averaging March, April and May, has also the same value as of equinox excpet for mid-day. The VTEC value is the lowest in summer months (June, July, August). The highest electron density observed in equinox is due to the winter anomaly in seasonal variation. The time of occurrence of the diurnal maximum also varies with season. We have compared the seasonal variation of GPS VTEC at Purulia with the VTEC values obtained from the International Reference Ionosphere (IRI-2016) model. We have set the upper boundary of the ionosphere in the IRI-model as 400 km. IRI-2016 model underestimates the values of GPS-TEC in Spring, Summer and Winter. Though the IRI model estimates almost same peak value of VTEC during Spring. The highest value of GPS TEC has been found in spring and lowest in summer whereas the highest value of TEC obtained from IRI- model has also been found in spring and lowest in summer. Acknowledgement: Authors thank www.irimodel.org for the IRI-2016 code. S. K. Mondal acknowledges the financial support from the SKB University. Authors also thank Prof. Ashik Paul of University of Calcutta for having valuable discussions with GNSS studies.