SlideShare a Scribd company logo
What is data?


Why do people want to collect data?
                               Surveys & Line Plots: Lesson 1 (revised 2009)
                               Investigation 1, session 1.4


               What is data?
Let's collect some data!


 Are you wearing red?


                                   Surveys & Line Plots: Lesson 1 (revised 2009)
                                   Investigation 1, session 1.4


      Collect data: wearing red?
Are you wearing red?


                       Let's record with tally marks!


Wearing red


Not wearing red


                                                          Surveys & Line Plots: Lesson 1 (revised 2009)
                                                          Investigation 1, session 1.4


                           Frequency table: wearing red
How do people show data?


    picto
             graph                                                      gr aph
                                                                  bar

                                                           freq
                                                                uenc
       c   hart                                                         y tab
                                                                             le
                                         line plot
Click to see a video about graphs.              What is a Graph?


                                                                           Surveys & Line Plots: Lesson 1
                                                                           Investigation 1, session 1.4


                                     How do people show data?
Bar Graphs
A bar graph is a tool to compare data.


   Click to see a video about bar graphs.
    Bar Graphs.mov


                                             Surveys & Line Plots: Lesson 1 (revised 2009)
                                             Investigation 1, session 1.4


           Bar Graph: tool to compare data
Parts of a Bar Graph
                                                   Shoe Sizes in Our Team                    Title
 Scale                          24 _
                                22 _
                                20 _
                                18 _
                                16 _
                                14 _
           Number of Students


                                12 _
                                10 _
                                 8_
                                 6_
                                 4_                                                          Bars
                                 2_
                                 0
Labels                                 1   2   3     4      5    6 7 8
                                                             Shoe Size
                                                                            9   10 11   12


         What is the scale of this bar graph?
    Remember: scale should be larger than 1


                                                         Bar graph: parts
What shoe size is worn by 14 students in the team?
Answer: _________
                                              Shoe Sizes in our Team
                           24 _
                           22 _
                           20 _
      Number of Students


                              _
                           18
                              _
                           16
                              _
                           14
                              _
                           12
                           10 _
                            8_
                              _
                            6
                            4_
                            2_

                                  1   2   3     4    5     6 7 8 9          10 11          12
                                                      Shoe Size
                                                                            Surveys & Line Plots: Lesson 1 (revised 2009)
                                                                            Investigation 1, session 1.4


                                               Practice reading bar graph
How many students in the team wear size 6 shoes?
Answer: _________
                                               Shoe Sizes in our Team
                            24 _
                            22 _
                               _
                            20
       Number of Students


                               _
                            18
                               _
                            16
                               _
                            14
                               _
                            12
                            10 _
                             8_
                               _
                             6
                             4_
                             2_

                                   1   2   3     4   5   6   7     8 9   10 11     12
                                                     Shoe Size

                                                                           Surveys & Line Plots: Lesson 1 (revised 2009)
                                                                           Investigation 1, session 1.4


                                                     Practice #2
How many students in the team wear size 4 shoes?
Answer: _________
                                                 Shoe Sizes in our Team
                              24 _
                              22 _
                              20 _
         Number of Students


                                 _
                              18
                              16 _
                                 _
                              14
                              12 _
                              10 _
                               8_
                               6_
                               4_
                               2_

                                     1   2   3     4     5   6 7 8 9      10 11       12
                                                         Shoe Size

                                                                          Surveys & Line Plots: Lesson 1 (revised 2009)
                                                                          Investigation 1, session 1.4


                                                       Practice #3
1
    What shoe size is worn by 14 students in the team?
    Answer: _________
        Surveys & Line Plots: Lesson 1 (revised 2009)
        Investigation 1, session 1.4               Shoe Sizes in our Team
                               24 _
                               22 _
                               20 _
          Number of Students


                               18 _
                               16 _
                                  _
                               14
                               12 _
                               10 _
                                8_
                                  _
                                6
                                4_
                                2_

                                      1   2    3        4   5    6    7 8 9   10 11      12
                                                            Shoe Size

                                                                                Surveys & Line Plots: Lesson 1 (revised 2009)
                                                                                Investigation 1, session 1.4


                                                                Practice #4
What is the scale of this bar graph?


Large numbers: big scale                           Surveys & Line Plots: Lesson 1 (revised 2009)
                                                   Investigation 1, session 1.4


             What is the scale of the bar graph?
You need to think about the numbers
when you choose a scale for a graph.


   Big numbers: big scale


             Small numbers: small scale


                                                 Surveys & Line Plots: Lesson 1 (revised 2009)
                                                 Investigation 1, session 1.4


    Big numbers: big scale; small: small scale
Are you wearing red?

                       We only have two choices.
                       We have smaller numbers.
                       What would be a good scale for a bar graph?


  Wearing red


  Not wearing red


                                                                       Surveys & Line Plots: Lesson 1 (revised 2009)
                                                                       Investigation 1, session 1.4


                           What would be a good scale for our graph?
Add the scale and bars to the bar graph.
Check on next slide.

                           Are you wearing red?
   Number of Students


                           Wearing red                Not wearing red
                                                                    Surveys & Line Plots: Lesson 1 (revised 2009)
                                                                    Investigation 1, session 1.4


                                Create Bar Graph: Wearing Red
Are you wearing red?
                     24
                     22
                     20
Number of Students


                     18
                     16
                     14
                     12
                     10
                     8
                     6
                     4
                     2
                     0
                          Wearing red              Not wearing red
                            Clothing color choices              Surveys & Line Plots: Lesson 1 (revised 2009)
                                                                Investigation 1, session 1.4


                             Create Bar Graph: Wearing Red
Creepy Crawlers


Class Activity
Place a tally mark next to your favorite creature.
                                                   Total

       Fly

       Spider

       Ladybug

       Grasshopper

       Caterpillar


                     Creepy Crawlers tally chart
Name:______________                                                      Date:______________
Bar graph                                Title: _____________
 Label: _____________________


                                Scale:


                                          Label: _____________________

                                                                             Surveys & Line Plots: Lesson 1 (revised 2009)
                                                                             Investigation 1, session 1.4


                                                 Bar graph template
Name:______________                                                                     Date:______________
Bar graph                                              Favorite Creatures
                                                Title: _____________
            Number of Votes
 Label: _____________________


                                  15
                                  12
                                     9
                                     6
                                     3
                                     0                                        Grasshopper
                                         Fly   Spider       Ladybug                         Caterpillar
                                Scale:


                                                              Creatures
                                                  Label: _____________________

                                                                                              Surveys & Line Plots: Lesson 1 (revised 2009)
                                                                                              Investigation 1, session 1.4


                                                        Create Bar Graph: Wearing Red
Today's Task: Create a Bar Graph

Show the data we collected about Creepy Crawlers.


Do both sides of the worksheet your teacher gives you.


                                        Surveys & Line Plots: Lesson 1 (revised 2009)
                                        Investigation 1, session 1.4


                      Today's Task

More Related Content

More from MrsHarper

Vincent van gogh
Vincent van goghVincent van gogh
Vincent van gogh
MrsHarper
 
Shaun White By Alex
Shaun White By AlexShaun White By Alex
Shaun White By Alex
MrsHarper
 
Anne Frank by Gianna
Anne Frank by GiannaAnne Frank by Gianna
Anne Frank by Gianna
MrsHarper
 
Theodore Roosevelt by Logan
Theodore Roosevelt by LoganTheodore Roosevelt by Logan
Theodore Roosevelt by Logan
MrsHarper
 
Thomas Edison By Brock
Thomas Edison By BrockThomas Edison By Brock
Thomas Edison By Brock
MrsHarper
 
HarrietTubman
HarrietTubman HarrietTubman
HarrietTubman
MrsHarper
 
Mia hamm taylor
Mia hamm taylorMia hamm taylor
Mia hamm taylor
MrsHarper
 
Brendan Benjamin Franklin
Brendan Benjamin FranklinBrendan Benjamin Franklin
Brendan Benjamin Franklin
MrsHarper
 
Jordan benjamin franklin
 Jordan benjamin franklin Jordan benjamin franklin
Jordan benjamin franklin
MrsHarper
 
Midori Brilliant
Midori BrilliantMidori Brilliant
Midori Brilliant
MrsHarper
 
Eli harriet tubman
Eli harriet tubmanEli harriet tubman
Eli harriet tubman
MrsHarper
 
Amelia earhart angelina
Amelia earhart angelinaAmelia earhart angelina
Amelia earhart angelina
MrsHarper
 
Anna benjamin franklin
Anna benjamin franklinAnna benjamin franklin
Anna benjamin franklin
MrsHarper
 
Albert Einstein
Albert EinsteinAlbert Einstein
Albert Einstein
MrsHarper
 
Amelia earhart
Amelia earhartAmelia earhart
Amelia earhart
MrsHarper
 
Albert Einstein
Albert EinsteinAlbert Einstein
Albert Einstein
MrsHarper
 

More from MrsHarper (20)

Vincent van gogh
Vincent van goghVincent van gogh
Vincent van gogh
 
Pocahontas
PocahontasPocahontas
Pocahontas
 
Shaun White By Alex
Shaun White By AlexShaun White By Alex
Shaun White By Alex
 
Anne Frank by Gianna
Anne Frank by GiannaAnne Frank by Gianna
Anne Frank by Gianna
 
Theodore Roosevelt by Logan
Theodore Roosevelt by LoganTheodore Roosevelt by Logan
Theodore Roosevelt by Logan
 
Thomas Edison By Brock
Thomas Edison By BrockThomas Edison By Brock
Thomas Edison By Brock
 
HarrietTubman
HarrietTubman HarrietTubman
HarrietTubman
 
Mia Hamm
Mia HammMia Hamm
Mia Hamm
 
Mia hamm taylor
Mia hamm taylorMia hamm taylor
Mia hamm taylor
 
Brendan Benjamin Franklin
Brendan Benjamin FranklinBrendan Benjamin Franklin
Brendan Benjamin Franklin
 
Jordan benjamin franklin
 Jordan benjamin franklin Jordan benjamin franklin
Jordan benjamin franklin
 
Midori Brilliant
Midori BrilliantMidori Brilliant
Midori Brilliant
 
Eli harriet tubman
Eli harriet tubmanEli harriet tubman
Eli harriet tubman
 
Amelia earhart angelina
Amelia earhart angelinaAmelia earhart angelina
Amelia earhart angelina
 
Anna benjamin franklin
Anna benjamin franklinAnna benjamin franklin
Anna benjamin franklin
 
Squanto
SquantoSquanto
Squanto
 
Albert Einstein
Albert EinsteinAlbert Einstein
Albert Einstein
 
Amelia earhart
Amelia earhartAmelia earhart
Amelia earhart
 
Anne frank1
Anne frank1Anne frank1
Anne frank1
 
Albert Einstein
Albert EinsteinAlbert Einstein
Albert Einstein
 

Recently uploaded

IATP How-to Foreign Travel May 2024.pdff
IATP How-to Foreign Travel May 2024.pdffIATP How-to Foreign Travel May 2024.pdff
IATP How-to Foreign Travel May 2024.pdff
17thcssbs2
 
Industrial Training Report- AKTU Industrial Training Report
Industrial Training Report- AKTU Industrial Training ReportIndustrial Training Report- AKTU Industrial Training Report
Industrial Training Report- AKTU Industrial Training Report
Avinash Rai
 

Recently uploaded (20)

Gyanartha SciBizTech Quiz slideshare.pptx
Gyanartha SciBizTech Quiz slideshare.pptxGyanartha SciBizTech Quiz slideshare.pptx
Gyanartha SciBizTech Quiz slideshare.pptx
 
IATP How-to Foreign Travel May 2024.pdff
IATP How-to Foreign Travel May 2024.pdffIATP How-to Foreign Travel May 2024.pdff
IATP How-to Foreign Travel May 2024.pdff
 
INU_CAPSTONEDESIGN_비밀번호486_업로드용 발표자료.pdf
INU_CAPSTONEDESIGN_비밀번호486_업로드용 발표자료.pdfINU_CAPSTONEDESIGN_비밀번호486_업로드용 발표자료.pdf
INU_CAPSTONEDESIGN_비밀번호486_업로드용 발표자료.pdf
 
2024_Student Session 2_ Set Plan Preparation.pptx
2024_Student Session 2_ Set Plan Preparation.pptx2024_Student Session 2_ Set Plan Preparation.pptx
2024_Student Session 2_ Set Plan Preparation.pptx
 
Basic Civil Engg Notes_Chapter-6_Environment Pollution & Engineering
Basic Civil Engg Notes_Chapter-6_Environment Pollution & EngineeringBasic Civil Engg Notes_Chapter-6_Environment Pollution & Engineering
Basic Civil Engg Notes_Chapter-6_Environment Pollution & Engineering
 
Salient features of Environment protection Act 1986.pptx
Salient features of Environment protection Act 1986.pptxSalient features of Environment protection Act 1986.pptx
Salient features of Environment protection Act 1986.pptx
 
The Last Leaf, a short story by O. Henry
The Last Leaf, a short story by O. HenryThe Last Leaf, a short story by O. Henry
The Last Leaf, a short story by O. Henry
 
How to Split Bills in the Odoo 17 POS Module
How to Split Bills in the Odoo 17 POS ModuleHow to Split Bills in the Odoo 17 POS Module
How to Split Bills in the Odoo 17 POS Module
 
Incoming and Outgoing Shipments in 2 STEPS Using Odoo 17
Incoming and Outgoing Shipments in 2 STEPS Using Odoo 17Incoming and Outgoing Shipments in 2 STEPS Using Odoo 17
Incoming and Outgoing Shipments in 2 STEPS Using Odoo 17
 
Sha'Carri Richardson Presentation 202345
Sha'Carri Richardson Presentation 202345Sha'Carri Richardson Presentation 202345
Sha'Carri Richardson Presentation 202345
 
NCERT Solutions Power Sharing Class 10 Notes pdf
NCERT Solutions Power Sharing Class 10 Notes pdfNCERT Solutions Power Sharing Class 10 Notes pdf
NCERT Solutions Power Sharing Class 10 Notes pdf
 
Sectors of the Indian Economy - Class 10 Study Notes pdf
Sectors of the Indian Economy - Class 10 Study Notes pdfSectors of the Indian Economy - Class 10 Study Notes pdf
Sectors of the Indian Economy - Class 10 Study Notes pdf
 
How to Manage Notification Preferences in the Odoo 17
How to Manage Notification Preferences in the Odoo 17How to Manage Notification Preferences in the Odoo 17
How to Manage Notification Preferences in the Odoo 17
 
Pragya Champions Chalice 2024 Prelims & Finals Q/A set, General Quiz
Pragya Champions Chalice 2024 Prelims & Finals Q/A set, General QuizPragya Champions Chalice 2024 Prelims & Finals Q/A set, General Quiz
Pragya Champions Chalice 2024 Prelims & Finals Q/A set, General Quiz
 
Telling Your Story_ Simple Steps to Build Your Nonprofit's Brand Webinar.pdf
Telling Your Story_ Simple Steps to Build Your Nonprofit's Brand Webinar.pdfTelling Your Story_ Simple Steps to Build Your Nonprofit's Brand Webinar.pdf
Telling Your Story_ Simple Steps to Build Your Nonprofit's Brand Webinar.pdf
 
[GDSC YCCE] Build with AI Online Presentation
[GDSC YCCE] Build with AI Online Presentation[GDSC YCCE] Build with AI Online Presentation
[GDSC YCCE] Build with AI Online Presentation
 
Operations Management - Book1.p - Dr. Abdulfatah A. Salem
Operations Management - Book1.p  - Dr. Abdulfatah A. SalemOperations Management - Book1.p  - Dr. Abdulfatah A. Salem
Operations Management - Book1.p - Dr. Abdulfatah A. Salem
 
Industrial Training Report- AKTU Industrial Training Report
Industrial Training Report- AKTU Industrial Training ReportIndustrial Training Report- AKTU Industrial Training Report
Industrial Training Report- AKTU Industrial Training Report
 
Advances in production technology of Grapes.pdf
Advances in production technology of Grapes.pdfAdvances in production technology of Grapes.pdf
Advances in production technology of Grapes.pdf
 
An Overview of the Odoo 17 Discuss App.pptx
An Overview of the Odoo 17 Discuss App.pptxAn Overview of the Odoo 17 Discuss App.pptx
An Overview of the Odoo 17 Discuss App.pptx
 

Unit 2 session 1.4: Bar Graphs

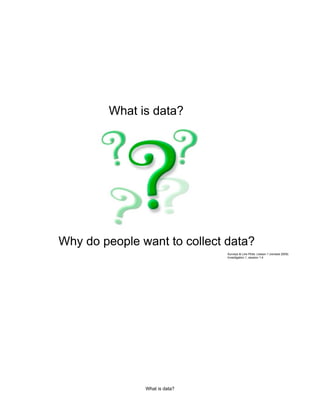
  • 1. What is data? Why do people want to collect data? Surveys & Line Plots: Lesson 1 (revised 2009) Investigation 1, session 1.4 What is data?
  • 2. Let's collect some data! Are you wearing red? Surveys & Line Plots: Lesson 1 (revised 2009) Investigation 1, session 1.4 Collect data: wearing red?
  • 3. Are you wearing red? Let's record with tally marks! Wearing red Not wearing red Surveys & Line Plots: Lesson 1 (revised 2009) Investigation 1, session 1.4 Frequency table: wearing red
  • 4. How do people show data? picto graph gr aph bar freq uenc c hart y tab le line plot Click to see a video about graphs. What is a Graph? Surveys & Line Plots: Lesson 1 Investigation 1, session 1.4 How do people show data?
  • 5. Bar Graphs A bar graph is a tool to compare data. Click to see a video about bar graphs. Bar Graphs.mov Surveys & Line Plots: Lesson 1 (revised 2009) Investigation 1, session 1.4 Bar Graph: tool to compare data
  • 6. Parts of a Bar Graph Shoe Sizes in Our Team Title Scale 24 _ 22 _ 20 _ 18 _ 16 _ 14 _ Number of Students 12 _ 10 _ 8_ 6_ 4_ Bars 2_ 0 Labels 1 2 3 4 5 6 7 8 Shoe Size 9 10 11 12 What is the scale of this bar graph? Remember: scale should be larger than 1 Bar graph: parts
  • 7. What shoe size is worn by 14 students in the team? Answer: _________ Shoe Sizes in our Team 24 _ 22 _ 20 _ Number of Students _ 18 _ 16 _ 14 _ 12 10 _ 8_ _ 6 4_ 2_ 1 2 3 4 5 6 7 8 9 10 11 12 Shoe Size Surveys & Line Plots: Lesson 1 (revised 2009) Investigation 1, session 1.4 Practice reading bar graph
  • 8. How many students in the team wear size 6 shoes? Answer: _________ Shoe Sizes in our Team 24 _ 22 _ _ 20 Number of Students _ 18 _ 16 _ 14 _ 12 10 _ 8_ _ 6 4_ 2_ 1 2 3 4 5 6 7 8 9 10 11 12 Shoe Size Surveys & Line Plots: Lesson 1 (revised 2009) Investigation 1, session 1.4 Practice #2
  • 9. How many students in the team wear size 4 shoes? Answer: _________ Shoe Sizes in our Team 24 _ 22 _ 20 _ Number of Students _ 18 16 _ _ 14 12 _ 10 _ 8_ 6_ 4_ 2_ 1 2 3 4 5 6 7 8 9 10 11 12 Shoe Size Surveys & Line Plots: Lesson 1 (revised 2009) Investigation 1, session 1.4 Practice #3
  • 10. 1 What shoe size is worn by 14 students in the team? Answer: _________ Surveys & Line Plots: Lesson 1 (revised 2009) Investigation 1, session 1.4 Shoe Sizes in our Team 24 _ 22 _ 20 _ Number of Students 18 _ 16 _ _ 14 12 _ 10 _ 8_ _ 6 4_ 2_ 1 2 3 4 5 6 7 8 9 10 11 12 Shoe Size Surveys & Line Plots: Lesson 1 (revised 2009) Investigation 1, session 1.4 Practice #4
  • 11. What is the scale of this bar graph? Large numbers: big scale Surveys & Line Plots: Lesson 1 (revised 2009) Investigation 1, session 1.4 What is the scale of the bar graph?
  • 12. You need to think about the numbers when you choose a scale for a graph. Big numbers: big scale Small numbers: small scale Surveys & Line Plots: Lesson 1 (revised 2009) Investigation 1, session 1.4 Big numbers: big scale; small: small scale
  • 13. Are you wearing red? We only have two choices. We have smaller numbers. What would be a good scale for a bar graph? Wearing red Not wearing red Surveys & Line Plots: Lesson 1 (revised 2009) Investigation 1, session 1.4 What would be a good scale for our graph?
  • 14. Add the scale and bars to the bar graph. Check on next slide. Are you wearing red? Number of Students Wearing red Not wearing red Surveys & Line Plots: Lesson 1 (revised 2009) Investigation 1, session 1.4 Create Bar Graph: Wearing Red
  • 15. Are you wearing red? 24 22 20 Number of Students 18 16 14 12 10 8 6 4 2 0 Wearing red Not wearing red Clothing color choices Surveys & Line Plots: Lesson 1 (revised 2009) Investigation 1, session 1.4 Create Bar Graph: Wearing Red
  • 16. Creepy Crawlers Class Activity Place a tally mark next to your favorite creature. Total Fly Spider Ladybug Grasshopper Caterpillar Creepy Crawlers tally chart
  • 17. Name:______________ Date:______________ Bar graph Title: _____________ Label: _____________________ Scale: Label: _____________________ Surveys & Line Plots: Lesson 1 (revised 2009) Investigation 1, session 1.4 Bar graph template
  • 18. Name:______________ Date:______________ Bar graph Favorite Creatures Title: _____________ Number of Votes Label: _____________________ 15 12 9 6 3 0 Grasshopper Fly Spider Ladybug Caterpillar Scale: Creatures Label: _____________________ Surveys & Line Plots: Lesson 1 (revised 2009) Investigation 1, session 1.4 Create Bar Graph: Wearing Red
  • 19. Today's Task: Create a Bar Graph Show the data we collected about Creepy Crawlers. Do both sides of the worksheet your teacher gives you. Surveys & Line Plots: Lesson 1 (revised 2009) Investigation 1, session 1.4 Today's Task