SlideShare a Scribd company logo
1 of 8
Download to read offline
SOURCE: WEST AFRICA EXAMINATION COUNCIL, GHANA.
ANALYSIS OF 2012 AND 2013 CORE AND ELECTIVE MATHEMATICS WASSCE RESULTS-Ghana
By: Miracule D Gavor, Exec. Dir. Vedic Math Ghana.
STUDENT’S PARTICIPATION IN 2012 ELECTIVE MATHEMATICS
 A total of 60098 students registered for the 2012 May/June WASSCE Elective Mathematics
examination, out of which 42472 were males and 17626 were females.
 But in the end 59400 sat for the paper, out of this, 17458 were females and 41942 were males.
 698 did not write the examination.
 44619 students obtained credit and above grades (i.e. students who had C6 and above) which
represents75.1% of the total score ,out of which 31292 which represents 52.7% were males and
13327 representing 22.4% were females.
 10653 students passed the examination (i.e. students obtained D7 and E8), this represents
17.8% and out of which 2966 representing 5% were females and 7687 representing 12.8% were
males.
 4019 students failed (i.e. students who had F9) representing 6.7%, of which 1148 representing
4.8% were females and 2871 representing 1.9% were males.
0
5000
10000
15000
20000
25000
30000
35000
40000
45000
50000
A1 - C6 D7 - E8 F9
MALE
FEMALE
TOTAL
SOURCE: WEST AFRICA EXAMINATION COUNCIL, GHANA.
STUDENT’S PARTICIPATION 2013 ELECTIVE MATHEMATICS
 135404 students registered for the 2013 WASSCE Elective Mathematics examination out 94637
were males and 40767 were females.
 But 133891 out of the students who registered for the examination did sit for the paper of
which 94619 were males and 40423 females.
 1513 did not write the exams
 63105 students obtained grades A1 to C6 (i.e. credit and above grades) which represents 47.1%.
Out of this, 44554 representing 33.3% were males and 18551 which is 13.8% were females.
 40712 student obtained grades between D7 and E8 (i.e. pass grades) this represents 30.3% and
out of this, 12478 which represents 9.3% were females and 28234 representing 21.0% were
males.
 30074 students failed the examination (i.e. students who had F9) representing 22.4% and out of
which 9394 were females which represents 7% and 20680 representing 15.4% were males.
COMPARISON OF PERFORMANCE BETWEEN 2012 AND 2013 ELECTIVE MATHEMATICS
0
10000
20000
30000
40000
50000
60000
70000
A1 - C6 D7 - E8 F9
MALE
FEMALE
TOTAL
SOURCE: WEST AFRICA EXAMINATION COUNCIL, GHANA.
 Results from the 2012 WASSCE was fairly good with majority of the students passing the
examination with just a few students failing.
 Many students sat for the 2013 Elective Mathematics examination, none the less, the
performance was poor as compared to the 2012 results.
 Students who failed in the 2013 elective mathematics were greater than those who passed.
 Performance on gender basis was almost similar as both males and females had similar passes
and failures in the 2012 examination, but in the 2013 examination many female students failed
with few passing while majority of their male counterpart passed with few failures.
 In general the females did not perform well as compared to their male counterpart.
STUDENT’S PARTICIPATION IN 2012 CORE MATHEMATICS
 A total of 174,296 students registered for the 2012 May/June WASSCE Core Mathematics
examination of which 95,094 were males and79,202 were females.
 Out of this number only 173,499 actually sat for the examination of which 94616 were males
whiles 7,8880 were females.
 797 did no write the examination.
0
20000
40000
60000
80000
100000
120000
A1 - C6 D7 - E8 F9
2012
2013
TOTAL
SOURCE: WEST AFRICA EXAMINATION COUNCIL, GHANA.
 86677 students obtained grades A1-C6 (i.e. credit and above grades) representing49.9% .Out of
this, 51862 were males representing 29.9% while 34,815 were females representing 20.0%
 A total of 54,175 students had aggregate D7-E8(i.e. pass grades)which represents 31.2%. Out of
which 27,325 were males with a percentage of 15.7% while 26,850 were females representing
15.5% .
 However,31,932 students had grade F9(i.e. fail) representing 18.4%. Out of this number,15,008
were males representing a percentage of 8.6% whiles 16924 students were females with a
percentage of 9.8%.
STUDENT’S PARTICIPATON IN 2013 CORE MATHEMATICS
 A total of 405,356 students registered for the 2013 May/June WASSCE Core Mathematics
examination which, 218,575 were males and 186,781 were females.
 But out of this number 402,794 did write the examination of which 217,108 were males and
185,686 were females.
 2562 did not write the examination.
0
50000
100000
150000
200000
250000
A1 - C6 D7 - E8 F9
2012
2013
TOTAL
SOURCE: WEST AFRICA EXAMINATION COUNCIL, GHANA.
 A total of 148,567 students had grades A1-C6 (i.e. credit and above grades) representing 36.8%
out of which 87,217 were males, with a percentage of 21.6% and 61,350 were females with a
percentage of 15.2%
 141,057 students had grade D7-E8 (i.e. pass grades)representing a percentage of34.9%, with
74,421 being males representing 18.4% and 66,636 females with a percentage of 16.5%
 113170 students had aggregate F9 (i.e. fail) representing 28%. Out of this number, 55,470 were
males and 57,700 were females representing 13.7% and 14.3% respectively
COMPARISON BETWEEN 2012 AND 2013 CORE MATHEMATICS PERFORMANCE
 The performance of students in the 2012 WASSCE Core Mathematics examination was poor
since the total number of students who passed was fewer than those who failed.
 2013 May/June WASSCE Core Mathematics examination also witnessed an abysmal
performance similar to that of the 2012 examination.
 Performance of female students were very poor as compared to that of their male counterparts
 The turnout for the 2013 (402,794) was more than double that of 2012(173,499).
0
50000
100000
150000
200000
250000
A1 - C6 D7 - E8 F9
2012
2013
TOTAL
SOURCE: WEST AFRICA EXAMINATION COUNCIL, GHANA.
COMPARISON BETWEEN 2012 CORE AND ELECTIVE MATHEMATICS PERFORMANCE
 60098 students registered for the Elective Mathematics examination but 59400 students sat for
the exams which means 698 students did not take part in the exam while in Core Mathematics,
174296 registered but 173499 students sat for the exam. 797 students did not write the
examination.
 Number of students who wrote the Core Mathematics examination were more than twice the
students who wrote the Elective Mathematics exam.
 In Elective Mathematics 44619 students which represent 75.1% passed with grades between A1
to C6 (i.e. credit and above grades) whereas 86677 students representing 49.9% had same
grades in the Core mathematics examination.
 10653 students representing 17.8% had grades between D7 and E8 (i.e. pass grades) in Elective
Mathematics while 54175 students representing 31.2% had similar grades in Core Mathematics.
 4019 students representing 6.7% failed (i.e. F9) in Elective Mathematics whilst 31932 students
representing 18.4% had same grades in Core Mathematics.
0
50000
100000
150000
200000
250000
A1 - C6 D7 - E8 F9
2012
2013
TOTAL
SOURCE: WEST AFRICA EXAMINATION COUNCIL, GHANA.
COMPARISON BETWEEN 2013 CORE AND ELECTIVE MATHEMATICS PERFORMANCE.
 135404 students registered for the 2013 Elective mathematics examination but only 133891
students wrote the examination, this means 1513 students did not write the examination. In
Core Mathematics, 405356 students registered for the examination out of which 402794
students sat for the exam.2562 students didn’t write the examination.
 Similarly, students who sat for the Core Mathematics examination were more than twice the
number of students who sat for the Elective Mathematics examination.
 In Elective Mathematics 63105 students which represent 47.1% passed with grades between A1
to C6 (i.e. credit and above grades) whereas 148567 students representing 36.8% had same
grades in the Core mathematics examination.
 40712 students representing 30.3% had grades between D7 and E8 (i.e. pass grades) in Elective
Mathematics while 141057 students representing 34.9% had similar grades in Core
Mathematics.
 30074 students representing 22.4% failed (i.e. F9) in Elective Mathematics whilst 113170
students representing 28% had same grades in Core Mathematics.
0
20000
40000
60000
80000
100000
120000
140000
A1 - C6 D7 - E8 F9
ELECTIVE MATH.
CORE MATH.
TOTAL
SOURCE: WEST AFRICA EXAMINATION COUNCIL, GHANA.
OVERALL PERFORMANCE OF STUDENTS IN CORE AND ELECTIVE MATHEMATICS.
 Overall student performance in Elective Mathematics in 2012 was good since as much as 75.1%
excelled in the exams, but in Core Mathematics as low as 49.9% excelled with the remaining
students failing.
 In 2013, there was a sharp decline in student’s performance. 47.1% excelled in Elective
Mathematics as against 75.1% in 2012 while 36.8% excelled in Core Mathematics as against
49.9% in 2012.
 Performance is Core Mathematics is very poor in 2012 and remained the same in 2013.
 Elective Mathematics saw a decline from a better performance of 75.1% in 2012 to a very poor
performance of 47.1% in 2013.
0
20000
40000
60000
80000
100000
120000
140000
A1 - C6 D7 - E8 F9
ELECTIVE MATH.
CORE MATH.
TOTAL

More Related Content

What's hot

University Academic Results Original
University Academic Results OriginalUniversity Academic Results Original
University Academic Results Original
Seja Maribeng
 
Educational policy
Educational policyEducational policy
Educational policy
lucylee79
 
Lessons learned From EFA and the MDGs
Lessons learned From EFA and the MDGsLessons learned From EFA and the MDGs
Lessons learned From EFA and the MDGs
Zeina Zayour
 
Education in finland
Education in finlandEducation in finland
Education in finland
Amine Rida
 
Erwin Junfryono's NTU transcript
Erwin Junfryono's NTU transcriptErwin Junfryono's NTU transcript
Erwin Junfryono's NTU transcript
Erwin Junfryono
 

What's hot (20)

Economics of Education
Economics of EducationEconomics of Education
Economics of Education
 
SlidesThe Effectiveness of Using Blended Learning in Improving Students’ Seco...
SlidesThe Effectiveness of Using Blended Learning in Improving Students’ Seco...SlidesThe Effectiveness of Using Blended Learning in Improving Students’ Seco...
SlidesThe Effectiveness of Using Blended Learning in Improving Students’ Seco...
 
Final na final thesis
Final na final thesisFinal na final thesis
Final na final thesis
 
A Study on Attitude towards Educational Research among B.Ed Students Teachers
A Study on Attitude towards Educational Research among B.Ed Students TeachersA Study on Attitude towards Educational Research among B.Ed Students Teachers
A Study on Attitude towards Educational Research among B.Ed Students Teachers
 
What is Action Research?
What is Action Research?What is Action Research?
What is Action Research?
 
Transcript
TranscriptTranscript
Transcript
 
October4,2010 jen thesis
October4,2010 jen thesisOctober4,2010 jen thesis
October4,2010 jen thesis
 
University Academic Results Original
University Academic Results OriginalUniversity Academic Results Original
University Academic Results Original
 
Educational policy
Educational policyEducational policy
Educational policy
 
Lesson plan about statistics math 7
Lesson plan about statistics math 7Lesson plan about statistics math 7
Lesson plan about statistics math 7
 
Jen1
Jen1Jen1
Jen1
 
What is an ePortfolio
What is an ePortfolioWhat is an ePortfolio
What is an ePortfolio
 
Lessons learned From EFA and the MDGs
Lessons learned From EFA and the MDGsLessons learned From EFA and the MDGs
Lessons learned From EFA and the MDGs
 
Education in finland
Education in finlandEducation in finland
Education in finland
 
Statistical education
Statistical educationStatistical education
Statistical education
 
Erwin Junfryono's NTU transcript
Erwin Junfryono's NTU transcriptErwin Junfryono's NTU transcript
Erwin Junfryono's NTU transcript
 
A real reseach Proposal on factors which influence drop out of maasai girls i...
A real reseach Proposal on factors which influence drop out of maasai girls i...A real reseach Proposal on factors which influence drop out of maasai girls i...
A real reseach Proposal on factors which influence drop out of maasai girls i...
 
Education System of China
Education System of ChinaEducation System of China
Education System of China
 
IU OfficialTranscript
IU OfficialTranscriptIU OfficialTranscript
IU OfficialTranscript
 
Chracteristics of Good Guidcance Program
Chracteristics of Good Guidcance ProgramChracteristics of Good Guidcance Program
Chracteristics of Good Guidcance Program
 

Similar to Analysis of 2012 and 2013 Core and Elective Mathematics WASSCE Results

SMEA-4th-Quarter-2O23-last-edited.pptx
SMEA-4th-Quarter-2O23-last-edited.pptxSMEA-4th-Quarter-2O23-last-edited.pptx
SMEA-4th-Quarter-2O23-last-edited.pptx
DARRENLOUIEESTOMO
 
DevFuturesWork_JCPS
DevFuturesWork_JCPSDevFuturesWork_JCPS
DevFuturesWork_JCPS
Sabeen Nasim
 
FACTORS AFFECTING THE DIFFICULTIES OF 2ND YEAR MT STUDENTS BATCH 2014-2015 IN...
FACTORS AFFECTING THE DIFFICULTIES OF 2ND YEAR MT STUDENTS BATCH 2014-2015 IN...FACTORS AFFECTING THE DIFFICULTIES OF 2ND YEAR MT STUDENTS BATCH 2014-2015 IN...
FACTORS AFFECTING THE DIFFICULTIES OF 2ND YEAR MT STUDENTS BATCH 2014-2015 IN...
Jaymark Jucay
 
Graduates’ Transition from Study to Employment of Radiologic Technology Gr...
Graduates’ Transition from Study  to Employment of  Radiologic Technology  Gr...Graduates’ Transition from Study  to Employment of  Radiologic Technology  Gr...
Graduates’ Transition from Study to Employment of Radiologic Technology Gr...
Lyceum of the Philippines University Batangas
 
english proficiency assessments of primary and secondary teachers and student...
english proficiency assessments of primary and secondary teachers and student...english proficiency assessments of primary and secondary teachers and student...
english proficiency assessments of primary and secondary teachers and student...
Md Ashraf Siddique
 
2013 ccrpi indicators 10.11.13
2013 ccrpi indicators 10.11.132013 ccrpi indicators 10.11.13
2013 ccrpi indicators 10.11.13
jwalts
 

Similar to Analysis of 2012 and 2013 Core and Elective Mathematics WASSCE Results (20)

Final quantitative research paper
Final quantitative research paperFinal quantitative research paper
Final quantitative research paper
 
SMEA-4th-Quarter-2O23-last-edited.pptx
SMEA-4th-Quarter-2O23-last-edited.pptxSMEA-4th-Quarter-2O23-last-edited.pptx
SMEA-4th-Quarter-2O23-last-edited.pptx
 
3rd quarter SMEA.pptx
3rd quarter SMEA.pptx3rd quarter SMEA.pptx
3rd quarter SMEA.pptx
 
Hsc result analysis
Hsc result analysisHsc result analysis
Hsc result analysis
 
2013 CMT FULL Report
2013 CMT FULL Report2013 CMT FULL Report
2013 CMT FULL Report
 
Manelyn L. Mananap Thesis (Chapter 5)
Manelyn L. Mananap Thesis (Chapter 5)Manelyn L. Mananap Thesis (Chapter 5)
Manelyn L. Mananap Thesis (Chapter 5)
 
DevFuturesWork_JCPS
DevFuturesWork_JCPSDevFuturesWork_JCPS
DevFuturesWork_JCPS
 
PSE 2014 Results
PSE 2014 ResultsPSE 2014 Results
PSE 2014 Results
 
Profile analysis of students’ academic performance in ghanaian polytechnics t...
Profile analysis of students’ academic performance in ghanaian polytechnics t...Profile analysis of students’ academic performance in ghanaian polytechnics t...
Profile analysis of students’ academic performance in ghanaian polytechnics t...
 
Stability criterion of periodic oscillations in a (3)
Stability criterion of periodic oscillations in a (3)Stability criterion of periodic oscillations in a (3)
Stability criterion of periodic oscillations in a (3)
 
School report card src 2020 2021
School report card src 2020 2021School report card src 2020 2021
School report card src 2020 2021
 
FACTORS AFFECTING THE DIFFICULTIES OF 2ND YEAR MT STUDENTS BATCH 2014-2015 IN...
FACTORS AFFECTING THE DIFFICULTIES OF 2ND YEAR MT STUDENTS BATCH 2014-2015 IN...FACTORS AFFECTING THE DIFFICULTIES OF 2ND YEAR MT STUDENTS BATCH 2014-2015 IN...
FACTORS AFFECTING THE DIFFICULTIES OF 2ND YEAR MT STUDENTS BATCH 2014-2015 IN...
 
Graduates’ Transition from Study to Employment of Radiologic Technology Gr...
Graduates’ Transition from Study  to Employment of  Radiologic Technology  Gr...Graduates’ Transition from Study  to Employment of  Radiologic Technology  Gr...
Graduates’ Transition from Study to Employment of Radiologic Technology Gr...
 
Class of 2014
Class of 2014 Class of 2014
Class of 2014
 
english proficiency assessments of primary and secondary teachers and student...
english proficiency assessments of primary and secondary teachers and student...english proficiency assessments of primary and secondary teachers and student...
english proficiency assessments of primary and secondary teachers and student...
 
Direct admissions 2012 2018 eng
Direct admissions 2012 2018 engDirect admissions 2012 2018 eng
Direct admissions 2012 2018 eng
 
001 direct admissions 2016 eng
001 direct admissions 2016 eng001 direct admissions 2016 eng
001 direct admissions 2016 eng
 
2013 ccrpi indicators 10.11.13
2013 ccrpi indicators 10.11.132013 ccrpi indicators 10.11.13
2013 ccrpi indicators 10.11.13
 
Manelyn L. Mananap Thesis (Chapter 4)
Manelyn L. Mananap Thesis (Chapter 4)Manelyn L. Mananap Thesis (Chapter 4)
Manelyn L. Mananap Thesis (Chapter 4)
 
SRC ICES
SRC ICESSRC ICES
SRC ICES
 

Recently uploaded

Russian Escort Service in Delhi 11k Hotel Foreigner Russian Call Girls in Delhi
Russian Escort Service in Delhi 11k Hotel Foreigner Russian Call Girls in DelhiRussian Escort Service in Delhi 11k Hotel Foreigner Russian Call Girls in Delhi
Russian Escort Service in Delhi 11k Hotel Foreigner Russian Call Girls in Delhi
kauryashika82
 
The basics of sentences session 3pptx.pptx
The basics of sentences session 3pptx.pptxThe basics of sentences session 3pptx.pptx
The basics of sentences session 3pptx.pptx
heathfieldcps1
 
Making and Justifying Mathematical Decisions.pdf
Making and Justifying Mathematical Decisions.pdfMaking and Justifying Mathematical Decisions.pdf
Making and Justifying Mathematical Decisions.pdf
Chris Hunter
 
Seal of Good Local Governance (SGLG) 2024Final.pptx
Seal of Good Local Governance (SGLG) 2024Final.pptxSeal of Good Local Governance (SGLG) 2024Final.pptx
Seal of Good Local Governance (SGLG) 2024Final.pptx
negromaestrong
 
1029 - Danh muc Sach Giao Khoa 10 . pdf
1029 -  Danh muc Sach Giao Khoa 10 . pdf1029 -  Danh muc Sach Giao Khoa 10 . pdf
1029 - Danh muc Sach Giao Khoa 10 . pdf
QucHHunhnh
 
Beyond the EU: DORA and NIS 2 Directive's Global Impact
Beyond the EU: DORA and NIS 2 Directive's Global ImpactBeyond the EU: DORA and NIS 2 Directive's Global Impact
Beyond the EU: DORA and NIS 2 Directive's Global Impact
PECB
 

Recently uploaded (20)

ICT Role in 21st Century Education & its Challenges.pptx
ICT Role in 21st Century Education & its Challenges.pptxICT Role in 21st Century Education & its Challenges.pptx
ICT Role in 21st Century Education & its Challenges.pptx
 
Mehran University Newsletter Vol-X, Issue-I, 2024
Mehran University Newsletter Vol-X, Issue-I, 2024Mehran University Newsletter Vol-X, Issue-I, 2024
Mehran University Newsletter Vol-X, Issue-I, 2024
 
microwave assisted reaction. General introduction
microwave assisted reaction. General introductionmicrowave assisted reaction. General introduction
microwave assisted reaction. General introduction
 
Russian Escort Service in Delhi 11k Hotel Foreigner Russian Call Girls in Delhi
Russian Escort Service in Delhi 11k Hotel Foreigner Russian Call Girls in DelhiRussian Escort Service in Delhi 11k Hotel Foreigner Russian Call Girls in Delhi
Russian Escort Service in Delhi 11k Hotel Foreigner Russian Call Girls in Delhi
 
Measures of Dispersion and Variability: Range, QD, AD and SD
Measures of Dispersion and Variability: Range, QD, AD and SDMeasures of Dispersion and Variability: Range, QD, AD and SD
Measures of Dispersion and Variability: Range, QD, AD and SD
 
Z Score,T Score, Percential Rank and Box Plot Graph
Z Score,T Score, Percential Rank and Box Plot GraphZ Score,T Score, Percential Rank and Box Plot Graph
Z Score,T Score, Percential Rank and Box Plot Graph
 
Explore beautiful and ugly buildings. Mathematics helps us create beautiful d...
Explore beautiful and ugly buildings. Mathematics helps us create beautiful d...Explore beautiful and ugly buildings. Mathematics helps us create beautiful d...
Explore beautiful and ugly buildings. Mathematics helps us create beautiful d...
 
General Principles of Intellectual Property: Concepts of Intellectual Proper...
General Principles of Intellectual Property: Concepts of Intellectual  Proper...General Principles of Intellectual Property: Concepts of Intellectual  Proper...
General Principles of Intellectual Property: Concepts of Intellectual Proper...
 
The basics of sentences session 3pptx.pptx
The basics of sentences session 3pptx.pptxThe basics of sentences session 3pptx.pptx
The basics of sentences session 3pptx.pptx
 
Presentation by Andreas Schleicher Tackling the School Absenteeism Crisis 30 ...
Presentation by Andreas Schleicher Tackling the School Absenteeism Crisis 30 ...Presentation by Andreas Schleicher Tackling the School Absenteeism Crisis 30 ...
Presentation by Andreas Schleicher Tackling the School Absenteeism Crisis 30 ...
 
Making and Justifying Mathematical Decisions.pdf
Making and Justifying Mathematical Decisions.pdfMaking and Justifying Mathematical Decisions.pdf
Making and Justifying Mathematical Decisions.pdf
 
Seal of Good Local Governance (SGLG) 2024Final.pptx
Seal of Good Local Governance (SGLG) 2024Final.pptxSeal of Good Local Governance (SGLG) 2024Final.pptx
Seal of Good Local Governance (SGLG) 2024Final.pptx
 
Ecological Succession. ( ECOSYSTEM, B. Pharmacy, 1st Year, Sem-II, Environmen...
Ecological Succession. ( ECOSYSTEM, B. Pharmacy, 1st Year, Sem-II, Environmen...Ecological Succession. ( ECOSYSTEM, B. Pharmacy, 1st Year, Sem-II, Environmen...
Ecological Succession. ( ECOSYSTEM, B. Pharmacy, 1st Year, Sem-II, Environmen...
 
1029 - Danh muc Sach Giao Khoa 10 . pdf
1029 -  Danh muc Sach Giao Khoa 10 . pdf1029 -  Danh muc Sach Giao Khoa 10 . pdf
1029 - Danh muc Sach Giao Khoa 10 . pdf
 
Holdier Curriculum Vitae (April 2024).pdf
Holdier Curriculum Vitae (April 2024).pdfHoldier Curriculum Vitae (April 2024).pdf
Holdier Curriculum Vitae (April 2024).pdf
 
This PowerPoint helps students to consider the concept of infinity.
This PowerPoint helps students to consider the concept of infinity.This PowerPoint helps students to consider the concept of infinity.
This PowerPoint helps students to consider the concept of infinity.
 
Unit-IV; Professional Sales Representative (PSR).pptx
Unit-IV; Professional Sales Representative (PSR).pptxUnit-IV; Professional Sales Representative (PSR).pptx
Unit-IV; Professional Sales Representative (PSR).pptx
 
How to Give a Domain for a Field in Odoo 17
How to Give a Domain for a Field in Odoo 17How to Give a Domain for a Field in Odoo 17
How to Give a Domain for a Field in Odoo 17
 
Beyond the EU: DORA and NIS 2 Directive's Global Impact
Beyond the EU: DORA and NIS 2 Directive's Global ImpactBeyond the EU: DORA and NIS 2 Directive's Global Impact
Beyond the EU: DORA and NIS 2 Directive's Global Impact
 
Sociology 101 Demonstration of Learning Exhibit
Sociology 101 Demonstration of Learning ExhibitSociology 101 Demonstration of Learning Exhibit
Sociology 101 Demonstration of Learning Exhibit
 

Analysis of 2012 and 2013 Core and Elective Mathematics WASSCE Results

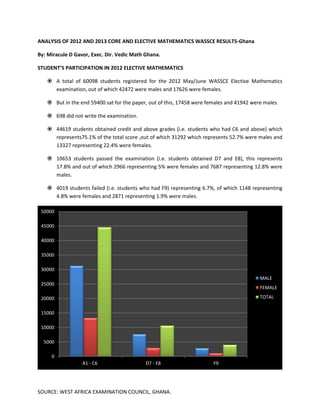
  • 1. SOURCE: WEST AFRICA EXAMINATION COUNCIL, GHANA. ANALYSIS OF 2012 AND 2013 CORE AND ELECTIVE MATHEMATICS WASSCE RESULTS-Ghana By: Miracule D Gavor, Exec. Dir. Vedic Math Ghana. STUDENT’S PARTICIPATION IN 2012 ELECTIVE MATHEMATICS  A total of 60098 students registered for the 2012 May/June WASSCE Elective Mathematics examination, out of which 42472 were males and 17626 were females.  But in the end 59400 sat for the paper, out of this, 17458 were females and 41942 were males.  698 did not write the examination.  44619 students obtained credit and above grades (i.e. students who had C6 and above) which represents75.1% of the total score ,out of which 31292 which represents 52.7% were males and 13327 representing 22.4% were females.  10653 students passed the examination (i.e. students obtained D7 and E8), this represents 17.8% and out of which 2966 representing 5% were females and 7687 representing 12.8% were males.  4019 students failed (i.e. students who had F9) representing 6.7%, of which 1148 representing 4.8% were females and 2871 representing 1.9% were males. 0 5000 10000 15000 20000 25000 30000 35000 40000 45000 50000 A1 - C6 D7 - E8 F9 MALE FEMALE TOTAL
  • 2. SOURCE: WEST AFRICA EXAMINATION COUNCIL, GHANA. STUDENT’S PARTICIPATION 2013 ELECTIVE MATHEMATICS  135404 students registered for the 2013 WASSCE Elective Mathematics examination out 94637 were males and 40767 were females.  But 133891 out of the students who registered for the examination did sit for the paper of which 94619 were males and 40423 females.  1513 did not write the exams  63105 students obtained grades A1 to C6 (i.e. credit and above grades) which represents 47.1%. Out of this, 44554 representing 33.3% were males and 18551 which is 13.8% were females.  40712 student obtained grades between D7 and E8 (i.e. pass grades) this represents 30.3% and out of this, 12478 which represents 9.3% were females and 28234 representing 21.0% were males.  30074 students failed the examination (i.e. students who had F9) representing 22.4% and out of which 9394 were females which represents 7% and 20680 representing 15.4% were males. COMPARISON OF PERFORMANCE BETWEEN 2012 AND 2013 ELECTIVE MATHEMATICS 0 10000 20000 30000 40000 50000 60000 70000 A1 - C6 D7 - E8 F9 MALE FEMALE TOTAL
  • 3. SOURCE: WEST AFRICA EXAMINATION COUNCIL, GHANA.  Results from the 2012 WASSCE was fairly good with majority of the students passing the examination with just a few students failing.  Many students sat for the 2013 Elective Mathematics examination, none the less, the performance was poor as compared to the 2012 results.  Students who failed in the 2013 elective mathematics were greater than those who passed.  Performance on gender basis was almost similar as both males and females had similar passes and failures in the 2012 examination, but in the 2013 examination many female students failed with few passing while majority of their male counterpart passed with few failures.  In general the females did not perform well as compared to their male counterpart. STUDENT’S PARTICIPATION IN 2012 CORE MATHEMATICS  A total of 174,296 students registered for the 2012 May/June WASSCE Core Mathematics examination of which 95,094 were males and79,202 were females.  Out of this number only 173,499 actually sat for the examination of which 94616 were males whiles 7,8880 were females.  797 did no write the examination. 0 20000 40000 60000 80000 100000 120000 A1 - C6 D7 - E8 F9 2012 2013 TOTAL
  • 4. SOURCE: WEST AFRICA EXAMINATION COUNCIL, GHANA.  86677 students obtained grades A1-C6 (i.e. credit and above grades) representing49.9% .Out of this, 51862 were males representing 29.9% while 34,815 were females representing 20.0%  A total of 54,175 students had aggregate D7-E8(i.e. pass grades)which represents 31.2%. Out of which 27,325 were males with a percentage of 15.7% while 26,850 were females representing 15.5% .  However,31,932 students had grade F9(i.e. fail) representing 18.4%. Out of this number,15,008 were males representing a percentage of 8.6% whiles 16924 students were females with a percentage of 9.8%. STUDENT’S PARTICIPATON IN 2013 CORE MATHEMATICS  A total of 405,356 students registered for the 2013 May/June WASSCE Core Mathematics examination which, 218,575 were males and 186,781 were females.  But out of this number 402,794 did write the examination of which 217,108 were males and 185,686 were females.  2562 did not write the examination. 0 50000 100000 150000 200000 250000 A1 - C6 D7 - E8 F9 2012 2013 TOTAL
  • 5. SOURCE: WEST AFRICA EXAMINATION COUNCIL, GHANA.  A total of 148,567 students had grades A1-C6 (i.e. credit and above grades) representing 36.8% out of which 87,217 were males, with a percentage of 21.6% and 61,350 were females with a percentage of 15.2%  141,057 students had grade D7-E8 (i.e. pass grades)representing a percentage of34.9%, with 74,421 being males representing 18.4% and 66,636 females with a percentage of 16.5%  113170 students had aggregate F9 (i.e. fail) representing 28%. Out of this number, 55,470 were males and 57,700 were females representing 13.7% and 14.3% respectively COMPARISON BETWEEN 2012 AND 2013 CORE MATHEMATICS PERFORMANCE  The performance of students in the 2012 WASSCE Core Mathematics examination was poor since the total number of students who passed was fewer than those who failed.  2013 May/June WASSCE Core Mathematics examination also witnessed an abysmal performance similar to that of the 2012 examination.  Performance of female students were very poor as compared to that of their male counterparts  The turnout for the 2013 (402,794) was more than double that of 2012(173,499). 0 50000 100000 150000 200000 250000 A1 - C6 D7 - E8 F9 2012 2013 TOTAL
  • 6. SOURCE: WEST AFRICA EXAMINATION COUNCIL, GHANA. COMPARISON BETWEEN 2012 CORE AND ELECTIVE MATHEMATICS PERFORMANCE  60098 students registered for the Elective Mathematics examination but 59400 students sat for the exams which means 698 students did not take part in the exam while in Core Mathematics, 174296 registered but 173499 students sat for the exam. 797 students did not write the examination.  Number of students who wrote the Core Mathematics examination were more than twice the students who wrote the Elective Mathematics exam.  In Elective Mathematics 44619 students which represent 75.1% passed with grades between A1 to C6 (i.e. credit and above grades) whereas 86677 students representing 49.9% had same grades in the Core mathematics examination.  10653 students representing 17.8% had grades between D7 and E8 (i.e. pass grades) in Elective Mathematics while 54175 students representing 31.2% had similar grades in Core Mathematics.  4019 students representing 6.7% failed (i.e. F9) in Elective Mathematics whilst 31932 students representing 18.4% had same grades in Core Mathematics. 0 50000 100000 150000 200000 250000 A1 - C6 D7 - E8 F9 2012 2013 TOTAL
  • 7. SOURCE: WEST AFRICA EXAMINATION COUNCIL, GHANA. COMPARISON BETWEEN 2013 CORE AND ELECTIVE MATHEMATICS PERFORMANCE.  135404 students registered for the 2013 Elective mathematics examination but only 133891 students wrote the examination, this means 1513 students did not write the examination. In Core Mathematics, 405356 students registered for the examination out of which 402794 students sat for the exam.2562 students didn’t write the examination.  Similarly, students who sat for the Core Mathematics examination were more than twice the number of students who sat for the Elective Mathematics examination.  In Elective Mathematics 63105 students which represent 47.1% passed with grades between A1 to C6 (i.e. credit and above grades) whereas 148567 students representing 36.8% had same grades in the Core mathematics examination.  40712 students representing 30.3% had grades between D7 and E8 (i.e. pass grades) in Elective Mathematics while 141057 students representing 34.9% had similar grades in Core Mathematics.  30074 students representing 22.4% failed (i.e. F9) in Elective Mathematics whilst 113170 students representing 28% had same grades in Core Mathematics. 0 20000 40000 60000 80000 100000 120000 140000 A1 - C6 D7 - E8 F9 ELECTIVE MATH. CORE MATH. TOTAL
  • 8. SOURCE: WEST AFRICA EXAMINATION COUNCIL, GHANA. OVERALL PERFORMANCE OF STUDENTS IN CORE AND ELECTIVE MATHEMATICS.  Overall student performance in Elective Mathematics in 2012 was good since as much as 75.1% excelled in the exams, but in Core Mathematics as low as 49.9% excelled with the remaining students failing.  In 2013, there was a sharp decline in student’s performance. 47.1% excelled in Elective Mathematics as against 75.1% in 2012 while 36.8% excelled in Core Mathematics as against 49.9% in 2012.  Performance is Core Mathematics is very poor in 2012 and remained the same in 2013.  Elective Mathematics saw a decline from a better performance of 75.1% in 2012 to a very poor performance of 47.1% in 2013. 0 20000 40000 60000 80000 100000 120000 140000 A1 - C6 D7 - E8 F9 ELECTIVE MATH. CORE MATH. TOTAL