SlideShare a Scribd company logo
1 of 16
Download to read offline
BUSINESS VALUATION &
FINANCIAL ADVISORY SERVICES
Construction Overview	
Construction  National GDP	 1
Construction  National Unemployment	 2
Value of Construction Put-in-Place	 3
Sector Focus: Building Materials
Government Funding for Highways and
Government Consumption and Investment  5
Trade-Weighted Index and
Yield on 10-Year Treasury	 6
Industrial Production Index and
Value of Utilities Construction	 7
Sector Round-up	
Roads, Bridges  Highways	 8
Nonresidential Construction	 9
Residential Construction	 10
Bellwether Stocks 
Industry Participants	 12
About Mercer Capital	 15
www.mercercapital.com
VALUE FOCUS
Second Quarter 2018
Construction  Building Materials
SEGMENT FOCUS
Building Materials
EXECUTIVE
INDUSTRY TRENDS
ā€¢	 Favorable macroeconomic environment driving increased con-
struction on all fronts ā€“ residential, nonresidential, public
ā€¢	 Tight labor market and increased fuel costs pressuring building
companiesā€™ margins
ā€¢	 U.S. tax overhaul already boosting nonresidential construction
through 2Q18
ā€¢	 The Fed continues on its path of raising interest rates. However,
the shrinking 10-2 year treasury yield spread has some concerned
that short-term rates are rising too quickly
Ā© 2018 Mercer Capital // www.mercercapital.com 1
Mercer Capitalā€™s Value Focus: Construction  Building Materials Second Quarter 2018
$0
$100
$200
$300
$400
$500
$600
$700
$800
-8.0%
-6.0%
-4.0%
-2.0%
0.0%
2.0%
4.0%
2008 2009 2010 2011 2012 2013 2014 2015 2016 2017 2018
GDP($Billions)
AnnualizedRealGrowthRate
Quarterly Growth Average Quarterly Growth GDP (Current Dollars)
Source: Trading Economics
-8%
-4%
0%
4%
8%
Q
2-2008
Q
2-2009
Q
2-2010
Q
2-2011
Q
2-2012
Q
2-2013
Q
2-2014
Q
2-2015
Q
2-2016
Q
2-2017
Q
2-2018
National Construction
Source: Trading Economics, U.S. Bureau of Economic Analysis
Construction
Overview
Construction 
National GDP
GDP rose 5.4% over the past year through the
second quarter of 2018, which was the highest
year-over-year rate in the examined period. Since
2008, construction has averaged 3.6% of national
GDP, and it accounted for 3.3% of GDP over 1Q
2018. Construction has steadily recovered since
the decline caused by the 2008 financial crisis,
experiencing growth consistent with that of national
GDP. Fluctuations in construction GDP have now
stabilized, with most quarterly growth rates lying
in the plus or minus 0-2 percent range since 2012.
Year-over-year construction GDP has increased
2.1%, and plans for increased infrastructure
spending, inventory constraints in the existing
home market, and improved corporate profitability
should allow for continued industry growth.
Construction Gross Domestic Product
% Change in GDP
Construction GDP
Period % Change
Q-o-Q 1.0%
Y-o-Y 2.1%
National GDP
Period % Change
Q-o-Q 1.9%
Y-o-Y 5.4%
* Construction data through Q1 2018
Ā© 2018 Mercer Capital // www.mercercapital.com 2
Mercer Capitalā€™s Value Focus: Construction  Building Materials Second Quarter 2018
The Federal Reserve believes a healthy economy typically has an unemployment rate between 4.5% and 6.0%. The
current level of 4.0% falls slightly below this range, indicative of a tight labor market. The unemployment rate fell to 3.8%
in May which was the lowest rate of the ten year period.
The unemployment rate in the construction industry is typically more volatile because it is a cyclical and seasonal
industry. The major contributing factor to the industryā€™s seasonality is the weather. Production of materials and
projects generally decrease during the colder, winter months. Construction unemployment is currently at 4.7%,
comparable to 4.5% at the same time last year. A lack of skilled laborers has become an industry-wide issue and
has contributed to wage growth and increased costs for builders. Lower unemployment rates suggest an increase of
activity within the industry.
0.0%
5.0%
10.0%
15.0%
20.0%
25.0%
30.0%
Q
2-2008
Q
2-2008
Q
2-2010
Q
2-2011
Q
2-2012
Q
2-2013
Q
2-2014
Q
2-2015
Q
2-2016
Q
2-2017
Q
2-2018
National Construction
Source: U.S. Bureau of Labor Statistics
Construction
Overview
Construction 
National Unemployment
Unemployment Rate
Ā© 2018 Mercer Capital // www.mercercapital.com 3
Mercer Capitalā€™s Value Focus: Construction  Building Materials Second Quarter 2018
The value of construction put-in-place is the total value of construction work done in the U.S. for a particular period. The
U.S. Census Bureau tracks this data and reports the total monthly. This value includes, but is not limited to, the building
materials costs, labor costs, profit, costs of engineering, interest, and taxes.
Year-over-year put-in-place construction has increased by 5.5% for residential and by 6.2% for nonresidential.
Nonresidential construction grew by 2.3% quarter-over-quarter through June 2018. The increase in non-residential
construction comes in the midst of delays for the Presidentā€™s $1.5 trillion worth of infrastructure projects due to financing
issues. Progress in these plans would create significant public work projects and could continue to accelerate
nonresidential growth. Growth in residential construction has been choppier in comparison to nonresidential construction
but still continued to increase quarter-over-quarter.
Construction
Overview
Value of Construction
Put-in-Place
$0
$100
$200
$300
$400
$500
$600
$700
$800
Q
2-2008
Q
2-2009
Q
2-2010
Q
2-2011
Q
2-2012
Q
2-2013
Q
2-2014
Q
2-2015
Q
2-2016
Q
2-2017
Q
2-2018
$Billions
Residential Nonresidential
Source: U.S. Census Bureau
Value of Construction Put-in-Place
Residential
Period % Change
Q-o-Q 0.9%
Y-o-Y 5.5%
Nonresidential
Period % Change
Q-o-Q 2.3%
Y-o-Y 6.2%
Ā© 2018 Mercer Capital // www.mercercapital.com 4
Mercer Capitalā€™s Value Focus: Construction  Building Materials Second Quarter 2018
State and local governments are typically in charge of their construction projects, but they rely on federal funding
to complete many projects. Despite optimism regarding a potential $1.5 trillion infrastructure plan from the Trump
administration to close the U.S. infrastructure gap, no policy has currently been implemented and the infrastructure
package took a back seat to tax reform and other initiatives. According to industry executives, federal funds usually
take 18 to 24 months to flow through to projects, and companies are still experiencing benefits from the 2015 FAST
Act. However, overall infrastructure activity has been sluggish the past couple of years despite the pervasive need for
infrastructure investment. State and local initiatives have appeared perhaps due to diminished expectations for a grand
federal plan and total government consumption and investment has increased in recent periods.
Building materials benefited from both healthy residential and nonresidential construction demand over the past year.
Low home inventories and continuing improvement in employment and wages have increased demand for new home
starts and subdivision development. Home prices continued to rise and rising interest rates may present headwinds
due to increasing mortgage rates. In addition to increased consumer and business confidence, reduced corporate tax
rates from the U.S. Tax Cuts and Jobs Act have boosted prospects for nonresidential construction.
The construction industryā€™s strong performance and sustained economic expansion has been a boon for American
aggregate producers. U.S. cement consumption has continued to increase from its low point in 2010. Cement
consumption increased 2.8% in 2017 to 96.8 million metric tons, which is still 25% below the all-time peak in 2005. The
U.S. was the third-largest cement producer in the world in 2017 behind China and India.
Despite a favorable macroeconomic environment and healthy revenues, the building materials industry has experienced
increased cost pressures. Higher energy costs (oil, coal, petcoke) have dragged on the industryā€™s earnings. A tight
labor market has also increased the competition for employees in the building materials industry and driven up wage
costs. Labor shortages are affecting contractorsā€™ capacity for work and may be limiting potential levels of activity. Since
the prices for most large contracts are negotiated up front, the unexpected rise in costs has compressed margins.
However, companies will have an opportunity to pass on higher prices as they negotiate new contracts. Increased
demand will also boost product prices as the industry nears domestic production capacity. Concerns over increased
building materials prices may dampen enthusiasm for publicly funded work as the cement producer price index hit a
ten-year high in June 2018 and recently imposed tariffs on Chinese imports will increase the cost of imported materials.
Sector Focus
Building Materials
Ā© 2018 Mercer Capital // www.mercercapital.com 5
Mercer Capitalā€™s Value Focus: Construction  Building Materials Second Quarter 2018
Building materials are a crucial input to construction projects. Without funding, however, construction projects cannot
be completed. Much of this funding comes from public resources, so the industry is typically concerned with the level
of government spending on construction activity. Government consumption expenditures and gross investments
reached high levels during the recession to boost the economy and declined significantly in the years following. After
stagnating for much of 2016 and 2017, GCI has grown consistently for the past three quarters and reached the highest
levels since 2011. The growth in GCI comes despite the absence of the touted infrastructure investment bill under
the new administration.
Building Materials
Government Funding for
Highways and Government
Consumption and
Investment
Government Consumption and Investment
$2,800
$2,900
$3,000
$3,100
$3,200
$3,300
$3,400
Q
2-2008
Q
2-2009
Q
2-2010
Q
2-2011
Q
2-2012
Q
2-2013
Q
2-2014
Q
2-2015
Q
2-2016
Q
2-2017
Q
2-2018
$Billions
Source: St. Louis Fed | U.S. Bureau of Economic Analysis
Government
Consumption  Investment
Period % Change
Q-o-Q 0.6%
Y-o-Y 1.3%
Ā© 2018 Mercer Capital // www.mercercapital.com 6
Mercer Capitalā€™s Value Focus: Construction  Building Materials Second Quarter 2018
80
90
100
110
120
130
Q
2-2008
Q
2-2008
Q
2-2010
Q
2-2011
Q
2-2012
Q
2-2013
Q
2-2014
Q
2-2015
Q
2-2016
Q
2-2017
Q
2-2018
Source: St. Louis Fed | Board of Governors of the Federal Reserve (US)
0.0%
1.0%
2.0%
3.0%
4.0%
5.0%
Q
2-2008
Q
2-2008
Q
2-2010
Q
2-2011
Q
2-2012
Q
2-2013
Q
2-2014
Q
2-2015
Q
2-2016
Q
2-2017
Q
2-2018
Source: St. Louis Fed | Board of Governors of the Federal Reserve (US)
Building Materials
Trade-Weighted Index and
Yield on 10-Year Treasury
The Trade-Weighted Index measures the relative
strength of the U.S. dollar in comparison to foreign
currencies, putting an emphasized weight on
the most common trade partners and largest
economies. When the dollar is strong, imports
become cheaper and exports become more
expensive. The dollar is near its strongest level in
the last 10 years, which increases the cost for other
countries to purchase U.S. building materials and
decreases sales volume. The TWI has increased
throughout 2018 after a decline in 2017. Divergence
in monetary policy between the U.S. and the
international community has boosted the dollarā€™s
appreciation as the Fed has increased rates and
begun its process of shrinking its balance sheet.
The yield on 10-Year Treasury Bonds acts as a
proxy for how expensive it is to finance construction
projects. An increase in yields raises the cost
of investment, but it can also signify increasing
optimism about future economic growth, which leads
to more spending in the construction industry. The
10-year yield reached its highest level since 2011 as
rates have increased steadily.
Trade-Weighted Index
Yield on 10-Year Treasury
Trade-Weighted Index
Period % Change
Q-o-Q 4.5%
Y-o-Y 1.1%
Yield on 10-Year Treasury
Period Change
Q-o-Q 7 BPS
Y-o-Y 72 BPS
Ā© 2018 Mercer Capital // www.mercercapital.com 7
Mercer Capitalā€™s Value Focus: Construction  Building Materials Second Quarter 2018
80
85
90
95
100
105
110
Q
2-2008
Q
2-2008
Q
2-2010
Q
2-2011
Q
2-2012
Q
2-2013
Q
2-2014
Q
2-2015
Q
2-2016
Q
2-2017
Q
2-2018
Source: St. Louis Fed | Board of Governors of the Federal Reserve (US)
$0
$40
$80
$120
$160
$200
Q
2-2008
Q
2-2008
Q
2-2010
Q
2-2011
Q
2-2012
Q
2-2013
Q
2-2014
Q
2-2015
Q
2-2016
Q
2-2017
Q
2-2018
$Billions
Source: U.S. Census Bureau
Building Materials
Industrial Production
Index and Value of Utilities
Construction
The Industrial Production Index is an indicator of
economic activity that measures real production
output of the manufacturing, mining, and utilities
industries. It acts as a barometer of demand for
industrial products and manufacturing activity.
Building materials such as sand and gravel are
important inputs of industrial production. After
oscillating for a couple of years, IPI steadily
increased for most of 2017 and 2018. In April
2018, IPI reached its highest level of the examined
period.
Cement and ready-mix concrete are used in
most construction projects involving the utilities
subsector such as transportation, energy, gas,
water, and sewage. There will always be a need
for such infrastructure, so building materials
companies can rely on this revenue stream even
though the growth rate of new projects fluctuates.
The value of utilities construction has increased
10.2% over the past year.
Industrial Production Index
Value of Utilities Construction
Industrial Production Index
Period % Change
Q-o-Q 0.9%
Y-o-Y 3.5%
Value of Utilities Construction
Period % Change
Q-o-Q 6.8%
Y-o-Y 10.2%
Ā© 2018 Mercer Capital // www.mercercapital.com 8
Mercer Capitalā€™s Value Focus: Construction  Building Materials Second Quarter 2018
The yield on 10-Year Treasury Bonds can indirectly affect the road contracting industry. As discussed previously, higher
interest rates make construction projects more expensive to undertake, but they may also signify increased optimism
about economic growth. As seen in the chart below, the 10-year yield has experienced a downward trend for much of
the past ten years as the Fed attempted to aid the economic recovery by encouraging an increase in investment. The
10-year yield has increased by 72 basis points over the past year due to a shift in the Fedā€™s stance on interest rates and
expectations of stronger economic growth and higher inflation.
One interest rate measure to watch is the spread between 10-year and 2-year treasury yields. A spread approaching
zero or even crossing into negative territory has historically preceded a recession and potentially signals that the Fed
has tightened rates too much. The spread declined to 0.38% in June 2018 which is the lowest spread in the past ten
years as the growth in 2-year yields, which the Fed has more influence over, has outpaced the growth in 10-year yields.
0.0%
1.0%
2.0%
3.0%
4.0%
5.0%
Q
2-2008
Q
2-2008
Q
2-2010
Q
2-2011
Q
2-2012
Q
2-2013
Q
2-2014
Q
2-2015
Q
2-2016
Q
2-2017
Q
2-2018
Source: St. Louis Fed | Board of Governors of the Federal Reserve (US)
Sector Round-up
Roads, Bridges 
Highways
Yield on 10-Year Treasury
Period Change
Q-o-Q 7 BPS
Y-o-Y 72 BPS
Ā© 2018 Mercer Capital // www.mercercapital.com 9
Mercer Capitalā€™s Value Focus: Construction  Building Materials Second Quarter 2018
Corporate profit is essential for companies not only to survive but also to grow and expand. When corporate profit
increases, companies are more willing and able to open new branches and divisions. These additions lead to more
commercial construction. As seen in the chart below, corporate profit has increased over the past year to the highest
level of the past ten years. In addition to favorable macroeconomic trends discussed in other sections, the U.S.Tax Cuts
and Jobs Act of 2017 lowered the corporate tax rate from 35% to 21%. The dip in the fourth quarter of 2017 is partially
due to one-time deferred tax asset write-downs incurred by companies owing to the new tax rate. A lower tax burden
going forward should encourage increased investment.
$0
$500
$1,000
$1,500
$2,000
$2,500
Q
2-2008
Q
2-2009
Q
2-2010
Q
2-2011
Q
2-2012
Q
2-2013
Q
2-2014
Q
2-2015
Q
2-2016
Q
2-2017
Q
2-2018
$Billions
Source: St. Louis Federal Reserve
Sector Round-up
Nonresidential
Construction
Corporate Profit
Corporate Profit
Period % Change
Q-o-Q 3.3%
Y-o-Y 6.4%
Ā© 2018 Mercer Capital // www.mercercapital.com 10
Mercer Capitalā€™s Value Focus: Construction  Building Materials Second Quarter 2018
The National Association of Home Builders conducts two separate surveys, the Housing Market Index (HMI) and the
Remodeling Market Index (RMI), to measure confidence in the home building industry. Respondents rate their activity
on a scale from 1-100 with 50 being average. The HMI is produced monthly and asks respondents to rate market
conditions both at present and looking forward six months. The monthly index has remained above 50 since July 2014
and reached a ten year high of 74 in December 2017. The RMI is produced quarterly and asks respondents to rate their
work volume as either higher or lower than the previous quarter. The monthly index has fluctuated between 50 and 60
since the second quarter of 2013.
0
20
40
60
80
100
Q
2-2008
Q
2-2008
Q
2-2010
Q
2-2011
Q
2-2012
Q
2-2013
Q
2-2014
Q
2-2015
Q
2-2016
Q
2-2017
Q
2-2018
HMI RMI
Source: National Association of Home Builders
Note: RMI is measured quarterly and approximated for a monthly basis using a straight-line approach.
Sector Round-up
Residential Construction
NAHB HMI and RMI
NAHB HMI
Period % Change
Q-o-Q -2.9%
Y-o-Y 3.0%
NAHB RMI
Period % Change
Q-o-Q 1.8%
Y-o-Y 5.5%
Ā© 2018 Mercer Capital // www.mercercapital.com 11
Mercer Capitalā€™s Value Focus: Construction  Building Materials Second Quarter 2018
Sector Round-up
Residential Construction
(continued)
Building permits and housing starts are two
important indicators for the home building industry.
Both reflect demand, consumer confidence, and
the feasibility of financing construction projects.
Building permits can be issued and then shelved
by builders; therefore, housing starts are a better
focused measure of current activity within the
industry. After declining nearly 75% during from
Q1 2006 to Q1 2009 as the housing bubble
unwound, housing permits and starts have steadily
recovered but are unlikely to reach pre-recession
highs. After strong growth in the first quarter of
2018 and low existing inventory, housing starts
had a disappointing second quarter as single
family starts stagnated year-over-year and private
housing starts declined 4.2%.
0.0
0.2
0.4
0.6
0.8
1.0
1.2
1.4
1.6
1.8
2.0
2.2
2.4
MillionsofUnits
Private Housing Starts Single Family Starts
Private Building Permits Single Family Building Permits
Source: U.S. Census Bureau, Seasonally Adjusted Data
Note: Permits at a given date are generally a leading indicator of future starts.
Beginning with January 2004, building permit data reflects the change to the 20,000 place series.
Private Housing
Single Family Housing
Seasonally Adjusted Annualized Rates of New Housing Starts and Building Permits
Private Housing
Starts
Single Family
Starts
Private
Building Permits
Single Family
Building Permits
Period % Change Period % Change Period % Change Period % Change
Q-o-Q -11.6% Q-o-Q -2.7% Q-o-Q -6.2% Q-o-Q 0.2%
Y-o-Y -4.2% Y-o-Y -0.2% Y-o-Y -1.5% Y-o-Y 4.9%
Ā© 2018 Mercer Capital // www.mercercapital.com 12
Mercer Capitalā€™s Value Focus: Construction  Building Materials Second Quarter 2018
Ticker
Price at
6/30/18
52-Week
Perf.
LTM
Revenue
Enterprise
Value Debt / MVTC
EBITDA
Margin
EV / EBITDA
(x)
TEV / Next Yr
EBITDA (x)
Price / LTM
Earnings
Residential
Beazer Homes USA, Inc. NYSE: BZH 14.75 7.5% 2,012 1,641 73.7% 4.6% 17.87 15.13 NM
D.R. Horton, Inc. NYSE: DHI 41.00 18.6% 15,722 17,899 16.7% 12.8% 8.91 7.66 11.80
KB Home NYSE: KBH 27.24 13.6% 4,520 4,068 49.7% 7.9% 11.37 7.40 19.76
Lennar Corporation NYSE: LEN 52.50 0.4% 15,487 27,767 40.0% 10.0% 17.93 9.03 13.89
LGI Homes, Inc. NasdaqGS: LGIH 57.73 43.7% 1,470 1,825 29.8% 13.5% 9.17 7.88 8.83
M.D.C. Holdings, Inc. NYSE: MDC 30.77 -5.9% 2,726 2,419 38.5% 8.5% 10.49 7.07 9.18
NVR, Inc. NYSE: NVR 2,970.35 23.2% 6,819 10,942 5.3% 14.4% 11.13 9.91 16.74
PulteGroup, Inc. NYSE: PHM 28.75 17.2% 9,461 11,382 28.5% 15.0% 8.00 7.48 11.23
Taylor Morrison Home Corporation NYSE: TMHC 20.78 -13.5% 3,941 3,450 38.1% 9.3% 9.39 7.82 12.26
Meritage Homes Corporation NYSE: MTH 43.95 4.1% 3,387 2,925 42.3% 8.4% 10.23 8.44 10.11
TRI Pointe Group, Inc. NYSE: TPH 16.36 24.0% 3,201 3,635 36.9% 14.0% 8.12 7.54 9.79
Median 14% 3,941 3,635 38.1% 10.0% 10.23 7.82 11.51
All figures reported in millions, except per share data
Source: Capital IQ
Bellwether Stocks  Industry Participants
Ā© 2018 Mercer Capital // www.mercercapital.com 13
Mercer Capitalā€™s Value Focus: Construction  Building Materials Second Quarter 2018
Ticker
Price at
6/30/18
52-Week
Perf.
LTM
Revenue
Enterprise
Value Debt / MVTC
EBITDA
Margin
EV / EBITDA
(x)
TEV / Next Yr
EBITDA (x)
Price / LTM
Earnings
Building Materials
Eagle Materials Inc. NYSE: EXP 104.97 13.6% 1,414 5,651 11.4% 29.7% 13.46 10.59 18.81
Martin Marietta Materials, Inc. NYSE: MLM 223.33 0.3% 3,814 15,668 18.6% 27.3% 15.07 12.44 19.46
Summit Materials, Inc. NYSE: SUM 26.25 -7.8% 2,040 4,596 38.5% 19.8% 11.37 8.99 27.34
U.S. Concrete, Inc. NasdaqCM: USCR 52.50 -33.2% 1,428 1,624 45.9% 11.4% 9.94 6.64 25.44
Vulcan Materials Company NYSE: VMC 129.06 1.9% 4,127 19,997 15.5% 24.3% 19.93 16.17 26.24
CEMEX, S.A.B. de C.V. BMV: CEMEX CPO 0.66 -29.5% 13,567 21,129 51.4% 18.3% 8.50 7.68 18.03
CRH plc ISE: CRG 35.41 0.2% 29,534 37,018 28.2% 12.4% 10.15 8.75 13.91
HeidelbergCement AG DB: HEI 84.38 -12.7% 20,202 29,942 44.7% 15.8% 9.37 7.51 13.63
LafargeHolcim Ltd SWX: LHN 48.70 -15.0% 26,655 46,288 39.7% 4.8% 36.04 7.39 NM
Median -8% 4,127 19,997 38.5% 18.3% 11.37 8.75 19.14
Roads, Bridges, and Highways
Granite Construction Incorporated NYSE: GVA 55.66 15% 3,129 2,324 16.1% 6.3% 11.71 8.41 37.73
Sterling Construction Company, Inc. NasdaqGS: STRL 13.03 -0.3% 1,049 389 19.7% 4.4% 8.39 6.73 16.68
Tutor Perini Corporation NYSE: TPC 18.45 -35.8% 4,541 1,550 47.2% 4.5% 7.57 5.03 7.84
Median 0% 3,129 1,550 19.7% 4.5% 8.39 6.73 16.68
All figures reported in millions, except per share data
Source: Capital IQ
Bellwether Stocks  Industry Participants
Note: CX, CRG, HEI, and LHN report in foreign currency. Margin and multiples unaffected and shown for analysis.
Ā© 2018 Mercer Capital // www.mercercapital.com 14
Mercer Capitalā€™s Value Focus: Construction  Building Materials Second Quarter 2018
Ticker
Price at
6/30/18
52-Week
Perf.
LTM
Revenue
Enterprise
Value Debt / MVTC
EBITDA
Margin
EV / EBITDA
(x)
TEV / Next Yr
EBITDA (x)
Price / LTM
Earnings
Nonresidential
AECOM NYSE: ACM 33.03 2% 19,706 8,601 42.3% 3.8% 11.45 8.65 37.21
Dycom Industries, Inc. NYSE: DY 94.51 6% 2,768 3,640 20.5% 9.2% 14.23 8.20 25.25
EMCOR Group, Inc. NYSE: EME 76.18 16.5% 7,754 4,408 6.4% 6.2% 9.21 9.45 18.28
Fluor Corporation NYSE: FLR 48.78 7% 19,677 6,799 19.5% 3.9% 8.77 7.76 27.12
Jacobs Engineering Group Inc. NYSE: JEC 63.49 16.7% 13,496 10,773 20.7% 7.0% 11.39 9.04 28.53
MasTec, Inc. NYSE: MTZ 50.75 12% 6,573 5,390 28.8% 8.4% 9.77 7.48 12.32
Quanta Services, Inc. NYSE: PWR 33.40 1.5% 10,162 5,801 14.6% 6.8% 8.41 6.63 16.56
Median - Nonresidential 7% 10,162 5,801 20.5% 6.8% 9.77 8.20 25.25
All figures reported in millions, except per share data
Source: Capital IQ
Bellwether Stocks  Industry Participants
Mercer
Capital
Construction 
Building Materials
Industry Services
Contact Us
Copyright Ā© 2018 Mercer Capital Management, Inc. All rights reserved. It is illegal under Federal law to reproduce this publication or any portion of its contents without the publisherā€™s permission. Media quotations with source attribution are encouraged.
Reporters requesting additional information or editorial comment should contact Barbara Walters Price at 901.685.2120. Mercer Capitalā€™s Industry Focus is published quarterly and does not constitute legal or financial consulting advice. It is offered as an
information service to our clients and friends. Those interested in specific guidance for legal or accounting matters should seek competent professional advice. Inquiries to discuss specific valuation matters are welcomed. To add your name to our mailing list
to receive this complimentary publication, visit our web site at www.mercercapital.com.
Mercer Capital provides valuation and transaction advisory services to the
construction and building materials industries.
Industry Segments
Mercer Capital serves construction industry segments from to commercial and civil to residential.We also serve the
building materials sector from aluminum and steel to brick, glass, and lumber.
Mercer Capital Experience
ā€¢	 Family and management succession planning
ā€¢	 Buy-side and sell-side transaction advisory assistance
ā€¢	 Conflict resolution and litigation support
ā€¢	 Trust and estate planning
ā€¢	 Buy-sell agreement valuation, design, and funding advisory
Contact a Mercer Capital professional to discuss your needs in confidence.
Timothy R. Lee, ASA
901.322.9740
leet@mercercapital.com
Nicholas J. Heinz, ASA
901.685.2120
heinzn@mercercapital.com
Brian F. Adams
901.322.9706
adamsb@mercercapital.com
MERCER CAPITAL
Memphis
5100 Poplar Avenue, Suite 2600
Memphis, Tennessee 38137
901.685.2120
Dallas
12201 Merit Drive, Suite 480
Dallas, Texas 75251
214.468.8400
Nashville
102 Woodmont Blvd., Suite 231
Nashville, Tennessee 37205
615.345.0350
www.mercercapital.com
BUSINESS VALUATION 
FINANCIAL ADVISORY SERVICES

More Related Content

What's hot

Construction Industry Snapshot Package-August 2014
Construction Industry Snapshot Package-August 2014Construction Industry Snapshot Package-August 2014
Construction Industry Snapshot Package-August 2014
-PAUL CODLING
Ā 
Colliers North American Office Highlights 2Q 2013
Colliers North American Office Highlights 2Q 2013Colliers North American Office Highlights 2Q 2013
Colliers North American Office Highlights 2Q 2013
Coy Davidson
Ā 

What's hot (20)

U.S. construction trends and outlook (Q1 2015)
U.S. construction trends and outlook (Q1 2015)U.S. construction trends and outlook (Q1 2015)
U.S. construction trends and outlook (Q1 2015)
Ā 
Impacts and implications_of_covid-19_for_the_energy_industry
Impacts and implications_of_covid-19_for_the_energy_industryImpacts and implications_of_covid-19_for_the_energy_industry
Impacts and implications_of_covid-19_for_the_energy_industry
Ā 
Strong Growth Continues ā€“ Finland Wasnā€™t a Hopeless Case, After All
Strong Growth Continues ā€“ Finland Wasnā€™t a Hopeless Case, After AllStrong Growth Continues ā€“ Finland Wasnā€™t a Hopeless Case, After All
Strong Growth Continues ā€“ Finland Wasnā€™t a Hopeless Case, After All
Ā 
Economic Presentation
Economic PresentationEconomic Presentation
Economic Presentation
Ā 
2020 Santa Clara County Construction Forecast
2020 Santa Clara County Construction Forecast2020 Santa Clara County Construction Forecast
2020 Santa Clara County Construction Forecast
Ā 
Australiaā€™s Construction Industry Rises Further
Australiaā€™s Construction Industry Rises FurtherAustraliaā€™s Construction Industry Rises Further
Australiaā€™s Construction Industry Rises Further
Ā 
2019 Energy Outlook
2019 Energy Outlook2019 Energy Outlook
2019 Energy Outlook
Ā 
U.S. construction trends and outlook (Q1 2016)
U.S. construction trends and outlook (Q1 2016)U.S. construction trends and outlook (Q1 2016)
U.S. construction trends and outlook (Q1 2016)
Ā 
Construction| Canada| Building Permits Analysis| February 2019
Construction| Canada| Building Permits Analysis| February 2019Construction| Canada| Building Permits Analysis| February 2019
Construction| Canada| Building Permits Analysis| February 2019
Ā 
Geonesis July 2018
Geonesis July 2018Geonesis July 2018
Geonesis July 2018
Ā 
Construction Industry Snapshot Package-August 2014
Construction Industry Snapshot Package-August 2014Construction Industry Snapshot Package-August 2014
Construction Industry Snapshot Package-August 2014
Ā 
The Future of U.S. Manufacturing: A Change Manifesto
The Future of U.S. Manufacturing: A Change ManifestoThe Future of U.S. Manufacturing: A Change Manifesto
The Future of U.S. Manufacturing: A Change Manifesto
Ā 
Industrial output ā€“ United States ā€“ April 2017
Industrial output ā€“ United States ā€“ April 2017Industrial output ā€“ United States ā€“ April 2017
Industrial output ā€“ United States ā€“ April 2017
Ā 
Key Macro and Micro Indicators| Canada and USA| August 2020 and September 2020
Key Macro and Micro Indicators| Canada and USA| August 2020 and September 2020 Key Macro and Micro Indicators| Canada and USA| August 2020 and September 2020
Key Macro and Micro Indicators| Canada and USA| August 2020 and September 2020
Ā 
Colliers North American Office Highlights 2Q 2013
Colliers North American Office Highlights 2Q 2013Colliers North American Office Highlights 2Q 2013
Colliers North American Office Highlights 2Q 2013
Ā 
Commercial Real Estate Outlook - November 2010
Commercial Real Estate Outlook - November 2010Commercial Real Estate Outlook - November 2010
Commercial Real Estate Outlook - November 2010
Ā 
Power transactions and trends Q2 2019
Power transactions and trends Q2 2019Power transactions and trends Q2 2019
Power transactions and trends Q2 2019
Ā 
JLL St. Louis Industrial Outlook Q3 2019
JLL St. Louis Industrial Outlook Q3 2019JLL St. Louis Industrial Outlook Q3 2019
JLL St. Louis Industrial Outlook Q3 2019
Ā 
Construction Sector| Canada| December 2018
Construction Sector| Canada| December 2018Construction Sector| Canada| December 2018
Construction Sector| Canada| December 2018
Ā 
2017 Commercial Lending Trends Survey
2017 Commercial Lending Trends Survey2017 Commercial Lending Trends Survey
2017 Commercial Lending Trends Survey
Ā 

Similar to Mercer Capital's Value Focus: Construction and Building Materials | Q2 2018 | Segment Focus: Building Materials

Coronavirus Impact Assessment And Mitigation Strategies In Construction And R...
Coronavirus Impact Assessment And Mitigation Strategies In Construction And R...Coronavirus Impact Assessment And Mitigation Strategies In Construction And R...
Coronavirus Impact Assessment And Mitigation Strategies In Construction And R...
SlideTeam
Ā 
If Trumps as good as his word...Pinkham, Myra.Ā Steel Times Inte.docx
If Trumps as good as his word...Pinkham, Myra.Ā Steel Times Inte.docxIf Trumps as good as his word...Pinkham, Myra.Ā Steel Times Inte.docx
If Trumps as good as his word...Pinkham, Myra.Ā Steel Times Inte.docx
wilcockiris
Ā 

Similar to Mercer Capital's Value Focus: Construction and Building Materials | Q2 2018 | Segment Focus: Building Materials (20)

Cost trends - Construction Strategies
Cost trends - Construction StrategiesCost trends - Construction Strategies
Cost trends - Construction Strategies
Ā 
State of the Industry Report 2017
State of the Industry Report 2017State of the Industry Report 2017
State of the Industry Report 2017
Ā 
Mercer Capital's Value Focus: Construction and Building Materials | Q2 2020 |...
Mercer Capital's Value Focus: Construction and Building Materials | Q2 2020 |...Mercer Capital's Value Focus: Construction and Building Materials | Q2 2020 |...
Mercer Capital's Value Focus: Construction and Building Materials | Q2 2020 |...
Ā 
Vertex annual state of the construction industry presentation 2018
Vertex annual state of the construction industry presentation   2018Vertex annual state of the construction industry presentation   2018
Vertex annual state of the construction industry presentation 2018
Ā 
VERTEX Annual State of the Construction Industry 2018
VERTEX Annual State of the Construction Industry 2018VERTEX Annual State of the Construction Industry 2018
VERTEX Annual State of the Construction Industry 2018
Ā 
Mercer Capital's Value Focus: Construction and Building Materials | Q1 2020 |...
Mercer Capital's Value Focus: Construction and Building Materials | Q1 2020 |...Mercer Capital's Value Focus: Construction and Building Materials | Q1 2020 |...
Mercer Capital's Value Focus: Construction and Building Materials | Q1 2020 |...
Ā 
Deloitte Dbriefs webcast - Real estate expectations and market realities in 2019
Deloitte Dbriefs webcast - Real estate expectations and market realities in 2019Deloitte Dbriefs webcast - Real estate expectations and market realities in 2019
Deloitte Dbriefs webcast - Real estate expectations and market realities in 2019
Ā 
VERTEX Annual State of the Construction Industry 2018
VERTEX Annual State of the Construction Industry 2018VERTEX Annual State of the Construction Industry 2018
VERTEX Annual State of the Construction Industry 2018
Ā 
Coronavirus Impact Assessment And Mitigation Strategies In Construction And R...
Coronavirus Impact Assessment And Mitigation Strategies In Construction And R...Coronavirus Impact Assessment And Mitigation Strategies In Construction And R...
Coronavirus Impact Assessment And Mitigation Strategies In Construction And R...
Ā 
Construction industry
Construction industryConstruction industry
Construction industry
Ā 
Construction White Paper
Construction White PaperConstruction White Paper
Construction White Paper
Ā 
Raport Macroeconomic Garanti Bank
Raport Macroeconomic Garanti BankRaport Macroeconomic Garanti Bank
Raport Macroeconomic Garanti Bank
Ā 
Mercer Capital's Value Focus: Real Estate Industry | Q1 2018 | Segment Focus:...
Mercer Capital's Value Focus: Real Estate Industry | Q1 2018 | Segment Focus:...Mercer Capital's Value Focus: Real Estate Industry | Q1 2018 | Segment Focus:...
Mercer Capital's Value Focus: Real Estate Industry | Q1 2018 | Segment Focus:...
Ā 
North America Industrial Construction Cost Guide 2023
North America Industrial Construction Cost Guide 2023North America Industrial Construction Cost Guide 2023
North America Industrial Construction Cost Guide 2023
Ā 
Vietnam construction industry
Vietnam construction industryVietnam construction industry
Vietnam construction industry
Ā 
U.S. construction trends and outlook (Q4 2015)
U.S. construction trends and outlook (Q4 2015)U.S. construction trends and outlook (Q4 2015)
U.S. construction trends and outlook (Q4 2015)
Ā 
Global Insight
Global Insight Global Insight
Global Insight
Ā 
If Trumps as good as his word...Pinkham, Myra.Ā Steel Times Inte.docx
If Trumps as good as his word...Pinkham, Myra.Ā Steel Times Inte.docxIf Trumps as good as his word...Pinkham, Myra.Ā Steel Times Inte.docx
If Trumps as good as his word...Pinkham, Myra.Ā Steel Times Inte.docx
Ā 
FNB Residential Building Stats_Q2 2019
FNB Residential Building Stats_Q2 2019FNB Residential Building Stats_Q2 2019
FNB Residential Building Stats_Q2 2019
Ā 

More from Mercer Capital

More from Mercer Capital (20)

Mercer Capital's Bank Watch | September 2023 | The Interest Rate Environment ...
Mercer Capital's Bank Watch | September 2023 | The Interest Rate Environment ...Mercer Capital's Bank Watch | September 2023 | The Interest Rate Environment ...
Mercer Capital's Bank Watch | September 2023 | The Interest Rate Environment ...
Ā 
Mercer Capital's Investment Management Industry Newsletter | Q2 2023 | Focus:...
Mercer Capital's Investment Management Industry Newsletter | Q2 2023 | Focus:...Mercer Capital's Investment Management Industry Newsletter | Q2 2023 | Focus:...
Mercer Capital's Investment Management Industry Newsletter | Q2 2023 | Focus:...
Ā 
Mercer Capital's Bank Watch | July 2023 | Bank Impairment Testing
Mercer Capital's Bank Watch | July 2023 | Bank Impairment TestingMercer Capital's Bank Watch | July 2023 | Bank Impairment Testing
Mercer Capital's Bank Watch | July 2023 | Bank Impairment Testing
Ā 
Mercer Capital's Value Focus: Transportation & Logistics | Q1 2023 |
Mercer Capital's Value Focus: Transportation & Logistics  | Q1 2023 |Mercer Capital's Value Focus: Transportation & Logistics  | Q1 2023 |
Mercer Capital's Value Focus: Transportation & Logistics | Q1 2023 |
Ā 
Mercer Capital's Value Mattersā„¢ | Issue No. 1, 2023
Mercer Capital's Value Mattersā„¢ | Issue No. 1, 2023  Mercer Capital's Value Mattersā„¢ | Issue No. 1, 2023
Mercer Capital's Value Mattersā„¢ | Issue No. 1, 2023
Ā 
Mercer Capital - Corporate Finance in 30 Minutes Whitepaper.pdf
Mercer Capital - Corporate Finance in 30 Minutes Whitepaper.pdfMercer Capital - Corporate Finance in 30 Minutes Whitepaper.pdf
Mercer Capital - Corporate Finance in 30 Minutes Whitepaper.pdf
Ā 
Mercer Capital's Bank Watch | March 2023 | ā€œIā€™m Not Broke. Iā€™m Just Not Liquid.ā€
Mercer Capital's Bank Watch | March 2023 | ā€œIā€™m Not Broke. Iā€™m Just Not Liquid.ā€Mercer Capital's Bank Watch | March 2023 | ā€œIā€™m Not Broke. Iā€™m Just Not Liquid.ā€
Mercer Capital's Bank Watch | March 2023 | ā€œIā€™m Not Broke. Iā€™m Just Not Liquid.ā€
Ā 
Mercer Capital's Middle Market Transaction Update | Spring 2023
Mercer Capital's Middle Market Transaction Update | Spring 2023Mercer Capital's Middle Market Transaction Update | Spring 2023
Mercer Capital's Middle Market Transaction Update | Spring 2023
Ā 
Mercer Capital's Bank Watch | February 2023 | Themes from Bank Directorā€™s 202...
Mercer Capital's Bank Watch | February 2023 | Themes from Bank Directorā€™s 202...Mercer Capital's Bank Watch | February 2023 | Themes from Bank Directorā€™s 202...
Mercer Capital's Bank Watch | February 2023 | Themes from Bank Directorā€™s 202...
Ā 
Mercer Capital's Investment Management Industry Newsletter | Q4 2023 | Focus:...
Mercer Capital's Investment Management Industry Newsletter | Q4 2023 | Focus:...Mercer Capital's Investment Management Industry Newsletter | Q4 2023 | Focus:...
Mercer Capital's Investment Management Industry Newsletter | Q4 2023 | Focus:...
Ā 
Mercer Capital's Value Focus: Exploration and Production | Fourth Quarter 202...
Mercer Capital's Value Focus: Exploration and Production | Fourth Quarter 202...Mercer Capital's Value Focus: Exploration and Production | Fourth Quarter 202...
Mercer Capital's Value Focus: Exploration and Production | Fourth Quarter 202...
Ā 
Mercer Capital's Middle Market Transaction Update | Winter 2022
Mercer Capital's Middle Market Transaction Update | Winter 2022Mercer Capital's Middle Market Transaction Update | Winter 2022
Mercer Capital's Middle Market Transaction Update | Winter 2022
Ā 
Mercer Capital's Bank Watch | December 2022 | Bank M&A 2022 - Turbulence
Mercer Capital's Bank Watch | December 2022 | Bank M&A 2022 - TurbulenceMercer Capital's Bank Watch | December 2022 | Bank M&A 2022 - Turbulence
Mercer Capital's Bank Watch | December 2022 | Bank M&A 2022 - Turbulence
Ā 
Mercer Capital's Value Mattersā„¢ | Issue No. 3, 2022|
Mercer Capital's Value Mattersā„¢ | Issue No. 3, 2022|Mercer Capital's Value Mattersā„¢ | Issue No. 3, 2022|
Mercer Capital's Value Mattersā„¢ | Issue No. 3, 2022|
Ā 
Mercer Capital's Value Focus: Transportation & Logistics | Q3 2022
Mercer Capital's Value Focus: Transportation & Logistics  | Q3 2022 Mercer Capital's Value Focus: Transportation & Logistics  | Q3 2022
Mercer Capital's Value Focus: Transportation & Logistics | Q3 2022
Ā 
Mercer Capital's Bank Watch | November 2022 | Community Bank Loan Portfolios ...
Mercer Capital's Bank Watch | November 2022 | Community Bank Loan Portfolios ...Mercer Capital's Bank Watch | November 2022 | Community Bank Loan Portfolios ...
Mercer Capital's Bank Watch | November 2022 | Community Bank Loan Portfolios ...
Ā 
Mercer Capital's Investment Management Industry Newsletter | Q3 2022 | Focus:...
Mercer Capital's Investment Management Industry Newsletter | Q3 2022 | Focus:...Mercer Capital's Investment Management Industry Newsletter | Q3 2022 | Focus:...
Mercer Capital's Investment Management Industry Newsletter | Q3 2022 | Focus:...
Ā 
Mercer Capital's Investment Management Industry Newsletter | Q2 2022 | Segmen...
Mercer Capital's Investment Management Industry Newsletter | Q2 2022 | Segmen...Mercer Capital's Investment Management Industry Newsletter | Q2 2022 | Segmen...
Mercer Capital's Investment Management Industry Newsletter | Q2 2022 | Segmen...
Ā 
Mercer Capital's Bank Watch | October 2022 | How Are Tech-Forward Banks Perfo...
Mercer Capital's Bank Watch | October 2022 | How Are Tech-Forward Banks Perfo...Mercer Capital's Bank Watch | October 2022 | How Are Tech-Forward Banks Perfo...
Mercer Capital's Bank Watch | October 2022 | How Are Tech-Forward Banks Perfo...
Ā 
Mercer Capital's Value Focus: Transportation & Logistics | Q2 2022 | Feature...
Mercer Capital's Value Focus: Transportation & Logistics  | Q2 2022 | Feature...Mercer Capital's Value Focus: Transportation & Logistics  | Q2 2022 | Feature...
Mercer Capital's Value Focus: Transportation & Logistics | Q2 2022 | Feature...
Ā 

Recently uploaded

+97470301568>>buy weed in qatar,buy thc oil in qatar doha>>buy cannabis oil i...
+97470301568>>buy weed in qatar,buy thc oil in qatar doha>>buy cannabis oil i...+97470301568>>buy weed in qatar,buy thc oil in qatar doha>>buy cannabis oil i...
+97470301568>>buy weed in qatar,buy thc oil in qatar doha>>buy cannabis oil i...
Health
Ā 
Abortion pills in Saudi Arabia (+919707899604)cytotec pills in dammam
Abortion pills in Saudi Arabia (+919707899604)cytotec pills in dammamAbortion pills in Saudi Arabia (+919707899604)cytotec pills in dammam
Abortion pills in Saudi Arabia (+919707899604)cytotec pills in dammam
samsungultra782445
Ā 
abortion pills in Jeddah Saudi Arabia (+919707899604)cytotec pills in Riyadh
abortion pills in Jeddah Saudi Arabia (+919707899604)cytotec pills in Riyadhabortion pills in Jeddah Saudi Arabia (+919707899604)cytotec pills in Riyadh
abortion pills in Jeddah Saudi Arabia (+919707899604)cytotec pills in Riyadh
samsungultra782445
Ā 

Recently uploaded (20)

Strategic Resources May 2024 Corporate Presentation
Strategic Resources May 2024 Corporate PresentationStrategic Resources May 2024 Corporate Presentation
Strategic Resources May 2024 Corporate Presentation
Ā 
+97470301568>>buy weed in qatar,buy thc oil in qatar doha>>buy cannabis oil i...
+97470301568>>buy weed in qatar,buy thc oil in qatar doha>>buy cannabis oil i...+97470301568>>buy weed in qatar,buy thc oil in qatar doha>>buy cannabis oil i...
+97470301568>>buy weed in qatar,buy thc oil in qatar doha>>buy cannabis oil i...
Ā 
Toronto dominion bank investor presentation.pdf
Toronto dominion bank investor presentation.pdfToronto dominion bank investor presentation.pdf
Toronto dominion bank investor presentation.pdf
Ā 
Q1 2024 Conference Call Presentation vF.pdf
Q1 2024 Conference Call Presentation vF.pdfQ1 2024 Conference Call Presentation vF.pdf
Q1 2024 Conference Call Presentation vF.pdf
Ā 
BhubaneswaršŸŒ¹Ravi Tailkes ā¤CALL GIRLS 9777949614 šŸ’Ÿ CALL GIRLS IN bhubaneswar ...
BhubaneswaršŸŒ¹Ravi Tailkes  ā¤CALL GIRLS 9777949614 šŸ’Ÿ CALL GIRLS IN bhubaneswar ...BhubaneswaršŸŒ¹Ravi Tailkes  ā¤CALL GIRLS 9777949614 šŸ’Ÿ CALL GIRLS IN bhubaneswar ...
BhubaneswaršŸŒ¹Ravi Tailkes ā¤CALL GIRLS 9777949614 šŸ’Ÿ CALL GIRLS IN bhubaneswar ...
Ā 
7 tips trading Deriv Accumulator Options
7 tips trading Deriv Accumulator Options7 tips trading Deriv Accumulator Options
7 tips trading Deriv Accumulator Options
Ā 
Test bank for advanced assessment interpreting findings and formulating diffe...
Test bank for advanced assessment interpreting findings and formulating diffe...Test bank for advanced assessment interpreting findings and formulating diffe...
Test bank for advanced assessment interpreting findings and formulating diffe...
Ā 
Famous Kala Jadu, Black magic expert in Faisalabad and Kala ilam specialist i...
Famous Kala Jadu, Black magic expert in Faisalabad and Kala ilam specialist i...Famous Kala Jadu, Black magic expert in Faisalabad and Kala ilam specialist i...
Famous Kala Jadu, Black magic expert in Faisalabad and Kala ilam specialist i...
Ā 
Avoidable Errors in Payroll Compliance for Payroll Services Providers - Globu...
Avoidable Errors in Payroll Compliance for Payroll Services Providers - Globu...Avoidable Errors in Payroll Compliance for Payroll Services Providers - Globu...
Avoidable Errors in Payroll Compliance for Payroll Services Providers - Globu...
Ā 
Abortion pills in Saudi Arabia (+919707899604)cytotec pills in dammam
Abortion pills in Saudi Arabia (+919707899604)cytotec pills in dammamAbortion pills in Saudi Arabia (+919707899604)cytotec pills in dammam
Abortion pills in Saudi Arabia (+919707899604)cytotec pills in dammam
Ā 
Lion One Corporate Presentation May 2024
Lion One Corporate Presentation May 2024Lion One Corporate Presentation May 2024
Lion One Corporate Presentation May 2024
Ā 
abortion pills in Jeddah Saudi Arabia (+919707899604)cytotec pills in Riyadh
abortion pills in Jeddah Saudi Arabia (+919707899604)cytotec pills in Riyadhabortion pills in Jeddah Saudi Arabia (+919707899604)cytotec pills in Riyadh
abortion pills in Jeddah Saudi Arabia (+919707899604)cytotec pills in Riyadh
Ā 
Famous No1 Amil Baba Love marriage Astrologer Specialist Expert In Pakistan a...
Famous No1 Amil Baba Love marriage Astrologer Specialist Expert In Pakistan a...Famous No1 Amil Baba Love marriage Astrologer Specialist Expert In Pakistan a...
Famous No1 Amil Baba Love marriage Astrologer Specialist Expert In Pakistan a...
Ā 
falcon-invoice-discounting-unlocking-prime-investment-opportunities
falcon-invoice-discounting-unlocking-prime-investment-opportunitiesfalcon-invoice-discounting-unlocking-prime-investment-opportunities
falcon-invoice-discounting-unlocking-prime-investment-opportunities
Ā 
Mahendragarh Escorts šŸ„° 8617370543 Call Girls Offer VIP Hot Girls
Mahendragarh Escorts šŸ„° 8617370543 Call Girls Offer VIP Hot GirlsMahendragarh Escorts šŸ„° 8617370543 Call Girls Offer VIP Hot Girls
Mahendragarh Escorts šŸ„° 8617370543 Call Girls Offer VIP Hot Girls
Ā 
20240419-SMC-submission-Annual-Superannuation-Performance-Test-ā€“-design-optio...
20240419-SMC-submission-Annual-Superannuation-Performance-Test-ā€“-design-optio...20240419-SMC-submission-Annual-Superannuation-Performance-Test-ā€“-design-optio...
20240419-SMC-submission-Annual-Superannuation-Performance-Test-ā€“-design-optio...
Ā 
cost-volume-profit analysis.ppt(managerial accounting).pptx
cost-volume-profit analysis.ppt(managerial accounting).pptxcost-volume-profit analysis.ppt(managerial accounting).pptx
cost-volume-profit analysis.ppt(managerial accounting).pptx
Ā 
Technology industry / Finnish economic outlook
Technology industry / Finnish economic outlookTechnology industry / Finnish economic outlook
Technology industry / Finnish economic outlook
Ā 
Explore Dual Citizenship in Africa | Citizenship Benefits & Requirements
Explore Dual Citizenship in Africa | Citizenship Benefits & RequirementsExplore Dual Citizenship in Africa | Citizenship Benefits & Requirements
Explore Dual Citizenship in Africa | Citizenship Benefits & Requirements
Ā 
NO1 Verified Online Love Vashikaran Specialist Kala Jadu Expert Specialist In...
NO1 Verified Online Love Vashikaran Specialist Kala Jadu Expert Specialist In...NO1 Verified Online Love Vashikaran Specialist Kala Jadu Expert Specialist In...
NO1 Verified Online Love Vashikaran Specialist Kala Jadu Expert Specialist In...
Ā 

Mercer Capital's Value Focus: Construction and Building Materials | Q2 2018 | Segment Focus: Building Materials

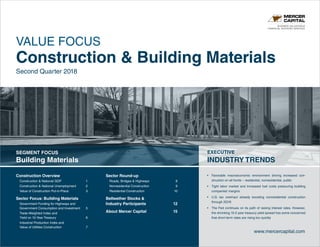
  • 1. BUSINESS VALUATION & FINANCIAL ADVISORY SERVICES Construction Overview Construction National GDP 1 Construction National Unemployment 2 Value of Construction Put-in-Place 3 Sector Focus: Building Materials Government Funding for Highways and Government Consumption and Investment 5 Trade-Weighted Index and Yield on 10-Year Treasury 6 Industrial Production Index and Value of Utilities Construction 7 Sector Round-up Roads, Bridges Highways 8 Nonresidential Construction 9 Residential Construction 10 Bellwether Stocks Industry Participants 12 About Mercer Capital 15 www.mercercapital.com VALUE FOCUS Second Quarter 2018 Construction Building Materials SEGMENT FOCUS Building Materials EXECUTIVE INDUSTRY TRENDS ā€¢ Favorable macroeconomic environment driving increased con- struction on all fronts ā€“ residential, nonresidential, public ā€¢ Tight labor market and increased fuel costs pressuring building companiesā€™ margins ā€¢ U.S. tax overhaul already boosting nonresidential construction through 2Q18 ā€¢ The Fed continues on its path of raising interest rates. However, the shrinking 10-2 year treasury yield spread has some concerned that short-term rates are rising too quickly
  • 2. Ā© 2018 Mercer Capital // www.mercercapital.com 1 Mercer Capitalā€™s Value Focus: Construction Building Materials Second Quarter 2018 $0 $100 $200 $300 $400 $500 $600 $700 $800 -8.0% -6.0% -4.0% -2.0% 0.0% 2.0% 4.0% 2008 2009 2010 2011 2012 2013 2014 2015 2016 2017 2018 GDP($Billions) AnnualizedRealGrowthRate Quarterly Growth Average Quarterly Growth GDP (Current Dollars) Source: Trading Economics -8% -4% 0% 4% 8% Q 2-2008 Q 2-2009 Q 2-2010 Q 2-2011 Q 2-2012 Q 2-2013 Q 2-2014 Q 2-2015 Q 2-2016 Q 2-2017 Q 2-2018 National Construction Source: Trading Economics, U.S. Bureau of Economic Analysis Construction Overview Construction National GDP GDP rose 5.4% over the past year through the second quarter of 2018, which was the highest year-over-year rate in the examined period. Since 2008, construction has averaged 3.6% of national GDP, and it accounted for 3.3% of GDP over 1Q 2018. Construction has steadily recovered since the decline caused by the 2008 financial crisis, experiencing growth consistent with that of national GDP. Fluctuations in construction GDP have now stabilized, with most quarterly growth rates lying in the plus or minus 0-2 percent range since 2012. Year-over-year construction GDP has increased 2.1%, and plans for increased infrastructure spending, inventory constraints in the existing home market, and improved corporate profitability should allow for continued industry growth. Construction Gross Domestic Product % Change in GDP Construction GDP Period % Change Q-o-Q 1.0% Y-o-Y 2.1% National GDP Period % Change Q-o-Q 1.9% Y-o-Y 5.4% * Construction data through Q1 2018
  • 3. Ā© 2018 Mercer Capital // www.mercercapital.com 2 Mercer Capitalā€™s Value Focus: Construction Building Materials Second Quarter 2018 The Federal Reserve believes a healthy economy typically has an unemployment rate between 4.5% and 6.0%. The current level of 4.0% falls slightly below this range, indicative of a tight labor market. The unemployment rate fell to 3.8% in May which was the lowest rate of the ten year period. The unemployment rate in the construction industry is typically more volatile because it is a cyclical and seasonal industry. The major contributing factor to the industryā€™s seasonality is the weather. Production of materials and projects generally decrease during the colder, winter months. Construction unemployment is currently at 4.7%, comparable to 4.5% at the same time last year. A lack of skilled laborers has become an industry-wide issue and has contributed to wage growth and increased costs for builders. Lower unemployment rates suggest an increase of activity within the industry. 0.0% 5.0% 10.0% 15.0% 20.0% 25.0% 30.0% Q 2-2008 Q 2-2008 Q 2-2010 Q 2-2011 Q 2-2012 Q 2-2013 Q 2-2014 Q 2-2015 Q 2-2016 Q 2-2017 Q 2-2018 National Construction Source: U.S. Bureau of Labor Statistics Construction Overview Construction National Unemployment Unemployment Rate
  • 4. Ā© 2018 Mercer Capital // www.mercercapital.com 3 Mercer Capitalā€™s Value Focus: Construction Building Materials Second Quarter 2018 The value of construction put-in-place is the total value of construction work done in the U.S. for a particular period. The U.S. Census Bureau tracks this data and reports the total monthly. This value includes, but is not limited to, the building materials costs, labor costs, profit, costs of engineering, interest, and taxes. Year-over-year put-in-place construction has increased by 5.5% for residential and by 6.2% for nonresidential. Nonresidential construction grew by 2.3% quarter-over-quarter through June 2018. The increase in non-residential construction comes in the midst of delays for the Presidentā€™s $1.5 trillion worth of infrastructure projects due to financing issues. Progress in these plans would create significant public work projects and could continue to accelerate nonresidential growth. Growth in residential construction has been choppier in comparison to nonresidential construction but still continued to increase quarter-over-quarter. Construction Overview Value of Construction Put-in-Place $0 $100 $200 $300 $400 $500 $600 $700 $800 Q 2-2008 Q 2-2009 Q 2-2010 Q 2-2011 Q 2-2012 Q 2-2013 Q 2-2014 Q 2-2015 Q 2-2016 Q 2-2017 Q 2-2018 $Billions Residential Nonresidential Source: U.S. Census Bureau Value of Construction Put-in-Place Residential Period % Change Q-o-Q 0.9% Y-o-Y 5.5% Nonresidential Period % Change Q-o-Q 2.3% Y-o-Y 6.2%
  • 5. Ā© 2018 Mercer Capital // www.mercercapital.com 4 Mercer Capitalā€™s Value Focus: Construction Building Materials Second Quarter 2018 State and local governments are typically in charge of their construction projects, but they rely on federal funding to complete many projects. Despite optimism regarding a potential $1.5 trillion infrastructure plan from the Trump administration to close the U.S. infrastructure gap, no policy has currently been implemented and the infrastructure package took a back seat to tax reform and other initiatives. According to industry executives, federal funds usually take 18 to 24 months to flow through to projects, and companies are still experiencing benefits from the 2015 FAST Act. However, overall infrastructure activity has been sluggish the past couple of years despite the pervasive need for infrastructure investment. State and local initiatives have appeared perhaps due to diminished expectations for a grand federal plan and total government consumption and investment has increased in recent periods. Building materials benefited from both healthy residential and nonresidential construction demand over the past year. Low home inventories and continuing improvement in employment and wages have increased demand for new home starts and subdivision development. Home prices continued to rise and rising interest rates may present headwinds due to increasing mortgage rates. In addition to increased consumer and business confidence, reduced corporate tax rates from the U.S. Tax Cuts and Jobs Act have boosted prospects for nonresidential construction. The construction industryā€™s strong performance and sustained economic expansion has been a boon for American aggregate producers. U.S. cement consumption has continued to increase from its low point in 2010. Cement consumption increased 2.8% in 2017 to 96.8 million metric tons, which is still 25% below the all-time peak in 2005. The U.S. was the third-largest cement producer in the world in 2017 behind China and India. Despite a favorable macroeconomic environment and healthy revenues, the building materials industry has experienced increased cost pressures. Higher energy costs (oil, coal, petcoke) have dragged on the industryā€™s earnings. A tight labor market has also increased the competition for employees in the building materials industry and driven up wage costs. Labor shortages are affecting contractorsā€™ capacity for work and may be limiting potential levels of activity. Since the prices for most large contracts are negotiated up front, the unexpected rise in costs has compressed margins. However, companies will have an opportunity to pass on higher prices as they negotiate new contracts. Increased demand will also boost product prices as the industry nears domestic production capacity. Concerns over increased building materials prices may dampen enthusiasm for publicly funded work as the cement producer price index hit a ten-year high in June 2018 and recently imposed tariffs on Chinese imports will increase the cost of imported materials. Sector Focus Building Materials
  • 6. Ā© 2018 Mercer Capital // www.mercercapital.com 5 Mercer Capitalā€™s Value Focus: Construction Building Materials Second Quarter 2018 Building materials are a crucial input to construction projects. Without funding, however, construction projects cannot be completed. Much of this funding comes from public resources, so the industry is typically concerned with the level of government spending on construction activity. Government consumption expenditures and gross investments reached high levels during the recession to boost the economy and declined significantly in the years following. After stagnating for much of 2016 and 2017, GCI has grown consistently for the past three quarters and reached the highest levels since 2011. The growth in GCI comes despite the absence of the touted infrastructure investment bill under the new administration. Building Materials Government Funding for Highways and Government Consumption and Investment Government Consumption and Investment $2,800 $2,900 $3,000 $3,100 $3,200 $3,300 $3,400 Q 2-2008 Q 2-2009 Q 2-2010 Q 2-2011 Q 2-2012 Q 2-2013 Q 2-2014 Q 2-2015 Q 2-2016 Q 2-2017 Q 2-2018 $Billions Source: St. Louis Fed | U.S. Bureau of Economic Analysis Government Consumption Investment Period % Change Q-o-Q 0.6% Y-o-Y 1.3%
  • 7. Ā© 2018 Mercer Capital // www.mercercapital.com 6 Mercer Capitalā€™s Value Focus: Construction Building Materials Second Quarter 2018 80 90 100 110 120 130 Q 2-2008 Q 2-2008 Q 2-2010 Q 2-2011 Q 2-2012 Q 2-2013 Q 2-2014 Q 2-2015 Q 2-2016 Q 2-2017 Q 2-2018 Source: St. Louis Fed | Board of Governors of the Federal Reserve (US) 0.0% 1.0% 2.0% 3.0% 4.0% 5.0% Q 2-2008 Q 2-2008 Q 2-2010 Q 2-2011 Q 2-2012 Q 2-2013 Q 2-2014 Q 2-2015 Q 2-2016 Q 2-2017 Q 2-2018 Source: St. Louis Fed | Board of Governors of the Federal Reserve (US) Building Materials Trade-Weighted Index and Yield on 10-Year Treasury The Trade-Weighted Index measures the relative strength of the U.S. dollar in comparison to foreign currencies, putting an emphasized weight on the most common trade partners and largest economies. When the dollar is strong, imports become cheaper and exports become more expensive. The dollar is near its strongest level in the last 10 years, which increases the cost for other countries to purchase U.S. building materials and decreases sales volume. The TWI has increased throughout 2018 after a decline in 2017. Divergence in monetary policy between the U.S. and the international community has boosted the dollarā€™s appreciation as the Fed has increased rates and begun its process of shrinking its balance sheet. The yield on 10-Year Treasury Bonds acts as a proxy for how expensive it is to finance construction projects. An increase in yields raises the cost of investment, but it can also signify increasing optimism about future economic growth, which leads to more spending in the construction industry. The 10-year yield reached its highest level since 2011 as rates have increased steadily. Trade-Weighted Index Yield on 10-Year Treasury Trade-Weighted Index Period % Change Q-o-Q 4.5% Y-o-Y 1.1% Yield on 10-Year Treasury Period Change Q-o-Q 7 BPS Y-o-Y 72 BPS
  • 8. Ā© 2018 Mercer Capital // www.mercercapital.com 7 Mercer Capitalā€™s Value Focus: Construction Building Materials Second Quarter 2018 80 85 90 95 100 105 110 Q 2-2008 Q 2-2008 Q 2-2010 Q 2-2011 Q 2-2012 Q 2-2013 Q 2-2014 Q 2-2015 Q 2-2016 Q 2-2017 Q 2-2018 Source: St. Louis Fed | Board of Governors of the Federal Reserve (US) $0 $40 $80 $120 $160 $200 Q 2-2008 Q 2-2008 Q 2-2010 Q 2-2011 Q 2-2012 Q 2-2013 Q 2-2014 Q 2-2015 Q 2-2016 Q 2-2017 Q 2-2018 $Billions Source: U.S. Census Bureau Building Materials Industrial Production Index and Value of Utilities Construction The Industrial Production Index is an indicator of economic activity that measures real production output of the manufacturing, mining, and utilities industries. It acts as a barometer of demand for industrial products and manufacturing activity. Building materials such as sand and gravel are important inputs of industrial production. After oscillating for a couple of years, IPI steadily increased for most of 2017 and 2018. In April 2018, IPI reached its highest level of the examined period. Cement and ready-mix concrete are used in most construction projects involving the utilities subsector such as transportation, energy, gas, water, and sewage. There will always be a need for such infrastructure, so building materials companies can rely on this revenue stream even though the growth rate of new projects fluctuates. The value of utilities construction has increased 10.2% over the past year. Industrial Production Index Value of Utilities Construction Industrial Production Index Period % Change Q-o-Q 0.9% Y-o-Y 3.5% Value of Utilities Construction Period % Change Q-o-Q 6.8% Y-o-Y 10.2%
  • 9. Ā© 2018 Mercer Capital // www.mercercapital.com 8 Mercer Capitalā€™s Value Focus: Construction Building Materials Second Quarter 2018 The yield on 10-Year Treasury Bonds can indirectly affect the road contracting industry. As discussed previously, higher interest rates make construction projects more expensive to undertake, but they may also signify increased optimism about economic growth. As seen in the chart below, the 10-year yield has experienced a downward trend for much of the past ten years as the Fed attempted to aid the economic recovery by encouraging an increase in investment. The 10-year yield has increased by 72 basis points over the past year due to a shift in the Fedā€™s stance on interest rates and expectations of stronger economic growth and higher inflation. One interest rate measure to watch is the spread between 10-year and 2-year treasury yields. A spread approaching zero or even crossing into negative territory has historically preceded a recession and potentially signals that the Fed has tightened rates too much. The spread declined to 0.38% in June 2018 which is the lowest spread in the past ten years as the growth in 2-year yields, which the Fed has more influence over, has outpaced the growth in 10-year yields. 0.0% 1.0% 2.0% 3.0% 4.0% 5.0% Q 2-2008 Q 2-2008 Q 2-2010 Q 2-2011 Q 2-2012 Q 2-2013 Q 2-2014 Q 2-2015 Q 2-2016 Q 2-2017 Q 2-2018 Source: St. Louis Fed | Board of Governors of the Federal Reserve (US) Sector Round-up Roads, Bridges Highways Yield on 10-Year Treasury Yield on 10-Year Treasury Period Change Q-o-Q 7 BPS Y-o-Y 72 BPS
  • 10. Ā© 2018 Mercer Capital // www.mercercapital.com 9 Mercer Capitalā€™s Value Focus: Construction Building Materials Second Quarter 2018 Corporate profit is essential for companies not only to survive but also to grow and expand. When corporate profit increases, companies are more willing and able to open new branches and divisions. These additions lead to more commercial construction. As seen in the chart below, corporate profit has increased over the past year to the highest level of the past ten years. In addition to favorable macroeconomic trends discussed in other sections, the U.S.Tax Cuts and Jobs Act of 2017 lowered the corporate tax rate from 35% to 21%. The dip in the fourth quarter of 2017 is partially due to one-time deferred tax asset write-downs incurred by companies owing to the new tax rate. A lower tax burden going forward should encourage increased investment. $0 $500 $1,000 $1,500 $2,000 $2,500 Q 2-2008 Q 2-2009 Q 2-2010 Q 2-2011 Q 2-2012 Q 2-2013 Q 2-2014 Q 2-2015 Q 2-2016 Q 2-2017 Q 2-2018 $Billions Source: St. Louis Federal Reserve Sector Round-up Nonresidential Construction Corporate Profit Corporate Profit Period % Change Q-o-Q 3.3% Y-o-Y 6.4%
  • 11. Ā© 2018 Mercer Capital // www.mercercapital.com 10 Mercer Capitalā€™s Value Focus: Construction Building Materials Second Quarter 2018 The National Association of Home Builders conducts two separate surveys, the Housing Market Index (HMI) and the Remodeling Market Index (RMI), to measure confidence in the home building industry. Respondents rate their activity on a scale from 1-100 with 50 being average. The HMI is produced monthly and asks respondents to rate market conditions both at present and looking forward six months. The monthly index has remained above 50 since July 2014 and reached a ten year high of 74 in December 2017. The RMI is produced quarterly and asks respondents to rate their work volume as either higher or lower than the previous quarter. The monthly index has fluctuated between 50 and 60 since the second quarter of 2013. 0 20 40 60 80 100 Q 2-2008 Q 2-2008 Q 2-2010 Q 2-2011 Q 2-2012 Q 2-2013 Q 2-2014 Q 2-2015 Q 2-2016 Q 2-2017 Q 2-2018 HMI RMI Source: National Association of Home Builders Note: RMI is measured quarterly and approximated for a monthly basis using a straight-line approach. Sector Round-up Residential Construction NAHB HMI and RMI NAHB HMI Period % Change Q-o-Q -2.9% Y-o-Y 3.0% NAHB RMI Period % Change Q-o-Q 1.8% Y-o-Y 5.5%
  • 12. Ā© 2018 Mercer Capital // www.mercercapital.com 11 Mercer Capitalā€™s Value Focus: Construction Building Materials Second Quarter 2018 Sector Round-up Residential Construction (continued) Building permits and housing starts are two important indicators for the home building industry. Both reflect demand, consumer confidence, and the feasibility of financing construction projects. Building permits can be issued and then shelved by builders; therefore, housing starts are a better focused measure of current activity within the industry. After declining nearly 75% during from Q1 2006 to Q1 2009 as the housing bubble unwound, housing permits and starts have steadily recovered but are unlikely to reach pre-recession highs. After strong growth in the first quarter of 2018 and low existing inventory, housing starts had a disappointing second quarter as single family starts stagnated year-over-year and private housing starts declined 4.2%. 0.0 0.2 0.4 0.6 0.8 1.0 1.2 1.4 1.6 1.8 2.0 2.2 2.4 MillionsofUnits Private Housing Starts Single Family Starts Private Building Permits Single Family Building Permits Source: U.S. Census Bureau, Seasonally Adjusted Data Note: Permits at a given date are generally a leading indicator of future starts. Beginning with January 2004, building permit data reflects the change to the 20,000 place series. Private Housing Single Family Housing Seasonally Adjusted Annualized Rates of New Housing Starts and Building Permits Private Housing Starts Single Family Starts Private Building Permits Single Family Building Permits Period % Change Period % Change Period % Change Period % Change Q-o-Q -11.6% Q-o-Q -2.7% Q-o-Q -6.2% Q-o-Q 0.2% Y-o-Y -4.2% Y-o-Y -0.2% Y-o-Y -1.5% Y-o-Y 4.9%
  • 13. Ā© 2018 Mercer Capital // www.mercercapital.com 12 Mercer Capitalā€™s Value Focus: Construction Building Materials Second Quarter 2018 Ticker Price at 6/30/18 52-Week Perf. LTM Revenue Enterprise Value Debt / MVTC EBITDA Margin EV / EBITDA (x) TEV / Next Yr EBITDA (x) Price / LTM Earnings Residential Beazer Homes USA, Inc. NYSE: BZH 14.75 7.5% 2,012 1,641 73.7% 4.6% 17.87 15.13 NM D.R. Horton, Inc. NYSE: DHI 41.00 18.6% 15,722 17,899 16.7% 12.8% 8.91 7.66 11.80 KB Home NYSE: KBH 27.24 13.6% 4,520 4,068 49.7% 7.9% 11.37 7.40 19.76 Lennar Corporation NYSE: LEN 52.50 0.4% 15,487 27,767 40.0% 10.0% 17.93 9.03 13.89 LGI Homes, Inc. NasdaqGS: LGIH 57.73 43.7% 1,470 1,825 29.8% 13.5% 9.17 7.88 8.83 M.D.C. Holdings, Inc. NYSE: MDC 30.77 -5.9% 2,726 2,419 38.5% 8.5% 10.49 7.07 9.18 NVR, Inc. NYSE: NVR 2,970.35 23.2% 6,819 10,942 5.3% 14.4% 11.13 9.91 16.74 PulteGroup, Inc. NYSE: PHM 28.75 17.2% 9,461 11,382 28.5% 15.0% 8.00 7.48 11.23 Taylor Morrison Home Corporation NYSE: TMHC 20.78 -13.5% 3,941 3,450 38.1% 9.3% 9.39 7.82 12.26 Meritage Homes Corporation NYSE: MTH 43.95 4.1% 3,387 2,925 42.3% 8.4% 10.23 8.44 10.11 TRI Pointe Group, Inc. NYSE: TPH 16.36 24.0% 3,201 3,635 36.9% 14.0% 8.12 7.54 9.79 Median 14% 3,941 3,635 38.1% 10.0% 10.23 7.82 11.51 All figures reported in millions, except per share data Source: Capital IQ Bellwether Stocks Industry Participants
  • 14. Ā© 2018 Mercer Capital // www.mercercapital.com 13 Mercer Capitalā€™s Value Focus: Construction Building Materials Second Quarter 2018 Ticker Price at 6/30/18 52-Week Perf. LTM Revenue Enterprise Value Debt / MVTC EBITDA Margin EV / EBITDA (x) TEV / Next Yr EBITDA (x) Price / LTM Earnings Building Materials Eagle Materials Inc. NYSE: EXP 104.97 13.6% 1,414 5,651 11.4% 29.7% 13.46 10.59 18.81 Martin Marietta Materials, Inc. NYSE: MLM 223.33 0.3% 3,814 15,668 18.6% 27.3% 15.07 12.44 19.46 Summit Materials, Inc. NYSE: SUM 26.25 -7.8% 2,040 4,596 38.5% 19.8% 11.37 8.99 27.34 U.S. Concrete, Inc. NasdaqCM: USCR 52.50 -33.2% 1,428 1,624 45.9% 11.4% 9.94 6.64 25.44 Vulcan Materials Company NYSE: VMC 129.06 1.9% 4,127 19,997 15.5% 24.3% 19.93 16.17 26.24 CEMEX, S.A.B. de C.V. BMV: CEMEX CPO 0.66 -29.5% 13,567 21,129 51.4% 18.3% 8.50 7.68 18.03 CRH plc ISE: CRG 35.41 0.2% 29,534 37,018 28.2% 12.4% 10.15 8.75 13.91 HeidelbergCement AG DB: HEI 84.38 -12.7% 20,202 29,942 44.7% 15.8% 9.37 7.51 13.63 LafargeHolcim Ltd SWX: LHN 48.70 -15.0% 26,655 46,288 39.7% 4.8% 36.04 7.39 NM Median -8% 4,127 19,997 38.5% 18.3% 11.37 8.75 19.14 Roads, Bridges, and Highways Granite Construction Incorporated NYSE: GVA 55.66 15% 3,129 2,324 16.1% 6.3% 11.71 8.41 37.73 Sterling Construction Company, Inc. NasdaqGS: STRL 13.03 -0.3% 1,049 389 19.7% 4.4% 8.39 6.73 16.68 Tutor Perini Corporation NYSE: TPC 18.45 -35.8% 4,541 1,550 47.2% 4.5% 7.57 5.03 7.84 Median 0% 3,129 1,550 19.7% 4.5% 8.39 6.73 16.68 All figures reported in millions, except per share data Source: Capital IQ Bellwether Stocks Industry Participants Note: CX, CRG, HEI, and LHN report in foreign currency. Margin and multiples unaffected and shown for analysis.
  • 15. Ā© 2018 Mercer Capital // www.mercercapital.com 14 Mercer Capitalā€™s Value Focus: Construction Building Materials Second Quarter 2018 Ticker Price at 6/30/18 52-Week Perf. LTM Revenue Enterprise Value Debt / MVTC EBITDA Margin EV / EBITDA (x) TEV / Next Yr EBITDA (x) Price / LTM Earnings Nonresidential AECOM NYSE: ACM 33.03 2% 19,706 8,601 42.3% 3.8% 11.45 8.65 37.21 Dycom Industries, Inc. NYSE: DY 94.51 6% 2,768 3,640 20.5% 9.2% 14.23 8.20 25.25 EMCOR Group, Inc. NYSE: EME 76.18 16.5% 7,754 4,408 6.4% 6.2% 9.21 9.45 18.28 Fluor Corporation NYSE: FLR 48.78 7% 19,677 6,799 19.5% 3.9% 8.77 7.76 27.12 Jacobs Engineering Group Inc. NYSE: JEC 63.49 16.7% 13,496 10,773 20.7% 7.0% 11.39 9.04 28.53 MasTec, Inc. NYSE: MTZ 50.75 12% 6,573 5,390 28.8% 8.4% 9.77 7.48 12.32 Quanta Services, Inc. NYSE: PWR 33.40 1.5% 10,162 5,801 14.6% 6.8% 8.41 6.63 16.56 Median - Nonresidential 7% 10,162 5,801 20.5% 6.8% 9.77 8.20 25.25 All figures reported in millions, except per share data Source: Capital IQ Bellwether Stocks Industry Participants
  • 16. Mercer Capital Construction Building Materials Industry Services Contact Us Copyright Ā© 2018 Mercer Capital Management, Inc. All rights reserved. It is illegal under Federal law to reproduce this publication or any portion of its contents without the publisherā€™s permission. Media quotations with source attribution are encouraged. Reporters requesting additional information or editorial comment should contact Barbara Walters Price at 901.685.2120. Mercer Capitalā€™s Industry Focus is published quarterly and does not constitute legal or financial consulting advice. It is offered as an information service to our clients and friends. Those interested in specific guidance for legal or accounting matters should seek competent professional advice. Inquiries to discuss specific valuation matters are welcomed. To add your name to our mailing list to receive this complimentary publication, visit our web site at www.mercercapital.com. Mercer Capital provides valuation and transaction advisory services to the construction and building materials industries. Industry Segments Mercer Capital serves construction industry segments from to commercial and civil to residential.We also serve the building materials sector from aluminum and steel to brick, glass, and lumber. Mercer Capital Experience ā€¢ Family and management succession planning ā€¢ Buy-side and sell-side transaction advisory assistance ā€¢ Conflict resolution and litigation support ā€¢ Trust and estate planning ā€¢ Buy-sell agreement valuation, design, and funding advisory Contact a Mercer Capital professional to discuss your needs in confidence. Timothy R. Lee, ASA 901.322.9740 leet@mercercapital.com Nicholas J. Heinz, ASA 901.685.2120 heinzn@mercercapital.com Brian F. Adams 901.322.9706 adamsb@mercercapital.com MERCER CAPITAL Memphis 5100 Poplar Avenue, Suite 2600 Memphis, Tennessee 38137 901.685.2120 Dallas 12201 Merit Drive, Suite 480 Dallas, Texas 75251 214.468.8400 Nashville 102 Woodmont Blvd., Suite 231 Nashville, Tennessee 37205 615.345.0350 www.mercercapital.com BUSINESS VALUATION FINANCIAL ADVISORY SERVICES