
Recomendados
Mais conteúdo relacionado
Mais procurados
Mais procurados (19)
Semelhante a POSTER FINAL
Semelhante a POSTER FINAL (20)
POSTER FINAL
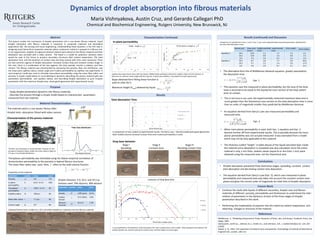
- 1. Dynamics of droplet absorption into fibrous materials Maria Vishnyakova, Austin Cruz, and Gerardo Callegari PhD Chemical and Biochemical Engineering, Rutgers University, New Brunswick, NJ - Study droplet penetration dynamics into fibrous materials. - Describe the process through a simple model based on characteristic parameters measured from the material. The material used is a non-woven fibrous filter. Droplet tests: absorption filmed with video camera: Solution used: 70% Glycerol, 30% ethanol Droplet Volumes: 5.9, 10.2, and 19.3 µL This project studies the mechanism of droplet penetration into a non-woven fibrous material. Liquid droplet interaction with fibrous materials is important in composite materials and biomedical applications like bio-sensing and tissue engineering. Understanding these dynamics is the first step in designing novel hierarchical composite materials where a polymeric solution is sprayed on a fibrous mat. In our experiments, droplets of a glycerol-ethanol solution were placed on the fibrous material and their absorption was recorded with a video camera. The liquid is a model for polymeric solutions which would be used in the future to produce secondary structures after solvent evaporation. The total absorption time, and the evolution of contact area and drop volume with time, were measured. There are two common regimes of droplet absorption: Constant Contact Area and Constant Contact Angle. In this case, there is a combination of the two regimes: the drop spreads, reaches a plateau, and then retracts. The fibrous material was characterized by measuring the porosity, fiber size distribution, and the mean pore capillary radius, contact angle and in-plane permeability by capillary rise experiments. A semi-empirical model was used to calculate trans-planar permeability using the mean fiber radius and porosity. A simple model based on Lucas-Washburn dynamics describing the porous material with two parameters (permeability and capillary radius), and describing droplet absorption as pure in-plane penetration with the maximum droplet area, shows good agreement with experimental results. Material Characterization Purpose Abstract Characterization Continued In our experiments, the behaviour of the drop base is far more complex than in the models. After landing on the material, the droplet spreads out, reaches a period of constant area, and then begins to retract again. Results (continued) and Discussion Future Work References Volume (µL) Area used (mm2) height predicted (mm) experimental time time using k time using kt Equation 2 19.3 22.0 1.1 1.7 1.5 4.1 10.2 14.9 0.9 1.4 0.9 2.5 5.9 7.4 1.0 0.7 1.2 3.4 Equation 1 19.3 8.7 2.8 1.7 9.0 26.6 10.2 5.7 2.2 1.4 5.9 17.4 5.9 4.0 1.9 0.7 4.1 12.1 • Droplet absorption presented three distinctive stages: spreading, constant contact area absorption and decreasing contact area absorption. • The equation derived from Darcy’s Law (Eqn. 2), which uses measured in-plane permeability and measured area only takes into account the constant contact area phase and gives the correct order of magnitude for total time of droplet absorption. • Continue the study with liquids of different viscosities, droplet sizes and fibrous materials of different porosity, permeability and thicknesses to understand the inter- relation of parameters in the dynamics of each of the three stages of droplet penetration described in this work. • Performing the implantation of polymer into the matrix by solvent evaporation, and observing changes in structure of the material. Middleman, S., “Modeling Axisymmetric Flows: Dynamics of Films, Jets, and Drops,” Academic Press, San Diego, 1995. Denesuk,M., Smith G.L., Zelinski, B.J.J., Kreidl, N.J., and Uhlmann, D.R., J. Colloid Interface Sci. 124, 301 (1993). Davies, C. N., 1952. The separation of airborne dust and particles. Proceedings of Institute of Mechanical Engineers B1, London, 185-213. parameter symbol value error Porosity 0.8 3 % In-plane permeability k 8.4 E -11 m2 23% Transplanar permeability kt 2.85 E -11 m2 3% Capillary radius Rc 199 µm 4% Mean fiber radius r 7.7 µm 3% Contact angle 37° 4% parameter symbol value error density 1.097 g/mL 0.6 % Surface tension 31.5 mN/m 1.6% Dynamic viscosity 52.4 cP 1.3% 0 5 10 15 20 25 30 35 40 0 5 10 15 20 25 30 35 Frequency Fiber diameter (microns) Fiber Size distribution The fiber size distribution is clearly bimodal. However, for the purpose of using the Davies model, the mean radius is taken as if it was a monomodal distribution. • The alternative form the of Middleman-Denesuk equation greatly overpredicts the absorption time. • This equation uses the measured in-plane permeability, but the area of the drop base is assumed to be equal to the equatorial cross-section of the drop sphere prior to contact. • This is not true in our case: the experimentally measured maximum base area is much greater than the theoretical cross-section so the total absorption time is more than an order of magnitude smaller than predicted by Middleman-Denesuk. • An equation derived from Darcy’s Law uses measured permeability and measured area: • When trans-planar permeability is used, both Eqn. 1 equation and Eqn. 2 become further off from experimental results. This is possibly because the trans- planar permeability was not actually measured: it was estimated from a model which may not be fully applicable to this material. • The thickness (called “height” in table above) of the liquid-saturated layer inside the material (once absorption is complete) was also calculated. Since the entire material is only 1 mm thick, realistic values (equal to or less than 1 mm) were obtained using the measured area, not the theoretical area. Eqn. 1 Eqn. 2 Conclusions Total Absorption Time: In-plane permeability Transplanar permeability was estimated using the Davies empirical correlation of dimensionless permeability to the porosity in layered fibrous structures. The mean fiber radius was used. Here, refers to the solid volume fraction. Maximum height (hmax) attained by liquid: Properties of the material Selected frames from a video of a 10.2 microliter droplet as it absorbs into the fibrous material: 0 5 10 15 20 25 0 5 10 15 20 25 30 Height(mm) PDMS - Height vs 0 5 10 15 20 25 0 20 40 60 80 100 Height(mm) 70/30 solution: Height vs Slope obtained form fitting linear function is used to solve for k: Slope = 1.80 Slope = 0.92 Characterization of the porous material: Comparison of calculations in Eqns. 1 and 2: Eqn. 2 uses more experimentally measured parameters, yielding more accurate total absorption times. Capillary Rise experiments done with two liquids: PDMS (totally wetting) to determine capillary radius and the solution, to determine its internal contact angle with the material. In-plane permeability is calculated from both experiments. 0 2 4 6 8 10 12 0 5 10 15 20 25 Absorptiontime(seconds) Drop Volume (µL) Experimental Time Equation 2 Eqution 1 0 0.5 1 1.5 2 2.5 3 3.5 4 4.5 5 0 0.2 0.4 0.6 0.8 1 1.2 1.4 1.6 1.8 2 MinorAxis(mm) Time from contact (sec) Evolution of Drop Base Area 5.9 µL 10.2 µL 19.3 µL A comparison of two models to experimental results. The Darcy Law – derived model gives good agreement. Both models assume Constant Contact Area and in-plane permeability is used. Stage I Spreading Stage II Constant Area Stage III Receding Contact Area Drop base behavior: Results 0.055 0.165 0.770 1.0450.688 1.375 0.275 0.385 0.495 0.935 1 mm