Consumer barometer uk_infographic_2015
•
1 like•112 views

Know your local customers behavior in UK

Recommended
Recommended
More Related Content
What's hot
What's hot (20)
Viewers also liked
Viewers also liked (10)
Similar to Consumer barometer uk_infographic_2015
Similar to Consumer barometer uk_infographic_2015 (20)
More from Marco Ma
More from Marco Ma (8)
Recently uploaded
Recently uploaded (20)
Consumer barometer uk_infographic_2015
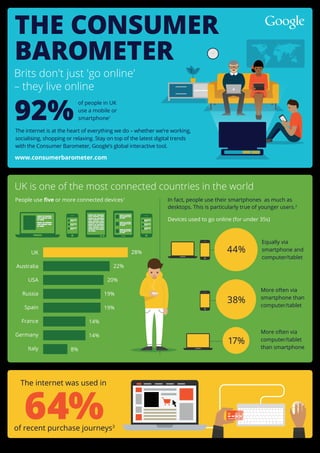
- 1. THE CONSUMER BAROMETER The internet is at the heart of everything we do – whether we’re working, socialising, shopping or relaxing. Stay on top of the latest digital trends with the Consumer Barometer, Google’s global interactive tool. People use five or more connected devices1 In fact, people use their smartphones as much as desktops. This is particularly true of younger users.2 Equally via smartphone and computer/tablet More often via smartphone than computer/tablet More often via computer/tablet than smartphone Devices used to go online (for under 35s) www.consumerbarometer.com 92% of people in UK use a mobile or smartphone1 Brits don't just 'go online' – they live online UK is one of the most connected countries in the world 44% 38% 17% 22% 20% 19% 19% 14% 14% 8% 28%UK Australia USA Russia Spain France Germany Italy 64%of recent purchase journeys3 The internet was used in
- 2. It also means that people can watch online video in or out-of-home.9 90% In-home 31% Out-of-home Are you giving local shoppers what they need? 38% of British consumers use a smartphone to find local information. Is your site optimised for mobile?4 42% of global consumers say that translation is a hurdle when buying online from foreign countries. Are you doing everything you can to attract and accommodate foreign customers?11 Are you thinking internationally? 64% of UK internet users watch online videos at least weekly – rising to 89% among under 35s. Are you present when your customers are watching?2 Are you taking the opportunity to connect with a highly engaged audience? People watch online videos once a week or more on a: 41% Computer8 42% Tablet7 52% Smartphone6 Are you winning the moments that matter? Now the Brits are more connected, they're more reliant on the internet to shop 'Living online' has also changed viewing behaviour in the UK Sources About The Consumer Barometer is a free, online global consumer insights tool developed by Google, in partnership with TNS Infratest. It covers 56 countries globally. Discover more insights and build your own charts at www.consumerbarometer.com Which information did people look for? This helps to inform their decisions when they shop locally.4 Prices Promotions, deals, coupons etc Location of business 23% 26% 49% Why do people purchase online from foreign countries? And when they shop internationally.5 Better availability Appealing offer Better conditions 40% 26% 16% They are highly focused on the videos, regardless of the device they are using.10 I was fully or mainly focused on the videos I watched this week. Computer 69% Smartphone 67% Tablet 67% All data is from Google Consumer Barometer, 2014/2015. Visit www.consumerbarometer.com 1. Base: Total online and offline population 2. Base: Internet users (accessing via computer, tablet or smartphone) 3. Base: Internet users (accessing via computer, tablet or smartphone) | Answering based on a recent purchase (in select categories) 4. Base: Internet users (accessing via computer, tablet or smartphone) | Searched for information about local business(es) in the past month 5. Base: Internet users (accessing via computer, tablet or smartphone) | Ever purchased a product / service online from abroad 6. Base: Internet users (accessing via smartphone) 7. Base: Internet users (accessing via tablet) 8. Base: Internet users (accessing via computer) 9. Base: Internet users (accessing via computer, tablet or smartphone) | Watched online video in the past week 10. Base: Internet users (accessing via computer, tablet or smartphone) | Watched online video in the past week | Answering based on a recent online video session 11. Base: Internet users (accessing via computer, tablet or smartphone). Numbers correct at 26 May 2015, all countries included, except UAE and Saudi Arabia.