More Related Content Similar to Financial Forecast Similar to Financial Forecast (20) More from Marc Tejeda (6) 1. Net Income indicator 372,315
Cash Flow indicator
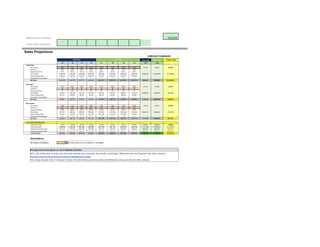
Year One Year Two 2-Year Total
Q1 Q2 Q3 Q4 Q1 Q2 Q3 Q4 Total Total 1 2 3 4 5 6 7 8
slope
Unit Volume 6300 8000 9000 12000 12500 13500 14000 14000 35,300 54,000 89,300 $668 $8,000 $9,000 $12,000 $12,500 $13,500 $14,000 $14,000 13332 7 1,904.57
Unit Price $20 $20 $20 $20 $20 $20 $20 $20 - - Q2 vs. Q1 Q3 vs. Q2 Q4 vs. Q3 Q1 vs. Q4 Q2 vs. Q1 Q3 vs. Q2 Q4 vs. Q3
Cost per Unit Sold $0.03 $0.03 $0.03 $0.03 $0.03 $0.03 $0.03 $0.03 - - 27% 13% 33% 4% 8% 4% 0%
Gross Sales $126,000 $160,000 $180,000 $240,000 $250,000 $270,000 $280,000 $280,000 $706,000 $1,080,000 $1,786,000 LINEST SLOPE L/S
(Cost of Goods Sold) $189.00 $240.00 $270.00 $360.00 $375.00 $405.00 $420.00 $420.00 Sales growing over time? 1 1634.81 1,905 1
(Commission Percentage) 15% 15% 15% 15% 15% 15% 15% 15% - - 122% overall rate
Net Sales $106,939 $135,796 $152,771 $203,694 $212,181 $229,156 $237,643 $237,643 $599,200 $916,623 $1,515,823 points for this dynamic (allocation) 25%
your growth points 25%
Unit Volume 4410 5600 6300 8400 8750 9450 9800 9800 24,710 37,800 62,510 Perfectly Exponential L/S = 2
Unit Price $3 $5 $7 $9 $9 $8 $9 $8 - Perfectly Linear L/S = 1
Cost per Unit Sold $1 $1 $1 $1 $1 $1 $1 $1 - This Forecast L/S = 0.86
Gross Sales $13,230 $28,000 $44,100 $75,600 $78,750 $75,600 $88,200 $78,400 $160,930 $320,950 $481,880 As a proportion out of 100% 43%
(Cost of Goods Sold) $4,410 $5,600 $6,300 $8,400 $8,750 $9,450 $9,800 $9,800 points for this dynamic (allocation) 75%
(Commission Percentage) 0% 0% 0% 0% 0% 0% 0% 0% - - - your growth points 32%
Net Sales $8,820 $22,400 $37,800 $67,200 $70,000 $66,150 $78,400 $68,600 $136,220 $283,150 $419,370
YOUR TOTAL POINTS % 57%
Total Points Possible 20
Unit Volume 1890 2400 2700 3600 3750 4050 4200 4200 10,590 16,200 26,790 Your Total Points 11
Unit Price $25 $25 $25 $25 $30 $30 $30 $30 - - -
Cost per Unit Sold $3.25 $3.25 $3.25 $3.25 $3.25 $3.25 $3.25 $3.25 - - -
Gross Sales $47,250 $60,000 $67,500 $90,000 $112,500 $121,500 $126,000 $126,000 $264,750 $486,000 $750,750
(Cost of Goods Sold) $6,143 $7,800 $8,775 $11,700 $12,188 $13,163 $13,650 $13,650
(Commission Percentage) 50% 50% 50% 50% 50% 50% 50% 50% - - -
Net Sales $20,554 $26,100 $29,363 $39,150 $50,156 $54,169 $56,175 $56,175 $115,166 $216,675 $331,841
Total Unit Volume 12,600 16,000 18,000 24,000 25,000 27,000 28,000 28,000 70,600 108,000 178,600
Total Gross Sales $186,480 $248,000 $291,600 $405,600 $441,250 $467,100 $494,200 $484,400 $1,131,680 $1,886,950 $3,018,630
(Total Cost of Goods Sold) $10,742 $13,640 $15,345 $20,460 $21,313 $23,018 $23,870 $23,870 $60,187 $92,070 $152,257
(Total Commissions Paid) $39,425 $50,064 $56,322 $75,096 $87,600 $94,608 $98,112 $98,112 $220,907 $378,432 $599,339
Total Net Sales $136,313 $184,296 $219,933 $310,044 $332,338 $349,475 $372,218 $362,418 $850,586 $1,416,448 $2,267,034
Assumptions:
Merchanside (locked) 30% of ticket buyers buy merchandise
Beverages (changeable) 70% of ticket buyers buy an average of 1 beverages
Beverage Industry Average for U.S. Bar & Nightclub (estimate)
65% order drinks most to all the time with males ordering more frequently than females. Surprisingly, Millennials order less frequently than older consumers
http://www.nciaa.com/content.aspx?page_id=22&club_id=160641&module_id=29898
The average consumer order 2.3 drinks per occasion with males ordering more than females and Millennials ordering more than the older consumers.
Year One Year TwoYear Two
Total: All Products/Services
Sales Projections
Year One
Ticket Sales
Beverages
Merchandise
FORECAST SUMMARY
2. Q1 Q2 Q3
Brochures, flyers, Mobile signs, bus/metro signs, billboards
Samples, premiums, logo merchandise, "swag"
Print: newspaper, magazines
Television, radio
Television, radio
Banner Ads, Paid Search Engine Marketing
Paid Facebook promotions, Twitter ads, Linkedin ads
Social media contests, Deal-of-the-day: Groupon, Google Offers, LivingSocial $300 $300 $300
Tweetups, Meetups $300 $400
Sticker bombing, flyposting, Flashmobs, streetart
Street teams, campus promotions, Crowd-sourced ads
Marketing Budget
Purpose
(optonal)
Tangible Marketing
Media Advertising
Social Media Marketing
Guerilla & Viral Marketing
Networking & Client Development Activities
Purpose/Strategy Key: (Optional)
PB: Personal Branding
BA: Brand Awareness/Brand Building
SP: Product/Service Sampling, Trial
L&R: Brand Loyalty/Customer Rewards
Pre-Launch
Year One
3. Launch party, Memberships, meetings, Entertaining Clients
Wrapped vehicles, food trucks, booths, exhibits, signs PB/BA $10,000 $500 $500
Design, development, programming $1,000 $500 $500 $500
Maintenance, hosting, domains 500 500 600 500
Marketing, Public Relations 2000 1500 1500 2000
Branding, Advertising $500 $600 $250 $400
$14,000 $4,200 $3,150 $4,600
Trade Shows, Events, Street Promotions
Website
Professional Assistance & Consultants
TOTAL
4. Q4 Q1 Q2 Q3 Q4
$300 $300 $300 $300 $300 $2,400
$300 $400 $1,400
Year Two
Total
One
5. $500 $500 $12,000
$500 $500 $500 $500 $500 $5,000
600 500 500 600 500 $4,800
1500 1500 1500 1500 1500 $14,500
$250 $300 $500 $50 $2,850
$2,900 $3,850 $3,100 $4,300 $2,850 $42,950
6. Pre-Launch Year 1 Year 2
$14,984 $1,500 $1,500
$30,000 $2,000 $5,500
$100,000 $6,000 $24,500
$5,000 $975 $1,075
$10,000 $1,225 $1,225
$5,000 $4,000 $8,800
$164,984 $15,700 $42,600
Company Vehicles
Research and Development Costs
TOTAL
Capital Expenses
Capital Expenses
Office Equipment, Furniture, and Supplies
Remodeling Needs
Industry Specific Supplies and Technical
Equipment
Licensing Needs (liquor license etc)
7. 2Live Venue
Pre-Launch Q1 Q2 Q3 Q4
$0 $136,313 $184,296 $219,933 $310,044
Capital expenses $164,984 $15,700 $0 $0 $0
Salaries and wages $84,067 $126,100 $126,100 $126,100 $126,100
Employee benefits $0 $0 $0 $0
Payroll taxes $12,610 $18,915 $18,915 $18,915 $18,915
Accounting Services $1,025 $1,025 $1,025 $1,025
Rent $8,000 $8,000 $8,000 $8,000
Maintenance $1,000 $1,000 $1,000 $1,000
Legal $9,000 $375 $375 $375 $375
Insurance $1,217 $1,825 $1,825 $1,825 $1,825
Utilities $1,000 $1,500 $1,700 $1,800 $1,500
Internet & public wifi $1,995 $175 $175 $175 $175
Telephone service $75 $75 $75 $75 $75
Filing fees $450
Postage and shipping $250
Marketing $14,000 $4,200 $3,150 $4,600 $2,900
Travel $2,500 $2,500 $2,500 $2,500 $2,500
Entertainment $3,500 $1,500 $1,500 $1,500 $1,500
Bank Fees $0
$295,647 $182,890 $166,340 $167,890 $165,890
Operating Profit (295,647) (46,577) 17,956 52,043 144,154
Provision for taxes 0 0 988 2,862 7,928
Income Statement
Year 1
INCOME (NET SALES)
EXPENSES
TOTAL EXPENSES
9. Year One Year Two
Quarter 1 Quarter 2 Quarter 3 Quarter 4 Y1 Total Y2 Total 2-Year Total
$332,338 $349,475 $372,218 $362,418 $850,586 $1,416,448 $2,267,034
$42,600 $0 $0 $0 $0 $42,600 $42,600
$157,625 $157,625 $157,625 $157,625 $504,400 $630,500 $1,134,900
$0 $0 $0 $0 $0 $0 $0
$23,644 $23,644 $23,644 $23,644 $75,660 $94,575 $170,235
$1,025 $1,025 $1,025 $1,025 $4,100 $4,100 $8,200
$8,000 $8,000 $8,000 $8,000 $32,000 $32,000 $64,000
$1,000 $1,000 $1,000 $1,000 $4,000 $4,000 $8,000
$375 $375 $375 $375 $1,500 $1,500 $3,000
$1,825 $1,825 $1,825 $1,825 $7,300 $7,300 $14,600
$1,500 $1,700 $1,800 $1,500 $6,500 $6,500 $13,000
$175 $175 $175 $175 $700 $700 $1,400
$75 $75 $75 $75 $300 $300 $600
$0 $0 $0
$0 $0 $0
$3,850 $3,100 $4,300 $2,850 $14,850 $14,100 $28,950
$10,000 $10,000 $10,000 $300 $10,000 $30,300 $40,300
$1,500 $1,500 $1,500 $1,500 $6,000 $6,000 $12,000
$0 $0 $0
$0 $0 $0
$0 $0 $0
$253,194 $210,044 $211,344 $199,894 $667,310 $831,875 $1,499,185
79,144 139,431 160,874 162,524 167,576 541,973 $709,549
4,353 7,669 8,848 8,939 9,217 29,809 $39,025
Year Two
FORECAST SUMMARY
11. Pre-Launch Q1 Q2 Q3 Q4
Starting Balance $0 $64,353 $17,883 $33,817 $82,365
Cash Ins
Net sales $136,313 $184,296 $219,933 $310,044
Investments $100,000
Loans
Interest income $107 $30 $56 $137
Owner contributions $400,000
TOTAL CASH INS $500,000 $136,420 $184,326 $219,989 $310,181
Cash Outs
Operating expenses $295,647 $182,890 $166,340 $167,890 $165,890
Loan payments
Tax payments $0 $0 $2,052 $3,551 $3,315
Contingency fund $140,000
Owner's draw (Entrepreneur)
Investor's draw
Other:
Other:
Other:
Other:
Other:
Other:
TOTAL CASH OUTS $435,647 $182,890 $168,392 $171,441 $169,205
Year 1
Cash Flow
12. CASH AT END OF MONTH 64,353 17,883 33,817 82,365 223,341
13. Q1 Q2 Q3 Q4
$223,341 $300,747 $385,268 $540,491
$332,338 $349,475 $372,218 $362,418
$372 $501 $642 $901
$332,710 $349,976 $372,860 $363,319
$253,194 $210,044 $211,344 $199,894
$2,110 $5,411 $6,293 $7,457
$50,000 $50,000
$255,304 $265,455 $217,637 $257,351
Year 2
15. Investment Amount ($) Equity Offered (%)
Private Investor $100,000 10%
Contribution Amount ($) Equity Retained (%)
Owner $400,000 90%
Total Capital Raised EQUITY OWNERSHIP
%
$100,000 10%
$400,000 90%
$500,000 100%
Outside Investors
Owners
TOTAL
Capital Investment
aka "Shark Tank" Page
Investor Name
Owner Name
TOTAL INVESTMENTS
The Total Investment Amount (Capital) should be
theamount of thelargest negative number on
your Cash Flow Statement (theamount of cash
you need to eliminateany and all negative cash
balances throughout thetwo years whileyour
business is breaking even.
16. Are you raising capital from an investor? If so, enter theamount you'll
need from them here. Then enter thepercentage of your company
If you chooseto raise smaller amounts of capital with crowdfunding
donations, remember that the$ is donated and no equity % is given
away.
START HERE and decide how much ofthe total will come from your
own money. This sends a positivepsychological signal to investors
that you believe in your idea. In addition, thesesharks assume that
themore money you invested, the harder you will work to makethe
business a success.
COME BACK LATER and enter theamount ofequity you own, after
you've decided how much equity you'll begiving up to an investor.