SlideShare uma empresa Scribd logo
1 de 1
Baixar para ler offline
Digital Media.
All four markets index high
forhousehold incomes over
$250,000 peryear.
AFFLUENCE
All four markets have high numbers
of adults who have a college degree or
higher, compared to the U.S. overall (26%).
EDUCATION
40+39+35+2939%40% 35% 29%
All four markets have high levels of
white-collaremploymentcompared
to all U.S. adults (38%).
49+47+46+4147%49% 46% 41%
EMPLOYMENT
GENERATION
Allfourmarketshavehighnumbers
of Generation X-ers compared to
the U.S. overall (27%).
31+30+30+2930%31% 30% 29%
CHILDREN
Threeofthemarketsrankhighfor
having children age 17 and under
livingintheirhouseholdcompared
to the U.S. overall (39%).
45+41+41+3841%45% 41% 38%
What qualities
do theyshare
that keep them in
the top ten markets
across the board?
������������������������������������������������SAN FRANCISCO, CA
WASHINGTON, DC
AUSTIN, TX
BALTIMORE, MD
SALT LAKE CITY, UT
COLORADO SPRINGS, CO
DALLAS, TX
ATLANTA, GA
COLUMBUS, OH
NORFOLK, VA
SEATTLE, WA
KANSAS CITY, MO
PORTLAND, OR
2 0 0 9 2 0 1 2
22%
21% 59%
21% 62%
21% 59%
20% 61%
20%
20% 61%
20% 60%
20% 60%
19%
62%
61%
60%
U S E D T H E I N T E R N E T I N P A S T 3 0 D AY S F O R
Social Networking
Source: Scarborough USA+
Study, Release 2, 2009, 2012.
© 2013 Scarborough.
Top 10 Local Markets
in 2009v. 2012
2012
2009
I N T H E P A S T 3 0 D AY S
Accessed Internet
2012
2002
WASHINGTON, DC
BOSTON, MA
AUSTIN, TX
SALT LAKE CITY, UT
SAN FRANCISCO, CA
MINNEAPOLIS, MN
HONOLULU, HI
SACRAMENTO, CA
ALBANY, NY
NEW YORK, NY
NEW ORLEANS, LA
SYRACUSE, NY
2 0 0 2 2 0 1 2
U S E D T H E I N T E R N E T I N P A S T 3 0 D AY S F O R
NewspaperWebsite
Source: Scarborough USA+ Study, Release 2, 2002, 2012.
© 2013 Scarborough.
29% 36%
24% 39%
23% 31%
22%
21% 33%
21%
20%
20%
20%
32%
40%
34%
19%
HARRISBURG, PA
PHILADELPHIA, PA
WEST PALM BEACH, FL
32%
31%
31%
������������������������������������������������������������
ATLANTA, GA
LAS VEGAS, NV
WASHINGTON, DC
MIAMI, FL
LOS ANGELES, CA
HONOLULU, HI
SACRAMENTO, CA
NEW YORK, NY
MEMPHIS, TN
AUSTIN, TX
DALLAS, TX
2 0 0 7 2 0 1 2
U S E D T H E I N T E R N E T I N P A S T 3 0 D AY S O N A
Smartphone
Source: Scarborough USA+
Study, Release 2, 2007, 2012 .
© 2013 Scarborough.
37% 52%
36%
36% 52%
34% 52%
34%
35%
33%
33%
50%
57%
56%
33%
HOUSTON, TX
KANSAS CITY, MO
SAN FRANCISCO, CA
53%
52%
50%
DENVER, CO 50%
2007 2012
SAN FRANCISCO, CA
AUSTIN, TX
WASHINGTON, DC
HOUSTON, TX
RICHMOND, VA
DALLAS, TX
MEMPHIS, TN
SACRAMENTO, CA
RALEIGH, NC
HARTFORD, CT
2 0 0 2 2 0 1 2
U S E D T H E I N T E R N E T I N P A S T 3 0 D AY S T O
Listento Radio
Source: Scarborough USA+ Study, Release 2, 2002, 2012.
© 2013 Scarborough.
11% 26%
10% 32%
10% 25%
9%
9%
9%
9%
9%
ATLANTA, GA 28%9%
27%
26%
DENVER, CO
SAN ANTONIO, TX
COLUMBUS, OH
26%
26%
25%
SEATTLE, WA 25%
2002
2012
2002 2012
A S C A R B O R O U G H I N F O G R A P H I C
FOLLOW US ON &
Telling the local story.
How can you tell the local story of how online media consumption has evolved over
the past few years? Local market consumer insights firm Scarborough illustrates how
identifying the top local markets in key areas of online media use can help paint a picture of
national trends. But what happens when an intriguing pattern emerges? How can marketers
narrow their focus, using layers of data to reach audiences and consumers more efficiently?
These four markets are almost always in the top ten
for every online media activity in every year measured.
But that isn’t the whole story.
I N D E X
285
I N D E X
297
I N D E X
126
I N D E X
113
Washington, DC
Atlanta, GA
San Francisco, CA
Austin, TX
Source: Scarborough USA+
Study, Release 2, 2002, 2012.
© 2013 Scarborough.
San Francisco, CA
adults are nearly
three times more
likely than all U.S.
adults to have an
annual household
income of $250K.
In 2002, Portland, OR
was not a Top 10 Market
for internet access.
In 2012, Boston, MA
was not a Top 10 Market
for internet access.
Did you see that?
What’s up with Atlanta, Austin,
San Francisco, and Washington, DC?
Every market has its own local flavor that influences the motivations behind
their behavior. Austin, Atlanta, San Francisco and Washington, DC share some
qualities, but the reasons behind their actions are complex and diverse.
Top 10 Local Markets
in 2002v. 2012
Top 10 Local Markets
in 2007v. 2012
Top 10 Local Markets
in 2002v. 2012
67%
AUSTIN, TX
WASHINGTON, DC
SEATTLE, WA
SAN FRANCISCO, CA
DENVER, CO
SALT LAKE CITY, UT
BOSTON, MA
SAN DIEGO, CA
ATLANTA, GA
MINNEAPOLIS, MN
COLORADO SPRINGS, CO
PORTLAND, OR
2 0 0 2 2 0 1 2
69% 85%
69% 85%
68% 86%
66% 84%
86%64%
64%
64% 83%
64% 83%
64% 85%
83%
83%
Top 10 Local Markets
in 2002v. 2012
Atlanta adults are
56%more likely
to live in a
household that plans
to buy a smartphone
in the next year.
Austin
adults are 39%more likely to think
social networking is
very important for
playing games.
Austin
adults are 31%more likely to own
a smartphone.
Austin wireless adults are 51%more likely to use a wireless phone for
online banking than all wireless adults.
They’re also
more likely 67%to visit LinkedIn, and
24%more likely
to think
social media is very
important for meeting
or networking with
professional contacts.
Washington, DC
adults are
40%more likely
to have clicked on
a social media
advertisement in the
last 30 days.
For purchase information for
this, or any other consumer
topics, please contact:
Scarborough
Haley Dercher • 646.517.1042
hdercher@scarborough.com
dialog.scarborough.com
FOLLOW US ON &
Atlanta adults are 25%more likely to agree that
they feel really good about
seeing celebrities in the
media that share their
ethnic background.
Washington, DC
adults are
27%more likely
to agree completely
that they often find
themselves in a
leadership position.
They’re also
more likely 23%to agree completely
that their goal is to
make it to the top of
their profession.
San Francisco adults are
48%more likely to
have graduated
college, and are
more likely to
have post-graduate
education.
68%
They’re also 11%more likely to agree that
they strive to achieve
high social status, and
more likely
to agree
completely that they
consider themselves
sophisticated.
30%
Austin
adults are 11%more likely to agree
that they like to
live a lifestyle that
impresses others.
Austin
adults are 38%more likely to disagree
completely that they
consider themselves
to be sociable.
Atlanta adults are
16%more likely
to have
children under the
age of 17 living in
their home.
They’re also 20%
more likely to agree
that they are more
connected to their
ethnic heritage than
their parents are.
Washington, DC
wireless/cell phone
owners are
20%more likely
to check for news,
weather, or traffic than
all wireless/cell phone
owners.
San Francisco
adults are
39%more likely
to plan to buy a tablet in
the next year, and
more likely to plan
to buy a smartphone.
27%
SALT LAKE CITY, UT 33%
NEW YORK, NY 8%

Mais conteúdo relacionado

Semelhante a Affluent Educated Professionals Fuel Top Online Markets

2020 Regional Snapshot: 100 Metros Dashboard
2020 Regional Snapshot: 100 Metros Dashboard 2020 Regional Snapshot: 100 Metros Dashboard
2020 Regional Snapshot: 100 Metros Dashboard ARCResearch
 
Use of new media technologies part 1
Use of new media technologies part 1Use of new media technologies part 1
Use of new media technologies part 1drj4teenhealth
 
Marketing to millennials statistics and trends
Marketing to millennials   statistics and trendsMarketing to millennials   statistics and trends
Marketing to millennials statistics and trendsRepublic_Media
 
Gen Y Financial Services Presentation
Gen Y Financial Services PresentationGen Y Financial Services Presentation
Gen Y Financial Services Presentationbrass Media nc.
 
Social Desirability Effects in Market Research Effectiveness
Social Desirability Effects in Market Research EffectivenessSocial Desirability Effects in Market Research Effectiveness
Social Desirability Effects in Market Research EffectivenessBlaire Clause
 
Social Desirability Effects in Market Research Effectiveness
Social Desirability Effects in Market Research EffectivenessSocial Desirability Effects in Market Research Effectiveness
Social Desirability Effects in Market Research EffectivenessW2O Group
 
FEED: The 2009 Razorfish Digital Brand Experience Report
FEED: The 2009 Razorfish Digital Brand Experience ReportFEED: The 2009 Razorfish Digital Brand Experience Report
FEED: The 2009 Razorfish Digital Brand Experience ReportIN2marcom .com
 
Feed09single 091109130925 Phpapp02
Feed09single 091109130925 Phpapp02Feed09single 091109130925 Phpapp02
Feed09single 091109130925 Phpapp02Jing Wen
 
Razorfish Digital Brand Experience Report 2009
Razorfish Digital Brand Experience Report 2009Razorfish Digital Brand Experience Report 2009
Razorfish Digital Brand Experience Report 2009Matthew Pantoja
 
25 key trends for economic development and talent attraction
25 key trends for economic development and talent attraction25 key trends for economic development and talent attraction
25 key trends for economic development and talent attractionMatt Carmichael
 
The Future of Digital Experience
The Future of Digital Experience The Future of Digital Experience
The Future of Digital Experience Mercedes Cardona
 
Cortright Akron Jan2010
Cortright Akron Jan2010Cortright Akron Jan2010
Cortright Akron Jan2010guest4b8d4d
 
Cortright Akron Jan2010
Cortright Akron Jan2010Cortright Akron Jan2010
Cortright Akron Jan2010guest4b8d4d
 
Cortright Akron Jan2010
Cortright Akron Jan2010Cortright Akron Jan2010
Cortright Akron Jan2010guest4b8d4d
 
Investing in Place
Investing in PlaceInvesting in Place
Investing in PlaceAPA_Planning
 

Semelhante a Affluent Educated Professionals Fuel Top Online Markets (20)

Social media infographic
Social media infographicSocial media infographic
Social media infographic
 
2020 Regional Snapshot: 100 Metros Dashboard
2020 Regional Snapshot: 100 Metros Dashboard 2020 Regional Snapshot: 100 Metros Dashboard
2020 Regional Snapshot: 100 Metros Dashboard
 
Use of new media technologies part 1
Use of new media technologies part 1Use of new media technologies part 1
Use of new media technologies part 1
 
Marketing to millennials statistics and trends
Marketing to millennials   statistics and trendsMarketing to millennials   statistics and trends
Marketing to millennials statistics and trends
 
Gen Y Financial Services Presentation
Gen Y Financial Services PresentationGen Y Financial Services Presentation
Gen Y Financial Services Presentation
 
Social Desirability Effects in Market Research Effectiveness
Social Desirability Effects in Market Research EffectivenessSocial Desirability Effects in Market Research Effectiveness
Social Desirability Effects in Market Research Effectiveness
 
Social Desirability Effects in Market Research Effectiveness
Social Desirability Effects in Market Research EffectivenessSocial Desirability Effects in Market Research Effectiveness
Social Desirability Effects in Market Research Effectiveness
 
Gen Z Explorer 2019
Gen Z Explorer 2019Gen Z Explorer 2019
Gen Z Explorer 2019
 
FEED: The 2009 Razorfish Digital Brand Experience Report
FEED: The 2009 Razorfish Digital Brand Experience ReportFEED: The 2009 Razorfish Digital Brand Experience Report
FEED: The 2009 Razorfish Digital Brand Experience Report
 
Feed09single 091109130925 Phpapp02
Feed09single 091109130925 Phpapp02Feed09single 091109130925 Phpapp02
Feed09single 091109130925 Phpapp02
 
Razorfish Digital Brand Experience Report 2009
Razorfish Digital Brand Experience Report 2009Razorfish Digital Brand Experience Report 2009
Razorfish Digital Brand Experience Report 2009
 
25 key trends for economic development and talent attraction
25 key trends for economic development and talent attraction25 key trends for economic development and talent attraction
25 key trends for economic development and talent attraction
 
The Mobile Difference
The Mobile DifferenceThe Mobile Difference
The Mobile Difference
 
The Future of Digital Experience
The Future of Digital Experience The Future of Digital Experience
The Future of Digital Experience
 
Cortright Akron Jan2010
Cortright Akron Jan2010Cortright Akron Jan2010
Cortright Akron Jan2010
 
Cortright Akron Jan2010
Cortright Akron Jan2010Cortright Akron Jan2010
Cortright Akron Jan2010
 
Cortright Akron Jan2010
Cortright Akron Jan2010Cortright Akron Jan2010
Cortright Akron Jan2010
 
Investing in Place
Investing in PlaceInvesting in Place
Investing in Place
 
1-Face-PPT
1-Face-PPT1-Face-PPT
1-Face-PPT
 
The Metropolitan Revolution: Council on Virginia's Future
The Metropolitan Revolution: Council on Virginia's FutureThe Metropolitan Revolution: Council on Virginia's Future
The Metropolitan Revolution: Council on Virginia's Future
 

Mais de Jacqueline Polanco

ADV263: Product Launch + Client Presentation
ADV263: Product Launch + Client PresentationADV263: Product Launch + Client Presentation
ADV263: Product Launch + Client PresentationJacqueline Polanco
 
NewsCred + Getty Images present: The Power of Visual Storytelling
NewsCred + Getty Images present: The Power of Visual StorytellingNewsCred + Getty Images present: The Power of Visual Storytelling
NewsCred + Getty Images present: The Power of Visual StorytellingJacqueline Polanco
 
[Contently] Beginners guide to content strategy
[Contently] Beginners guide to content strategy[Contently] Beginners guide to content strategy
[Contently] Beginners guide to content strategyJacqueline Polanco
 
Hispanic Consumers infographic
Hispanic Consumers infographicHispanic Consumers infographic
Hispanic Consumers infographicJacqueline Polanco
 
Google Adwords: Upgrading to Enhanced Campaigns
Google Adwords: Upgrading to Enhanced CampaignsGoogle Adwords: Upgrading to Enhanced Campaigns
Google Adwords: Upgrading to Enhanced CampaignsJacqueline Polanco
 
The Whole Brain Group's Social Media Checklist
The Whole Brain Group's Social Media ChecklistThe Whole Brain Group's Social Media Checklist
The Whole Brain Group's Social Media ChecklistJacqueline Polanco
 
Hubspot's How to Enhance Your Internet Presence with Social Media
Hubspot's How to Enhance Your Internet Presence with Social MediaHubspot's How to Enhance Your Internet Presence with Social Media
Hubspot's How to Enhance Your Internet Presence with Social MediaJacqueline Polanco
 
ShortStack's The Ultimate Facebook Holiday Idea Book
ShortStack's The Ultimate Facebook Holiday Idea BookShortStack's The Ultimate Facebook Holiday Idea Book
ShortStack's The Ultimate Facebook Holiday Idea BookJacqueline Polanco
 
Hubspot's Marketing Benchmarks from 7000 Businesses
Hubspot's Marketing Benchmarks from 7000 BusinessesHubspot's Marketing Benchmarks from 7000 Businesses
Hubspot's Marketing Benchmarks from 7000 BusinessesJacqueline Polanco
 
The Whole Brain Group's What is Inbound Marketing?
The Whole Brain Group's What is Inbound Marketing?The Whole Brain Group's What is Inbound Marketing?
The Whole Brain Group's What is Inbound Marketing?Jacqueline Polanco
 
Google Display Network Playbook Fall 2012
Google Display Network Playbook Fall 2012Google Display Network Playbook Fall 2012
Google Display Network Playbook Fall 2012Jacqueline Polanco
 

Mais de Jacqueline Polanco (15)

JP Resume PM
JP Resume PMJP Resume PM
JP Resume PM
 
Jacqueline Polanco Cert[1]
Jacqueline Polanco Cert[1]Jacqueline Polanco Cert[1]
Jacqueline Polanco Cert[1]
 
ADV263: Product Launch + Client Presentation
ADV263: Product Launch + Client PresentationADV263: Product Launch + Client Presentation
ADV263: Product Launch + Client Presentation
 
NewsCred + Getty Images present: The Power of Visual Storytelling
NewsCred + Getty Images present: The Power of Visual StorytellingNewsCred + Getty Images present: The Power of Visual Storytelling
NewsCred + Getty Images present: The Power of Visual Storytelling
 
[Contently] Beginners guide to content strategy
[Contently] Beginners guide to content strategy[Contently] Beginners guide to content strategy
[Contently] Beginners guide to content strategy
 
Hispanic Consumers infographic
Hispanic Consumers infographicHispanic Consumers infographic
Hispanic Consumers infographic
 
Google Adwords: Upgrading to Enhanced Campaigns
Google Adwords: Upgrading to Enhanced CampaignsGoogle Adwords: Upgrading to Enhanced Campaigns
Google Adwords: Upgrading to Enhanced Campaigns
 
Outdoors
OutdoorsOutdoors
Outdoors
 
The Whole Brain Group's Social Media Checklist
The Whole Brain Group's Social Media ChecklistThe Whole Brain Group's Social Media Checklist
The Whole Brain Group's Social Media Checklist
 
Hubspot's How to Enhance Your Internet Presence with Social Media
Hubspot's How to Enhance Your Internet Presence with Social MediaHubspot's How to Enhance Your Internet Presence with Social Media
Hubspot's How to Enhance Your Internet Presence with Social Media
 
ShortStack's The Ultimate Facebook Holiday Idea Book
ShortStack's The Ultimate Facebook Holiday Idea BookShortStack's The Ultimate Facebook Holiday Idea Book
ShortStack's The Ultimate Facebook Holiday Idea Book
 
Hubspot's Marketing Benchmarks from 7000 Businesses
Hubspot's Marketing Benchmarks from 7000 BusinessesHubspot's Marketing Benchmarks from 7000 Businesses
Hubspot's Marketing Benchmarks from 7000 Businesses
 
The Whole Brain Group's What is Inbound Marketing?
The Whole Brain Group's What is Inbound Marketing?The Whole Brain Group's What is Inbound Marketing?
The Whole Brain Group's What is Inbound Marketing?
 
Google Tag Manager Factsheet
Google Tag Manager FactsheetGoogle Tag Manager Factsheet
Google Tag Manager Factsheet
 
Google Display Network Playbook Fall 2012
Google Display Network Playbook Fall 2012Google Display Network Playbook Fall 2012
Google Display Network Playbook Fall 2012
 

Affluent Educated Professionals Fuel Top Online Markets

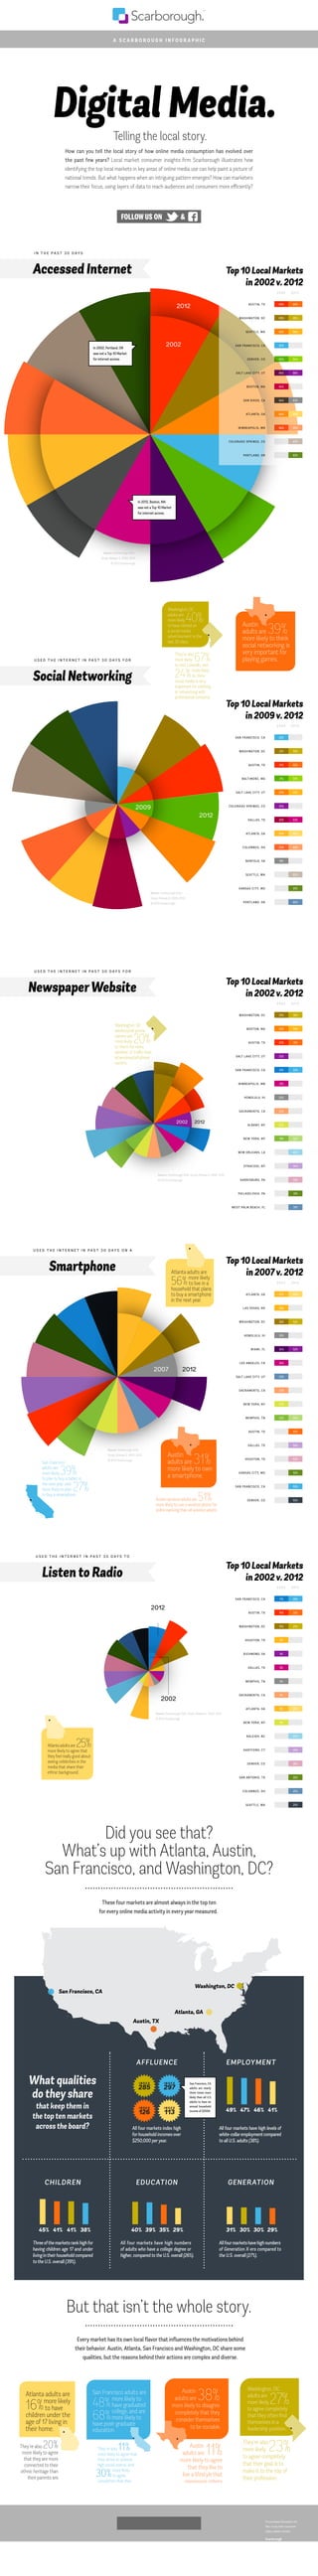
  • 1. Digital Media. All four markets index high forhousehold incomes over $250,000 peryear. AFFLUENCE All four markets have high numbers of adults who have a college degree or higher, compared to the U.S. overall (26%). EDUCATION 40+39+35+2939%40% 35% 29% All four markets have high levels of white-collaremploymentcompared to all U.S. adults (38%). 49+47+46+4147%49% 46% 41% EMPLOYMENT GENERATION Allfourmarketshavehighnumbers of Generation X-ers compared to the U.S. overall (27%). 31+30+30+2930%31% 30% 29% CHILDREN Threeofthemarketsrankhighfor having children age 17 and under livingintheirhouseholdcompared to the U.S. overall (39%). 45+41+41+3841%45% 41% 38% What qualities do theyshare that keep them in the top ten markets across the board? ������������������������������������������������SAN FRANCISCO, CA WASHINGTON, DC AUSTIN, TX BALTIMORE, MD SALT LAKE CITY, UT COLORADO SPRINGS, CO DALLAS, TX ATLANTA, GA COLUMBUS, OH NORFOLK, VA SEATTLE, WA KANSAS CITY, MO PORTLAND, OR 2 0 0 9 2 0 1 2 22% 21% 59% 21% 62% 21% 59% 20% 61% 20% 20% 61% 20% 60% 20% 60% 19% 62% 61% 60% U S E D T H E I N T E R N E T I N P A S T 3 0 D AY S F O R Social Networking Source: Scarborough USA+ Study, Release 2, 2009, 2012. © 2013 Scarborough. Top 10 Local Markets in 2009v. 2012 2012 2009 I N T H E P A S T 3 0 D AY S Accessed Internet 2012 2002 WASHINGTON, DC BOSTON, MA AUSTIN, TX SALT LAKE CITY, UT SAN FRANCISCO, CA MINNEAPOLIS, MN HONOLULU, HI SACRAMENTO, CA ALBANY, NY NEW YORK, NY NEW ORLEANS, LA SYRACUSE, NY 2 0 0 2 2 0 1 2 U S E D T H E I N T E R N E T I N P A S T 3 0 D AY S F O R NewspaperWebsite Source: Scarborough USA+ Study, Release 2, 2002, 2012. © 2013 Scarborough. 29% 36% 24% 39% 23% 31% 22% 21% 33% 21% 20% 20% 20% 32% 40% 34% 19% HARRISBURG, PA PHILADELPHIA, PA WEST PALM BEACH, FL 32% 31% 31% ������������������������������������������������������������ ATLANTA, GA LAS VEGAS, NV WASHINGTON, DC MIAMI, FL LOS ANGELES, CA HONOLULU, HI SACRAMENTO, CA NEW YORK, NY MEMPHIS, TN AUSTIN, TX DALLAS, TX 2 0 0 7 2 0 1 2 U S E D T H E I N T E R N E T I N P A S T 3 0 D AY S O N A Smartphone Source: Scarborough USA+ Study, Release 2, 2007, 2012 . © 2013 Scarborough. 37% 52% 36% 36% 52% 34% 52% 34% 35% 33% 33% 50% 57% 56% 33% HOUSTON, TX KANSAS CITY, MO SAN FRANCISCO, CA 53% 52% 50% DENVER, CO 50% 2007 2012 SAN FRANCISCO, CA AUSTIN, TX WASHINGTON, DC HOUSTON, TX RICHMOND, VA DALLAS, TX MEMPHIS, TN SACRAMENTO, CA RALEIGH, NC HARTFORD, CT 2 0 0 2 2 0 1 2 U S E D T H E I N T E R N E T I N P A S T 3 0 D AY S T O Listento Radio Source: Scarborough USA+ Study, Release 2, 2002, 2012. © 2013 Scarborough. 11% 26% 10% 32% 10% 25% 9% 9% 9% 9% 9% ATLANTA, GA 28%9% 27% 26% DENVER, CO SAN ANTONIO, TX COLUMBUS, OH 26% 26% 25% SEATTLE, WA 25% 2002 2012 2002 2012 A S C A R B O R O U G H I N F O G R A P H I C FOLLOW US ON & Telling the local story. How can you tell the local story of how online media consumption has evolved over the past few years? Local market consumer insights firm Scarborough illustrates how identifying the top local markets in key areas of online media use can help paint a picture of national trends. But what happens when an intriguing pattern emerges? How can marketers narrow their focus, using layers of data to reach audiences and consumers more efficiently? These four markets are almost always in the top ten for every online media activity in every year measured. But that isn’t the whole story. I N D E X 285 I N D E X 297 I N D E X 126 I N D E X 113 Washington, DC Atlanta, GA San Francisco, CA Austin, TX Source: Scarborough USA+ Study, Release 2, 2002, 2012. © 2013 Scarborough. San Francisco, CA adults are nearly three times more likely than all U.S. adults to have an annual household income of $250K. In 2002, Portland, OR was not a Top 10 Market for internet access. In 2012, Boston, MA was not a Top 10 Market for internet access. Did you see that? What’s up with Atlanta, Austin, San Francisco, and Washington, DC? Every market has its own local flavor that influences the motivations behind their behavior. Austin, Atlanta, San Francisco and Washington, DC share some qualities, but the reasons behind their actions are complex and diverse. Top 10 Local Markets in 2002v. 2012 Top 10 Local Markets in 2007v. 2012 Top 10 Local Markets in 2002v. 2012 67% AUSTIN, TX WASHINGTON, DC SEATTLE, WA SAN FRANCISCO, CA DENVER, CO SALT LAKE CITY, UT BOSTON, MA SAN DIEGO, CA ATLANTA, GA MINNEAPOLIS, MN COLORADO SPRINGS, CO PORTLAND, OR 2 0 0 2 2 0 1 2 69% 85% 69% 85% 68% 86% 66% 84% 86%64% 64% 64% 83% 64% 83% 64% 85% 83% 83% Top 10 Local Markets in 2002v. 2012 Atlanta adults are 56%more likely to live in a household that plans to buy a smartphone in the next year. Austin adults are 39%more likely to think social networking is very important for playing games. Austin adults are 31%more likely to own a smartphone. Austin wireless adults are 51%more likely to use a wireless phone for online banking than all wireless adults. They’re also more likely 67%to visit LinkedIn, and 24%more likely to think social media is very important for meeting or networking with professional contacts. Washington, DC adults are 40%more likely to have clicked on a social media advertisement in the last 30 days. For purchase information for this, or any other consumer topics, please contact: Scarborough Haley Dercher • 646.517.1042 hdercher@scarborough.com dialog.scarborough.com FOLLOW US ON & Atlanta adults are 25%more likely to agree that they feel really good about seeing celebrities in the media that share their ethnic background. Washington, DC adults are 27%more likely to agree completely that they often find themselves in a leadership position. They’re also more likely 23%to agree completely that their goal is to make it to the top of their profession. San Francisco adults are 48%more likely to have graduated college, and are more likely to have post-graduate education. 68% They’re also 11%more likely to agree that they strive to achieve high social status, and more likely to agree completely that they consider themselves sophisticated. 30% Austin adults are 11%more likely to agree that they like to live a lifestyle that impresses others. Austin adults are 38%more likely to disagree completely that they consider themselves to be sociable. Atlanta adults are 16%more likely to have children under the age of 17 living in their home. They’re also 20% more likely to agree that they are more connected to their ethnic heritage than their parents are. Washington, DC wireless/cell phone owners are 20%more likely to check for news, weather, or traffic than all wireless/cell phone owners. San Francisco adults are 39%more likely to plan to buy a tablet in the next year, and more likely to plan to buy a smartphone. 27% SALT LAKE CITY, UT 33% NEW YORK, NY 8%