Outlook for Week of July 26, 2021
•
0 likes•2,843 views

Free weekly newsletter with outlook and brief comments for world stock markets. Weekly reversal levels for stocks, gold, crypto currencies and forex. This method was designed to keep you on the right side of the market most of the time, letting the winners run while avoiding big losses.

Recommended
More Related Content
What's hot
What's hot (19)
Similar to Outlook for Week of July 26, 2021
Similar to Outlook for Week of July 26, 2021 (20)
More from LunaticTrader
More from LunaticTrader (20)
Recently uploaded
Recently uploaded (20)
Outlook for Week of July 26, 2021
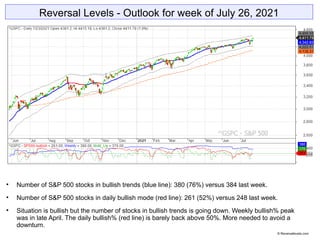
- 1. Reversal Levels - Outlook for week of July 26, 2021 Number of S&P 500 stocks in bullish trends (blue line): 380 (76%) versus 384 last week. Number of S&P 500 stocks in daily bullish mode (red line): 261 (52%) versus 248 last week. Situation is bullish but the number of stocks in bullish trends is going down. Weekly bullish% peak was in late April. The daily bullish% (red line) is barely back above 50%. More needed to avoid a downturn. © Reversallevels.com
- 2. ELC: up | BMO: up | Blue snake: up | Repellor: up. As long as all indicators point up it is best to keep trading with the trend, which is: UP. That being said, the market is bumping into long term overhead resistance again, so I would be cautious at this point. © Reversallevels.com S&P 500 Weekly chart
- 3. Partial profits signal for S&P 500 = a 38% gain in 59 weeks. May have peaked. Sell signal for Nikkei. Other major markets stay in weak bullish trends with downward MoM. Bonds TLT are in a young bullish trend and adding to gains. Gold is in a bearish trend and fighting to hold the $1800 level. Oil is weak bullish, may have peaked. EURUSD is in a bearish trend. © Reversallevels.com Major indices
- 4. Partial profits signals for Switzerland. A 15.7% gain in 36 weeks.. MoM has turned down for nearly all world markets. This suggests a significant pause or early stage bear market. South Korea KOSPI is our current best performer. It is up 60% since its Buy signal 60 weeks ago. World markets © Reversallevels.com
- 5. Buy signal for WMT. Partial profits signal for AXP. A 45% gain in 36 weeks. 23 stocks bullish,up from 22 last week. Above 20 = bull market. See: Keeping an eye on the Dow stocks Good week. One Buy and several stocks with MoM turning up. AAPL remains our best performer in this group. A 113% gain since its Buy signal 66 weeks ago and the move is ongoing. . 30 Dow Jones Industrials stocks © Reversallevels.com
- 6. Bullish divergence for $EURGBP. For daytraders or swing traders: if you do your trading in the direction of the weekly trend you are likely to do well in the long run. So, try to buy the pullbacks in currencies pairs that are in bullish trends and sell the rallies during bearish trends. Forex & Crypto © Reversallevels.com
- 7. On Twitter: http://twitter.com/lunatictrader1 On Stocktwits: http://stocktwits.com/LunaticTrader Website: Reversallevels.com For daily comments and questions you can find us here: © Reversallevels.com Disclaimer Investing in stocks, forex or commodities is risky. No guarantee can be given that the opinions or predictions given in this presentation will be correct. Reversallevels.com cannot in any way be responsible for eventual losses you may incur if you trade based on the given information. Simulated trading programs in general are subject to the fact that they are designed with the benefit of hindsight. No representation is being made that any account will or is likely to achieve profits or losses similar to those shown. Trade at your own risk and responsibility. Subscription service Daily reversal levels for over 3000 stocks and ETF are available by monthly subscription. Discover how you can become a more efficient investor: 1 Month ($22) 6 Months ($110) 1 Year ($199) Comes with full instructions and strategies for using the reversal levels and MoM indicator in your own trading. This is an honest method with limited risk, not a get rich quick formula. Give it a try.