Land Cover Classification Assessment Using Decision Trees and Maximum Likelihood Classification Algorithms on Landsat 8 Data
•
0 likes•9 views

This document summarizes a study that compares land cover classification using decision trees and maximum likelihood classification algorithms on Landsat 8 satellite imagery of Surabaya and Bangkalan areas in Indonesia. Regions of interest were created for four land cover classes: vegetation, buildings, sea, and mixed. The decision trees method produced classification rules based on pixel values in red, green, and blue bands. Both methods achieved over 90% accuracy based on a confusion matrix. While results were similar, decision trees produced classifications closer to actual land cover conditions. The study was limited by using manual interpretation for validation; future work could incorporate larger validation datasets.

Recommended
Recommended
More Related Content
Similar to Land Cover Classification Assessment Using Decision Trees and Maximum Likelihood Classification Algorithms on Landsat 8 Data
Similar to Land Cover Classification Assessment Using Decision Trees and Maximum Likelihood Classification Algorithms on Landsat 8 Data (20)
More from Luhur Moekti Prayogo
More from Luhur Moekti Prayogo (20)
Recently uploaded
Recently uploaded (20)
Land Cover Classification Assessment Using Decision Trees and Maximum Likelihood Classification Algorithms on Landsat 8 Data
- 1. DoubleClick: Journal of Computer and Information Technology E-ISSN: 2579-5317 P-ISSN: 2685-2152 Vol. 6, No. 2, February 2023, Pages 69-76 http://e-journal.unipma.ac.id/index.php/doubleclick Land Cover Classification Assessment.... (Luhur Moekti Prayoga, dkk)| 69 Land Cover Classification Assessment Using Decision Trees and Maximum Likelihood Classification Algorithms on Landsat 8 Data Luhur Moekti Prayogo1* , Bimo Aji Widyantoro2 , Amir Yarkhasy Yuliardi1 , Muhammad Hanif3 , Perdana Ixbal Spanton1 , Marita Ika Joesidawati1 1 Marine Science Study Program, Faculty of Fisheries and Marine, Universitas PGRI Ronggolawe, Tuban, 62381, Indonesia 2 Geomatics Engineering, Faculty of Engineering, Universitas Gadjah Mada, Yogyakarta, 55281, Indonesia 3 Department of Geo-Informatics, College of Computing, Khon Kaen University, Khon Kaen, 40002, Thailand * email: luhur.moekti.prayogo@unirow.ac.id Abstract. Classification technique on remote sensing images is an effort taken to identify the class of each pixel based on the spectral characteristics of various channels. Traditional classifications such as Maximum Likelihood are based on statistical parameters such as standard deviation and mean, which have a probability model of each pixel in each class. While the object-based classification method, one of which is the Decision Trees, is based on rules for each class with mathematical functions. This study compares the Decision Trees and Maximum Likelihood algorithms for land cover classification in the Surabaya and Bangkalan areas using Landsat 8 data. This research begins with creating Regions of Interest (ROIs) and Rules on images with greater than and less than functions for Decision Trees. The ROIs test was carried out using the Separability Index and matching each class using the Confusion Matrix. The experimental results show that the accuracy value resulting from the Confusion Matrix calculation is 90.48%, with a Kappa Coefficient Value of 0.87. The Decision Trees method produces land cover nigher to the actual condition than the Maximum Likelihood method. The difference in the class distribution of the two ways is not significant. This study is limited because the validation uses manual interpretation results. Future research is expected to use the large-scale classification results from the relevant agencies to verify the classification results and use field data, larger samples of ROIs, and the use of high-resolution imagery in order to improve the classification results. Keywords: Land Cover Classification, Assessment of Image Classification, Decision Trees, Maximum Likelihood, Spatial data mining, Madura Strait Abstrak. Teknik klasifikasi pada citra penginderaan jauh merupakan langkah yang dilakukan untuk pengidetifikasian kelas setiap piksel berdasarkan karakteristik spektral berbagai kanal. Klasifikasi tradisional seperti Maximum Likelihood didasarkan pada parameter statistik seperti standar deviasi dan rata-rata dimana memiliki model probabilitas dari setiap piksel pada setiap kelas. Sedangkan metode klasifikasi berbasis objek salah satunya Decision Trees didasarkan pada penggunaan rule setiap kelas dengan fungsi matematis. Penelitian ini bertujuan untuk membandingkan metode Decision Trees dan Maximum Likelihood untuk klasifikasi tutupan lahan di wilayah Surabaya dan Bangkalan menggunakan citra Landsat 8. Penelitian ini diawali dengan pembuatan Region of Interest (ROIs) dan Rule pada citra dengan fungsi greater than dan less than. Uji ROIs dilakukan dengan Index Separablity dan pencocokan setiap kelas menggunakan Matrix Confusion. Dari hasil percobaan menunjukkan bahwa nilai akurasi yang dihasilkan dari perhitungan Confussion Matrix sebesar 90,48% dengan Nilai Koefisien Kappa 0,87 dimana metode Decision Tree menghasilkan tutupan lahan lebih mendekati kondisi nyata dibandingkan metode Maximum Likelihood. Perbedaan distribusi kelas dari kedua metode tidak begitu signifikan. Penelitian ini terbatas karena validasi menggunakan hasil interpretasi manual.
- 2. DoubleClick: Journal of Computer and Information Technology E-ISSN: 2579-5317 P-ISSN: 2685-2152 Vol. 6, No. 2, February 2023, Pages 69-76 http://e-journal.unipma.ac.id/index.php/doubleclick 70|Land Cover Classification Assessment.... (Luhur Moekti Prayoga, dkk) Penelitian selanjutnya diharapkan menggunakan hasil klasifikasi skala besar dari badan terkait untuk memverifikasi hasil klasifikasi dan menggunakan data lapangan, sampel ROIs yang lebih banyak dan penggunaan citra resolusi tinggi agar dapat meningkatkan hasil klasifikasi. Kata Kunci: Klasifikasi Tutupan Lahan, Uji Klasifikasi Citra, Decision Trees, Maximum Likelihood, Penambangan data spasial, Selat Madura Introduction Remote sensing is a technique for obtaining object information on the earth's surface without direct contact with the object being sensed (Lillesand et al., 2004). Acquisition using this technique produces data information generally in remote sensing images (Cambell, J. B & Wynee, 2011). Remote sensing image is data from images in a remote sensing system. Sutanto (1987) states that image data consists of recorded images of objects similar to natural objects by optical, electro-optical, and optical-mechanical means. The ability of satellites to detect objects on the earth's surface depends on the sensor's specifications. This specification factor will cause the remote-sensing image to have different characteristics. One of the resulting accuracies in mapping depends on the classification method used. Classification of remotely sensed images is a method used to identify the class of each pixel based on the spectral characteristics of various bands (Sharma et al., 2013). Traditional classifications, such as Maximum Likelihood, are based on statistical parameters such as standard deviation and mean, which have a probability model for each class pixel (Franklin, 2001, Sharma et al., 2013). Mather (2004); Sharma et al. (2013) stated that this classification includes Nearest Neighbor (NN or kNN) and ISO Data. Object-based classification methods, one of which is Decision Trees, are still relatively rare, especially for land cover classification. Non-parametric classification techniques such as Artificial Neural Networks (ANN) and Rule-based classifiers are increasingly being used in various remote sensing researches (Ghose et al., 2010) Decision tree classification is also known to us as spatial data mining and knowledge discovery from spatial data (Jiang et al 2010). The decision tree classification technique is included in the category of supervised classification techniques, which is one of the inductive learning algorithms (Jijo & Adnan, 2021). This classification method with a tree-like structure, a classification algorithm that is easy to understand compared to other classifications (Priyam et al., 2013; Yadav & Pal, 2012). The top-level node is the root node, usually the attribute that most influences a particular class. Comparative studies of object-based and non-object-based classification methods are essential to see the performance of each method. This study compares the Decision Trees and Maximum Likelihood methods for land cover classification in the Surabaya and Bangkalan areas using Landsat 8 data. Materials and methods Research location and data This research is located around the Madura Strait, East Java, including Surabaya and Bangkalan. This location was chosen because it represents
- 3. DoubleClick: Journal of Computer and Information Technology E-ISSN: 2579-5317 P-ISSN: 2685-2152 Vol. 6, No. 2, February 2023, Pages 69-76 http://e-journal.unipma.ac.id/index.php/doubleclick Land Cover Classification Assessment.... (Luhur Moekti Prayoga, dkk) | 71 varied land cover conditions such as vegetation, water (sea), and buildings. The data used in this study are Landsat 8 images, including medium resolution images recorded on May 26, 2019. This data has a spatial resolution of 30 meters (multispectral channel) and 15 meters (panchromatic channel). The types of sensors in this image are The Operational Land Imager (OLI) and Thermal Infrared Sensor (TIRS) with paths 118 and row 65. Regions of Interest (ROIs) are made on objects to be classified, which in this study are divided into four classes, including vegetation, building, sea, and mix. Landsat 8 imagery includes medium resolution (30 meters) imagery were to divide more classes; it will be difficult to distinguish one object from another. Therefore, objects that are difficult to identify are classified as mixed objects. Building, vegetation, and marine classes are the most accessible classes to identify. The classification stage begins with radiometric correction. Danoedoro (2012) states that radiometric correction is a process of improving the pixel value of the image to match the reflected object value in the field, which aims to fill in the values in rows and columns that are missing due to sensor errors during recording. This correction is made due to various errors, including object reflectance, sensor point of view, tilt, atmospheric interaction, and nadir angle (Mather, 2004). Table 1. Landsat 8 Specifications Channel Wavelength (micrometers) Resolution (meters) Channel 1 - Ultra Blue (coastal/ aerosol) 0,435 - 0,451 30 Channel 2 - Blue 0,452 - 0,512 30 Channel 3 - Green 0,533 - 0,590 30 Channel 4 - Red 0,636 - 0,673 30 Channel 5 - NIR 0,851 - 0,879 30 Channel 6 - SWIR 1 1,566 - 1,651 30 Channel 7 - SWIR 2 2,107 - 2,294 30 Channel 8 - Panchromatic 0,503 - 0,676 15 Channel 9 - Cirrus 1,363 - 1,384 30 Channel 10 - Thermal 1 10,60 - 11,19 100* (30) Channel 11 - Thermal 2 11,50 - 12,51 100* (30) Source: (USGS, 2020) Decision trees classification The Decision Trees classification method is an algorithm that has a tree-like structure where each node describes data in attributes (Prabowo et al., 2018). The value obtained to fill in the object label information is presented in a table where each classed object will have a different label on each image channel. The classification structure on the nodes divides the dataset according to the specified class. The gain ratio value is used to determine how much information is obtained by knowing the value of an attribute. Equation 1 is a calculation of the Decision Trees method (Sharma et al., 2013). The information split value is used to view an attribute with multiple (multiple) instances. Equation 2 shows the information gained by dividing the part of Equation 1.
- 4. DoubleClick: Journal of Computer and Information Technology E-ISSN: 2579-5317 P-ISSN: 2685-2152 Vol. 6, No. 2, February 2023, Pages 69-76 http://e-journal.unipma.ac.id/index.php/doubleclick 72|Land Cover Classification Assessment.... (Luhur Moekti Prayoga, dkk) The gain criteria are chosen based on the explanatory variables to maximize in the classification process (Equation 3). Where split info (X) is the potential information generated by dividing the value of T into subsets (Equation 4): Maximum likelihood classification The Maximum Likelihood method is one of the classification methods used to maximize the likelihood function, which is one way to estimate unknown parameters (Bain & Engelhardt, 1992). The steps to maximize the Maximum Likelihood classification method (Bain & Engelhardt, 1992): Determine the Likelihood function (Equation 1): Forming the natural logarithm of Likelihood (Equation 2): Deriving the equation of the natural logarithm of Likelihood to ᶿ (Equation 3) : The result of the Maximum Likelihood estimation is ᶿ. Validation Result In this stage, we will compare the field survey data and the results of the analysis of satellite imagery classification. McCoy & Roger (2008) validation is needed to assess the truth and accuracy of digital image classification. The accuracy test compares field sample data with the results of digital image analysis (Ardiansyah, 2015). In this process we used Confusion Matrix calculation and Kappa Coefficient. Results and Discussion Results The ROIs were made for the four classes and then tested using a separability index. This test shows the separability of the classes created with a value range of 0-2. A type with a value close to 2 has good separability; however, if the value is close to 0, then the separability between classes is not good. It means the similarity between other types is very close to affecting the classification results). In this study, the resulting average value is close to 2, indicating that the ROIs pair have good separability. Decision trees classification results The Decision Trees method is built using binary code to determine the correct category for each image pixel. This classification method determines the most common object and then the most specific object in- class identification. The rules in each class can be determined independently by looking at the pixel value information in the image. The object class uses the words greater than, equal, less than. This study uses the Red, Green, and Blue (RGB) channels to facilitate the class identification process, with the channel arrangement in Landsat 8
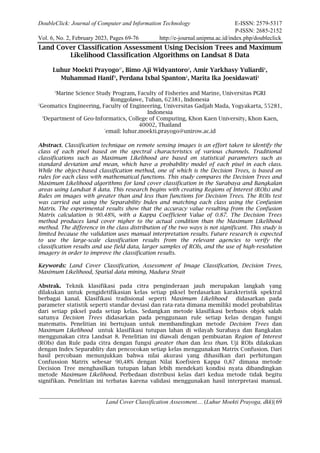
- 5. DoubleClick: Journal of Computer and Information Technology E-ISSN: 2579-5317 P-ISSN: 2685-2152 Vol. 6, No. 2, February 2023, Pages 69-76 http://e-journal.unipma.ac.id/index.php/doubleclick Land Cover Classification Assessment.... (Luhur Moekti Prayoga, dkk) |73 imagery being 4,3,2. First, the sea class values on the RGB channel are 7252- 9017, 8970-9900, and 9738-10459, respectively. Second, the value of the vegetation class on the RGB channel is 6693-9061, 8023-9919, and 8595- 9865, respectively. Third, the values for the building class on the RGB channel are 7793-10975, 8543-10620, and 9324-11125, respectively. Fourth, in the Mixed class (Ponds, Ponds), the RGB channel values are 12741-26078, 12268-22377, and 11604-20068. Table 2 shows the rule writing in the Decision Trees method with the greater than and less than functions. Table 2. Decision Trees method with the greater than and less than functions Object Rules Sea b1 gt 7252 and b2 gt 8970 and b3 gt 9738 and b1 lt 9017 and b2 lt 9900 and b3 lt 10459 Vegetation b1 gt 6693 and b2 gt 8023 and b3 gt 8595 and b1 lt 9061 and b2 lt 9919 and b3 lt 9865 Building b1 gt 7793 and b2 gt 8543 and b3 gt 9324 and b1 lt 10975 and b2 lt 10620 and b3 lt 11125 Mixed b1 gt 12741 and b2 gt 12268 and b3 gt 11604 and b1 lt 26078 and b2 lt 22377 and b3 lt 11604 The first classification method uses the Decision Trees classification. The rule-writing in the Decision Trees method uses the greater than and less than functions. First, the Sea class rules used are b1 gt 7252 and b2 gt 8970 and b3 gt 9738 and b1 lt 9017 and b2 lt 9900 and b3 lt 10459. Second, the Vegetation class rules used are b1 gt 6693 and b2 gt 8023 and b3 gt 8595 and b1 lt 9061 and b2 lt 9919 and b3 lt 9865. Third, the Rule Building class used is b1 gt 7793 and b2 gt 8543 and b3 gt 9324 and b1 lt 10975 and b2 lt 10620 and b3 lt 11125. Fourth, in the Mixed class, the rule used is b1 gt 12741 and b2 gt 12268 and b3 gt 11604 and b1 lt 26078, and b2 lt 22377 b3 lt 11604. The results of the classification on Landsat 8 images using the Decision Trees method showed that in Class 1 (Sea), the cover was 35.35%, in Class 2 (Mixed), the cover was 10.28%, in Class 3 (Building), the cover was 19.14%, and in Class 4 (Vegetation), the cover is 35.21% (Table 3). The second classification method uses the Maximum Likelihood classification. The classes used are the same as the previous method, namely Sea, Vegetation, Building, and Mixed. Unlike the Decision Trees method, the Maximum Likelihood method does not use the greater than and less than functions but uses training data from the ROIs that have been created. From the calculation results, it is found that in class 1 (Sea), the cover is 34.87%, in class 2 (Mixed), the cover is 6.65%, in class 3 (Building), the cover is 12.60%, and in-class 4 (Vegetation) cover of 45.86% (Table 3). Figure 1 shows the results of Landsat 8 image classification using the Decision Trees and Maximum Likelihood methods. Discussion The results of the two methods used for classification are shown in Table 3. This study did not use field data, so to test the correctness of the classification results, a crosscheck was carried out on Google Earth images with the 2019 recording, which was
- 6. DoubleClick: Journal of Computer and Information Technology E-ISSN: 2579-5317 P-ISSN: 2685-2152 Vol. 6, No. 2, February 2023, Pages 69-76 http://e-journal.unipma.ac.id/index.php/doubleclick 74|Land Cover Classification Assessment.... (Luhur Moekti Prayoga, dkk) close to the recording on the image. The Google Earth image was chosen because it has a more straightforward appearance, is open-source, and is available multitemporal, making it easier to validate the classification results. (a) (b) Figure 1. The results of the classification method on Landsat 8 images. (a) Decision Trees Classification, (b) Maximum Likelihood Classification The validation results show that the Decision Trees method produces a classification closer to the actual conditions in the field than the Maximum Likelihood method. In the Maximum Likelihood method, most mixed classes are generalized into vegetation classes. The vegetation
- 7. DoubleClick: Journal of Computer and Information Technology E-ISSN: 2579-5317 P-ISSN: 2685-2152 Vol. 6, No. 2, February 2023, Pages 69-76 http://e-journal.unipma.ac.id/index.php/doubleclick Land Cover Classification Assessment.... (Luhur Moekti Prayoga, dkk)| 75 class has the most significant percentage compared to other classes, 45.86%. Meanwhile, mixed classes are still well-identified in the Decision Trees method. The class test results using the Confusion Matrix showed an accuracy value of 90.48% with a kappa coefficient value of 0.87. Table 3. The results of the classification method of Decision Tree and Maximum Likelihood Method Sea (%) Vegetation (%) Building (%) Mixed (%) Decission Trees 35,35 35,21 19,14 10,28 Maximum Likelihood 34,87 45,86 12,60 6,65 Conclusion From the results of this study, it can be concluded several things including the distribution of classes generated in the Decision Tree method, namely class 1 (Sea) of 35.35%, in class 2 (Mixed) of 10.28%, in class 3 (Building) of 19, 14% and in class 4 (Vegetation) of 35.21%. While the Maximum Likelihood method of class distribution produced is class 1 (Sea) of 34.87%, in class 2 (Mixed) of 6.65%, in class 3 (Building) of 12.60%, and class 4 (Vegetation) of 45.86%. The accuracy value resulting from the Confusion Matrix calculation is 90.48%, with a Kappa Coefficient Value of 0.87. The Decision Tree method produces land cover closer to the actual condition than the Maximum Likelihood method. The difference in the class distribution of the two methods is not that significant. Acknowledgments The authors thank the United States Geological Survey (USGS) for providing Landsat 8 imagery data. References Ardiyansyah. (2015). Pengolahan Citra Penginderaan Jauh Dengan ENVI 5.1 dan ENVI LIDAR. PT Labsig Indraja Islim. ISBN 978-602- 71527-0-0 Bain & Engelhardt. (1992). Introduction to Probability and Mathematical Statistics. Wadsworth Publishing Company. Cambell, J. B and Wynee, R. H. (2011). Introduction to Remote Sensing, Fifth Edition. New York:Guildford Press. ISBN 978-1-60918-176-5. Danoedoro, P. (2012). Pengantar Pengindraan Jauh Digital. In Benedicta Rini W (Ed.), Penerbit ANDI (1st ed.). Penerbit ANDI. Franklin Steven E. (2001). Remote Sensing for Sustaible Forest Management . Lewis Publishers is an imprint of CRC Press LLC. ISBN. 634.9′2′028—dc21. Ghose K M, Pradhan Ratika, Ghose Sushan Sucheta. 2010. Decision Tree Classification of Remotely Sensed Satellite Data using Spectral Separability Matrix. (IJACSA) International Journal of Advanced Computer Science and Applications. Vol. 1, No.5, November . Jijo Taha Bahzad and Abdulazeez Mohsin Adnan. (2021). Classification Based on Decision Tree Algorithm in Machine Learning. Journal of Applied Science and Technology Trends. Vol 02. No 01. DOI : http://10.38094/jastt20165. Jiang Lihua, Wang Wensheng, Yang Xiaorong, Nengfu Xie & Youping Cheng. (2010). Classification
- 8. DoubleClick: Journal of Computer and Information Technology E-ISSN: 2579-5317 P-ISSN: 2685-2152 Vol. 6, No. 2, February 2023, Pages 69-76 http://e-journal.unipma.ac.id/index.php/doubleclick 76|Land Cover Classification Assessment.... (Luhur Moekti Prayoga, dkk) Methods of Remote Sensing Image Based on Decision Tree Technologies. IFIP Advances in Information and Communication Technology, vol 344. Springer, Berlin, Heidelberg. https://doi.org/10.1007/978-3- 642-18333-1_41. Lillesand, T. M., Kiefer, R. W., & Chipman, J. W. (2004). Remote sensing and image interpretation. In Nev York Chichester Brisbane Toronto 6IS s. Mather, P. M. (2004). Computer Processing of Remotely Sensed Data: An Introduction (John Wiley and Sons. (ed.); 3rd editio). Brisbane. McCoy & Roger M. (2005). Field Method in Remote Sensing. The Guildford Press. New York. ISBN 1-59385-079-4. Prabowo, N. W., Siregar, V. P., & Agus, S. B. (2018). Klasifikasi habitat bentik berbasis objek dengan algoritma support vector machines dan decision tree menggunakan citra multispektral spot-7 di Pulau Harapan dan Pulau Kelapa. Jurnal Ilmu Dan Teknologi Kelautan Tropis, 10(1), 123–134. Priyam, A., Abhijeeta, G. R., Rathee, A., & Srivastava, S. (2013). Comparative analysis of decision tree classification algorithms. International Journal of Current Engineering and Technology, 3(2), 334–337. Sharma, R., Ghosh, A., & Joshi, P. K. (2013). Decision tree approach for classification of remotely sensed satellite data using open source support. Journal of Earth System Science, 122(5), 1237–1247. Sutanto. (1987). Prinsip dasar penginderaan jauh. Panduan Aplikasi Penginderaan Jauh Tingkat Dasar. USGS. (2020). Landsat 8 Imagery. U.S. Department of the Interior. https://www.usgs.gov/. Yadav, S. K., & Pal, S. (2012). Data mining: A prediction for performance improvement of engineering students using classification. ArXiv Preprint ArXiv:1203.3832, 2(2). https://doi.org/2221-0741.