
Recomendados
Mais conteúdo relacionado
Destaque
Destaque (9)
Semelhante a Analysis of Home Energy Upgrades
Semelhante a Analysis of Home Energy Upgrades (20)
Último
Último (20)
Analysis of Home Energy Upgrades
- 1. Analysis of Home Energy Upgrades Long Plain Road, Whately, MA Louise Reardon Greenfield Community College, MA December 2016 Author Note (Andrea) Louise Reardon, Renewable Energy/Energy Efficiency Certificate course Faculty Advisor: Beth Paulson, Energy Efficiency, Greenfield Community College Contact Regards Paper: reardona1917@stuemail.gcc.mass.edu. 508-332-8925
- 2. REE 295 Directed Study 1 Acknowledgements Direction and technical advice from Beth Paulson. General counsel from Teresa Jones. Tuition on assemblies and heat loss from Jeremy Toal. Cooperation from Patrick Reardon. Insights and shared information from the Energia Insulation Crew. Equipment borrowed from Greenfield Community College. Abstract This paper describes and reports on the home energy upgrades undertaken during a remodel of what was a condemned property. Observations are made on many levels, both in dissecting the anatomy of the building and why there were inevitable problems with the house described in terms of simple building science. The property currently had very poor insulation and air barriers, the primary markers of overall thermal performance. It also stood empty for a year and had no electricity or running water for two years. The upgrade package therefore was straightforward. Baseline readings had to be established as there were no previous metrics to work from, such as energy or fuel bills. The house has been measured and modelled, analysed through the thermal camera, hygrometers and blower door. The findings suggest that the upfront investments are effective according to several cost analysis models. As this is an ongoing investigation further upgrades will be applied to the property but at the conclusion of this study and computing only the costs of the insulation/air sealing, boiler and heat pump water heater, the average payback in years is 8.1 years, average annual rate of return is 12.6% and average savings:investment ratio 1:2.35. All extremely positive results. Table of Contents 1. Project Overview................................................................................................................................................. 3 1.1 Reuse Recycle Remodel ......................................................................................................................................... 3 1.2 Does Energy Efficiency work, work? ..................................................................................................................... 4 2. Site Analysis........................................................................................................................................................ 4 2.1 Site Description....................................................................................................................................................... 4 2.2 Building Description............................................................................................................................................... 4 2.3 Building Analysis.................................................................................................................................................... 5 2.3.1 Building Bloopers................................................................................................................................................ 5 3 Recommended Upgrades..................................................................................................................................... 6 3.1 Weatherization Upgrades........................................................................................................................................ 7 3.2 Mechanical Upgrades.............................................................................................................................................. 8 3.2.1 Heating System.................................................................................................................................................... 8 3.2.2 Domestic Hot Water ............................................................................................................................................ 8 3.2.2 Washer/Dryer....................................................................................................................................................... 9 3.1.3 Cooker/Refrigerator ............................................................................................................................................. 9
- 3. REE 295 Directed Study 2 3.1.4 Mechanical Ventilation........................................................................................................................................ 9 4 Measuring Upgrades............................................................................................................................................ 9 4.1 Creating baselines. .................................................................................................................................................. 9 4.2 Measuring and Modelling the House.................................................................................................................... 10 4.3 Monitoring Changes.............................................................................................................................................. 10 5 Discussion of Findings ...................................................................................................................................... 10 5.1 Temperature and Humidity................................................................................................................................... 10 5.2 Air Infiltration Performance.................................................................................................................................. 11 5.3 Thermal Leakage .................................................................................................................................................. 11 5.4 Estimated Savings and Payback............................................................................................................................ 12 5.5 Home Energy Intensity ......................................................................................................................................... 12 Conclusion .................................................................................................................................................................. 13 References................................................................................................................................................................... 14 Appendices.................................................................................................................................................................. 15 Appendix Figures........................................................................................................................................................ 15 Figure 1-1. Topographical Map ................................................................................................................................. 15 Figure 1-2. Land Property Boundaries Map .............................................................................................................. 15 Figure 1-3. SketchUp Model of Buildings on Property ............................................................................................. 16 Figure 1-4. Plan Views of each Floor ........................................................................................................................ 17 Figure 1-5. Building Elevations................................................................................................................................. 18 Figure 2-1. Demolition Photos................................................................................................................................... 19 Figure 2-2. 1st Floor & Basement Wall Assembly..................................................................................................... 20 Figure 2-3. 2nd Floor Wall and Floor Assemblies ...................................................................................................... 21 Figure 2-4. Old Balsam Wool Advertisement............................................................................................................ 22 Figure 3-1. Mass Save Energy Efficiency Contract................................................................................................... 23 Figure 3-3. Thermal and Vapor Boundaries .............................................................................................................. 23 Figure 3-4. Insulation Installation.............................................................................................................................. 24 Figure 4-1. Thermal Imaging Before ......................................................................................................................... 25 Figure 4-2. Thermal Imaging After............................................................................................................................ 25 Figure 4-3. Troubleshooting with Thermal Camera................................................................................................... 27 Figure 4-4. Before and After Thermal Images of Attic 1 Insulation.......................................................................... 27 Appendix Tables......................................................................................................................................................... 27 Table 1. Area and Volume of Building...................................................................................................................... 27 Table 2. Roof Pitch Calculations ............................................................................................................................... 28 Table 3. Original Building Assemblies Weighted R/U Values.................................................................................. 28 Table 4. R/U Values for Window/Doors/Walls ......................................................................................................... 31 Table 5. Building Assemblies Weighted R/U Values after Measures........................................................................ 31 Table 6. Assembly R Value Before/After Comparisons............................................................................................ 34
- 4. REE 295 Directed Study 3 Table 7. Hygrometer Readings .................................................................................................................................. 34 Table 8. Annual Heat Loss Calculations (Q) ............................................................................................................. 38 Table 9. Annual Heat Loss Calculations After Measures (Q).................................................................................... 39 Table 10. Q Before/After Comparison....................................................................................................................... 41 Table 11. Costs analysis............................................................................................................................................. 41 Table 12. Estimated Home Energy Consumption...................................................................................................... 42 1. Project Overview According to the US Energy Information Administration, in 2015 40% of total US energy consumption was in buildings1 . And buildings are responsible for 39% of CO2 emissions from fossil fuels in the USA2 . At 399 Long Plain Road, there were no less than two oil boilers and two furnaces once in use, which is evidence of this property being developed in the days of cheap fuel and being a classic contributor to “the problem”. With a minimal smear of vermiculite in the attic and no insulation in the upstairs walls we have long plain evidence of the energy quite literally going through the roof. The intention of the project was to do as little as possible to make it move in ready, but with private projects of this kind the time line inevitably has stretched further than originally imagined. The scope of the work remained essentially to button up, insulate and decorate. This part of the renovation has been bolstered considerably by the Mass Save program, which when utilised has been of enormous value. Other projects within the renovation were simply necessary for safety and code, such as rewiring, plumbing upgrades, and building structurally engineered mid span beams in two rooms where the joists sagged at least 3” below their usual line. One window required replacing; an upstairs lavatory framed and installed; two small bedrooms were joined to form one. There was debate about conditioning the attic space for storage and possibly a bed loft, but that idea evaporated under the overwhelming evidence3 that the best (and cheapest) option would be to air seal the ceiling and pile up the fluffy stuff, as esteemed building scientist Joseph Lstiburek purports. 1.1 Reuse Recycle Remodel In this green building movement, the principle to improve what already exists rather than clear land and build new structures is what appealed the most in acquiring a fixer upper.4 Discovered by shrewd local enquiry these old houses are in supply, and in this case although technically condemned, the walls were plumb and the roof sound, which meant that much of the work would be cosmetic, with simple upgrades under the guidance of building science principles. The house had numerous places where recycled materials were used in its construction. Much of the subflooring was made from wainscot, the roof from old barn siding, and exterior wall sheathing from the form boards which were used to make the old basement concrete walls. In the early 1900s recycling of this kind was perhaps out of necessity, 100 years later it is for duty. In the spirit of recycling there was an opportunity to pull from a local warehouse multiple bags of fiberglass insulation which would otherwise have been trashed. The complication with this reuse was that the 1 http://www.eia.gov/tools/faqs/faq.cfm?id=86&t=1 2 http://www.eesi.org/files/climate.pdf Article from US Green Building Council 3 Lstiburek, Joseph. "A Crash Course in Roof Venting." Building Science Corporation. Web. 1 Aug. 2011. 4 http://grist.org/cities/this-old-house-why-fixing-up-old-homes-is-greener-than-building-new-ones/
- 5. REE 295 Directed Study 4 rolls were of many varying thickness and R values so a careful layout was required to create an even spread of thickness across the attic, with assistance of the thermal camera in layout. 1.2 Does Energy Efficiency work, work? Noah Horowitz is a Senior Scientist with the Natural Resources Defence Council who defends the energy efficiency program as one of the most effective energy policy tools5 . His articles prove that energy efficiency is easy to implement with measurable returns, but what does the low hanging fruit do for the big picture of emissions? What are the actual costs per ton of carbon to guarantee the program actually works? And are the costs of this program balancing the benefits over the lifetime of the upgrade? There are a number of sceptics to the energy efficiency solution, notably the study made by Fowlie, Greenstone & Wolfram6 . These economists followed a careful analysis of the federal weatherization program in Michigan, recognising that the cost of upgrades outweighed the savings. On closer investigation, the suspected Rebound Effect7 , where human behaviour might reduce the effectiveness, was not found to be the case. It is painful an inconvenient truth that this practice might not work, but for the sake of seeking solutions to regulate our climate by reduced CO2 emissions, one has to keep in the back on the mind the why and the how. In this study the measurements are accurate and calculations simple. But are we analysing them correctly? 2. Site Analysis 2.1 Site Description The 1.4 acre property is located south of route 116 and to the east of the railroad8 . The grade is almost flat with a very slight slope to the west (See figure 1-1). The soil is quick draining sandy loam. There is a well drilled in the yard beyond the greenhouse and the plot is sited over an aquafer. To the north are tall deciduous and pine trees offering good shelter from wind, and a visual and sound barrier to the roads. The building axis runs east-west, so there is an almost exact south aspect for solar heat gain and possible photovoltaic addition. Figure 1-3 shows the initial SketchUp model of the building sited on a google earth aerial photograph. This serves to illustrate some of the surrounding vegetation as well as giving an impression of the building in its approximate form. 2.2 Building Description Location Type: Rural Climate Region: Zone 5 Lat./Long.: 42.4773° N, 72.6079° W Elevation: 197’ Annual CDD & Base Temp: 2525, 50o F 5 https://www.nrdc.org/issues/promote-efficient-buildings-and-appliances 6 http://econresearch.uchicago.edu/sites/econresearch.uchicago.edu/files/paper_draft_06_15_clean.pdf 7 The direct rebound effect, describes the situation in which a consumer may use an efficient product more often or more intensively if it costs less to operate. Examples are where an LED light is left on longer then an incandescent light, or the thermostat cranked higher in favour of wearing fewer clothes, or savings spent on international travel. 8 Refer to Figure 1 & 2 for topographic detail and parcel boundaries
- 6. REE 295 Directed Study 5 Annual HDD9 & Base Temp: 6894, 65o F Type of Construction: Single Family, Detached Conditioned Floor Area: 1374 ft2 Conditioned Building Vol: 11292 ft3 Unconditioned Building Vol: 10092 ft3 Roof Pitch10 : 7.6/ 12 inches Occupancy: 3 The property is divided in two sections: the old section is said to be build c.1900, the new section c.1940. The old section has two floors, the new section one floor. The basement is the exact same size as both sections beneath11 . The floor plans are all depicted accurately in Figure 1-4. There are two chimneys, the one that runs through the center of the old section is used for the boiler, which in turn serves the baseboard heating system, and one that runs through the center of the new section is used by a wood furness, which is turn delivers forced hot air to the bathroom and the sitting room. 2.3 Building Analysis The property at the time of purchase had poor insulation and air barriers. It has stood without electricity and water for two years and without occupants for one year. The initial blower door test measured air movement of 5472 CFM-50, or 1.5 ACH, demonstrating the house to be extremely leaky12 . The insulation was found to be minimal and dated. In the old section of the house, the downstairs was found to be wrapped with Balsam Wool in tar paper on the 1st floor. The original intention it seemed was to establish a thermal barrier around the first floor, and according to the advertising13 for balsam wool products a vapor barrier. It would seem that the product must have performed well enough, but was just not thick enough with an estimated R value of 3.25. The old section attic had about 2” of vermiculite in the joist bays above the lath and plaster ceiling. There was no insulation in the walls of the 2nd floor and evidence that there were once small stoves used in each bedroom where there were 6” holes in the sides of the central chimney. These were incidentally not sealed so without a good draw; the noxious boiler fumes could have made these rooms dangerously toxic to sleep in. The warm moist air that would have travelled up the stairs must have condensed on the walls and ceilings of the 2nd floor, evidenced by the extensive measures of black mould found on most of the surfaces in that half of the upstairs. Notably the mould was at bay, presumably from there having been no inhabitants for a year. The new section of the house had the same ½” balsam wool in the walls and faced fiberglass batts in the attic of with an approximate R value of 10. The rim joists were not air sealed or insulated in either section. 2.3.1 Building Bloopers During the demolition period an incisive dissection of the building was made possible where particularly the 2nd floor had to be stripped back to the studs14 . Here is a list of poorly designed features or assemblies that do not follow the current thinking in building science. 9 Franklin Co. Climate Zone 14a. Heating Degree Days taken from http://www.mass.gov/eopss/docs/dps/780-cmr/780061.pdf Franklin Co. Climate Zone 14a 10 Reference Table 2 Roof Pitch Calculations 11 Reference area and volumes of the property in Table 1 12 For initial ACH, reference Table 8 Q calculations 13 Reference the original marketing piece for Balsam Wool. Claims were made as to its thermal and vapor control properties. 14 See photographs of wall and ceiling removal in Figure 6
- 7. REE 295 Directed Study 6 1. Single pane windows, loss through conduction/radiation 2. Lead weight pulleys allow air flow 3. Aluminium frames on storm windows, loss through conduction 4. Storm windows allow air ingress/escape 5. Basement windows are single panes & leaky. Intro stack effect 6. Basement door huge leaks 7. Basement pipes run up exterior stud bays 8. Attic 1 no hatch cover 9. Attic 1 no insulation 10. Attic 1 single pane window, also not air sealed 11. Attic 1 wind washing from no proper vents from soffits to ridge vent 12. Extensive black mould growth in ceilings and walls of 2nd floor 13. Numerous air leaks through sheathing 14. Many gaps in sheathing between attic 1 and 2 15. No insulation in 2nd floor walls 16. Leaky holes in chimney where old vent pipes entered 17. Exterior doors warped, leaky with single panes 18. No air sealing or insulation along rim joist 19. No DHW/baseboard pipes insulated 20. Unscaled exterior penetrations (leccy, oil fill) 21. No interior wall insulation 22. All window surrounds uninsulated, not air sealed 23. Metal gauze in ceiling plaster, heat transfer? 24. Very leaky bathroom vent and light penetrations 25. Moisture transfer through basement walls, capillary effect against soil 26. No kitchen ventilation 27. Bathroom ventilation tracks down through soffit. Should be up. 28. No guttering at all, permitting splash damage and seepage in to the basement walls. 3 Recommended Upgrades The Mass Save Audit took place on August 26th 2016. An excerpt of the Mass Save Audit recommendations may be seen in Figure 3-1. To make the below objectives a reality both mechanical and structural upgrades were required. Under the weatherization program $2000 of the insulation work would be covered, $1700 of the boiler cost, $750 of the heat pump water heater, $350 of the washer and free weather sealing. So, it was worth the high capital cost of these upgrades, sensible to install during the renovation and well worth playing by the Mass Save rule book. The goals of the renovation were to 1) Make the home more comfortable 2) Make it healthy and safe to live in 3) Make it energy efficient 4) All retrofits are lasting The house as a system approach is vital to designing conditions to assure the above goals, looking at the interaction of one system with another. The dryer venting into the basement is a classic example, where if not monitored or where warm moist air is allowed to meet any cold surface (see thermal image of basement
- 8. REE 295 Directed Study 7 windows in slide show) mould can very form and there are health risks to the inhabitants. The previous occupants had to endure mould on the 2nd floor, lead paint on all surfaces, CO fumes leaking in to the bedrooms from unsealed holes in the chimney. The jobs list had to be ordered carefully. First on the list being securing financing. Second most important job was the vermiculite removal. All jobs hinged on this being done. None of the Mass Save measures could be initiated. No lath and plaster could be removed. With the possibility of asbestos in the house no blower door test could be attempted, which is why the first CFM readings were taken in October. With the vermiculite gone, the work could start in earnest. 3.1 Weatherization Upgrades 3.1.1 Air Sealing. It is little surprise that the Mass Save program offers 8 hours of “free” air sealing, as this is clearly the fix all. Reflecting on the black mould issue on the 2nd floor, the simple explanation is that warm moist air would have funnelled up the stairs and condensed on the cold surfaces upstairs where there was little and no insulation. With the house having no water or electricity for a couple of years the mould had lost its supply of moisture, but clearly ready for round two. The original thermal barrier was formed only around the first floor where balsam bags were stapled to the fronts of the studs and between the floors (the residence of which the mice have enjoyed for many years). See figure 3-3 for the before/after position of the thermal and vapor barriers. After the insulation had been blown in to the walls, drywall was installed on the 2nd floor. The tape, plaster and paint is said to be sufficiently air tight, so the newly hung ceiling called for air sealing in the attic above the 2nd floor. Doing this at night with lights on beneath proved to be most effective. The central ceiling light fittings will likely still prove to leak, so a heat camera will be useful to assess this down the time line with the addition of thermal caps. 3.1.2 Insulation. On interviewing the previous residents, the comment that most stuck out was to the effect “you couldn’t heat the house”. The 2” of vermiculite in the attic and the absence of the attic hatch above the stair well where warm air could freely funnel up and out made this clear why. Aside from the carbon footprint and the sheer cost of heating a leaky house, there was the issue of some of the baseboard pipes being lead through the exterior walls, outside of the balsam bags. By virtue of the house being leaky, the boiler would have constantly been running, which would have kept the water in the pipes warm and therefore reduced the risk of freezing. The balloon framing of the house meant that the insulation could be blown in to the 1st floor walls from the 2nd floor (see Figure 3-4). Attempts were made to remove the balsam bags ahead of the contractor arriving but the bags had been stapled to the fronts of the studs and the gypsum board screwed in over the tops of those, so dense pack cellulose could only be piped in around this, which might mean that there are gaps in the dense pack. Fortunately, the 2nd floor, having had no insulation and all interior panelling, lath and plaster removed meant that new electrical wiring could be easily run and mesh netting rigged ahead of dense packing cellulose. Further it meant a complete coverage could be ensured with a visual check by all parties. After the 1st floor had the cellulose blown in to all stud bays, a ring of rock wool was installed (see Figure 3- 4) to act as a fire barrier. Having the walls open at this time provided the perfect opportunity for easy installation and peace of mind.
- 9. REE 295 Directed Study 8 The attic in the new section had the Mass Save provided 12” of loose blown in cellulose, plus an additional 4” to stretch to R58. Proper vents were installed in all rafter bays because without this there is a candy cane effect in roof snow melt. The attic in the old section was not included in the Mass Save efforts, instead this will have further air sealing and loose cellulose blown in sometime next year when funds permit. Until that time this section is insulated with fiberglass as described in section 1.1. When this was installed the thermal camera became an essential tool for locating gaps might by reading heat loss from below and heat gain from above. See Figure 4-3 for the before and after impressions of the 2nd floor ceiling. 3.2 Mechanical Upgrades 3.2.1 Heating System The house already had a functioning baseboard heating system (albeit with a couple of small leaks on the pressure test) with an ancient Williams Boil-O-Matic boiler installed in 1976 and predated that in its manufacture. The baseboards are the heavy iron radiators and the copper piping that runs the length of the basement and up through the walls all had copper brackets. So the installation had clearly been well considered. During the Mass Save energy audit, when the boiler was fired up, it ran, but the exhaust fumes belched in to the basement, as it was later discovered due to the giant brick of carbon that had formed and wedged inside the chimney. This was likely welded with rainwater from an un-capped chimney top, so this was later made water tight when the liner was installed ahead of the new boiler installation. The Early Boiler Replacement Rebate offer of $1700 was an important lure to installing the brand new Buderus G115WS/3, with an AFUE rating of 86%. It is very likely that the original boiler would have been running at an efficiency of 70-75% at this time, so at the very least, as far as CO2 emissions are considered, we are gaining ground. The literature in the Mass Save Heat Loan Program declares “one way to help offset the cost of energy and significantly reduce heating costs is to replace your old boiler now with a new high efficiency boiler”. It is on this high-ticket item that the echoes of the critics to the federal weatherization assistance program are heard. The rationale for efficiency is unarguable, the reductions in emissions the case, but the economics of the upgrade are questionable. The original invoice for $7055 was reduced after the rebate to $5355. This paper will later review the payback in tandem with other efficiency measures in section 5.4. There are no provisions in this house for cooling in the hot summer months. However, during the hottest days in 2016 the house always felt comfortably cooler then outside, so it may be concluded that opening windows and cross ventilation will suffice. 3.2.2 Domestic Hot Water The original system was an indirect water heater, sensibly located in the basement beneath the kitchen and bathroom where the hot water would be required. This is a sweeping assumption as there was no tank, rather an open-ended pipe fed from the boiler to a location where a concrete pedestal presumably housed a tank. Any upgrade in this instance was an improvement. The decision to invest in a heat pump water heater15 was twofold, one efficiency at the lowest cost and two it additionally serves as a dehumidifier in the basement. Advertising16 state annual savings of up to $250 are possible, 50% less energy use, and payback in 3 years when compared with old electric resistance heaters. The rebate for this was $700 off a $2362 invoice, see section 5.4 for payback. 15 A.O. Smith SHPT-50 16 Energizect. "Whole Home Solutions: Heat Pump Water Heaters." YouTube, 20 Feb. 2015. Web.
- 10. REE 295 Directed Study 9 3.2.2 Washer/Dryer The c.1991 washer resided in the outhouse, draining to an unknown end. The machine ran but was outstandingly water hungry. It was inefficient, rusty, confined and hard on clothing. Mass Save supported the rebate offer of $350 for such a relic, and after Black Friday sales an Energy Star rated LG front loader was delivered and installed in the basement for a very nominal $171. There are no improvements that can be made to this. Payback will be in a matter of months when compared to schlepping baskets to a laundromat plus the CO2 emissions of yet to be replaced vehicles. 3.1.3 Cooker/Refrigerator Mass Save make generous offers for removal and purchase subsidy, however on these two counts no application will be made as a kindly friend donated their old fridge/freezer for free and the existing electric cooker operates well enough to not warrant replacement at this time. These will likely be reviewed in the second wave of works in a couple years. The large fridge that was in the property on purchase was disposed of correctly as it didn’t cool and the air seals were damaged. The replacement is further preferred as the model with the top freezer is found to be the most energy efficient where the heat of the compressor is well away from the cooling elements, there is no ice maker, and no break in the thermal envelope. 3.1.4 Mechanical Ventilation The bathroom fan was vented out of the soffit. The adjustment made to this was to cut a hole in the roof and install a stack, so that warm heavily moist air would indeed vent without the risk of condensation forming where air is trapped before the downward angle of the pipe. This does pose a new problem where this is a direct hole from the conditioned area, and clear evidence was seen with snow melt around the stack (photograph can be seen on Final Presentation slideshow). The remedy will likely be a new extractor fan which can seal when not in use, thus preventing warm interior air piping directly up and out. The newly installed 2nd floor toilet has a 100CFM extractor fan installed and piped out the gable end to avoid having to cut another hole in the roof. The ducting for this which runs across the attic has been additionally insulated with a roll of fiberglass over it to remove the chances of warm and cold meeting too abruptly. They dryer vent will be seasonally directed to the interior so that heat will not be lost to the outside and humidity is returned to the air. The assumption is that the heat pump water heater will absorb any excess, which is yet to be proved correct. In the summer time the dryer will be vented to the exterior for the very opposite reasons. The hygrometer readings did respond when the dryer was first used (see Table 7), but because the house is not yet lived in the heat pump water heater is not constantly active to absorb moisture. 4 Measuring Upgrades 4.1 Creating baselines. Due to there being no records of recent energy use (propane, electricity, or oil) a Home Energy Intensity profile could not be drawn up. Because there were no metrics to work from, the first condition is to establish a baseline. The blower door was used to measure ACH to define air sealing targets (table 8,9,10), the thermal camera for insulation targets (figure 4-1), Hygro-Thermometer for air quality targets (table 7) and to evaluate systems or components as they were improved.
- 11. REE 295 Directed Study 10 Pre-renovation measured in at 1.5ACH with the upstairs door open and 1.0ACH with the door to the upstairs shut, so the target was set at 0.5ACH upstairs door open. CFM air exchange rates were measured by Energia, the insulations contractors before and after air sealing to monitor air exchange rate reduction. Looking in to table 9 they used the conditions where both upstairs and basement doors were shut. A thermal imaging camera records the intensity of radiation in the walls and building assembly so scrutiny of before and after thermal imagining should reveal changes in conductive heat loss and/or air leakage, and whether improvements in one area (eg walls) might worsen losses in another component (eg windows) where temperature differences are transferred quicker. 4.2 Measuring and Modelling the House For annual heat loss calculations, the house was accurately measured, including all the spaces between floors. The measurements can be seen in Table 1. The basement although air sealed by Energia, and somewhat conditioned because the baseboard heating pipes run through the space, was designated “unconditioned” because it is not insulated or finished. The wall assemblies were recorded and drawn up (figure 2-1 and 2-2). There had to be three wall conditions used as the old and new sections had different sized stud and joists and different “on center” measurements. Also the 2nd floor insulation differed to the 1st floor. Weighted R value for the walls where studs and stud bays are balance. Each elevation (figure 1-5) has a different set of R values and number of windows, so reading figure 1-5 alongside tables 8 and 9 will help make the configuration clear. The windows were measured and valued at a low U value of 0.5. The small windows on the exterior doors were included in the measurements as there is significant heat loss recorded by the thermal camera (figure 4-2). 4.3 Monitoring Changes Several blower door tests were run throughout the study period (table 9) so a gradual improvement could be observed. Table 6 (which summarises tables 4 and 5) shows the before and after comparisons of building assemblies, where R values improved up to 58% in the 2nd floor walls. Review tables 8 and 9 for the breakdown of U/R values for all assemblies, summarised in table 10 for a side by side view. Distinct improvements were made with a final Qtotal improvement of 31%. Hygrometer readings were taken for the first couple of months comparing the basement to the 1st floor. And latterly, once the 1st floor had regulated after being properly insulated and the furness running daily, comparing the basement to the 2nd floor. The 2nd floor in the early stages was under demolition and essentially was completely unconditioned and open to the elements, all bar the wind and rain. These readings were taken routinely, and the 24hour hi/lo extremes were also recorded which proved to be interesting where large diurnal fluctuations occurred in the weather outside. Thermal Cameras show the invisible temperatures and are an incredible view of the house. It is the tool that most effectively shows how the building operates. There are several informative impressions in figures 4-1 to 4-4 from over the course of the study, which are discussed below. 5 Discussion of Findings 5.1 Temperature and Humidity The contents of the hygrometer tables were fashioned in to graphs and pie charts, but they were too busy to be easily read, it seemed more clear to read the table after all. What was important was that generally the
- 12. REE 295 Directed Study 11 readings rose and fell at the same but the fluctuations were broader outside the basement. Nonetheless graphs are shown after Table 7. The psychrometric chart tracks humidity/health/wellness and the ranges for comfort defined by temperature and humidity. Ideals are 70o F@20% humidity and 80o F@55% humidity. Extremes can lead to discomfort where an over dry environment in winter can lead to excessively dry skin and measures of static electricity, or extreme humidity in a hot climate can lead to rot and mould17 . In this study the basement was likely to be the one place that demonstrated true statistics as the other two floors went through several transformations. What can be surmised is the basement was consistently more humid then the first floor and followed a much steadier temperature fluctuations. The 1st and 2nd floors experienced more varied temperature and humidity levels, matching itself more to the outdoors. 5.2 Air Infiltration Performance It was interesting to note changes as they happened: with/without upstairs drywall; addition of insulation/air sealing; addition of rim joist insulation when tracking the blower door results before/during/after measures. Table 10 compares the Qtotal values and really it is worthy of note that both Qconvection and Qinfiltration improved on side by side hovering around 30%. Table 6 reveals how significantly the R values of all walls were improved after insulation was blown in. That improves the losses through convection. The losses through infiltration discovered by improving blower door results (table 9). Notice that the “test out” measure made by the contractor’s blower door test is below the target ACH, which was before the drywall was rigged on the 2nd floor ceiling. But it is disheartening that the most recent reading with the same conditions (upstairs and basement doors closed) are closer to their “test in” results. Tempting it was, not to use the correction factor of 0.75 in the Qconvection and Qinfiltration heat loss calculations because there were no internal heat gains: no people, no lighting, no appliances. But this wouldn’t have been a suitable comparison as it should be assumed the building has always been inhabited, particularly for later comparisons when it is. The difference introducing this correction factor swayed the lost Qconvection from 51,051 kBtu to 38,288 kBtu and Qinfiltration from 48,890 kBtu to 36,667 kBtu. Normally the 8 hours of air sealing provided by Mass Save is done in the attic. The attic in the new section was sealed, then insulated (see photos in final presentation slideshow), but the attic in the new section was wide open. Therefore, the remaining air sealing time was taken to seal the rim joists in the basement. It did not make the basement air tight because of the old ill-fitting steel window frames, but it would have contributed considerably to the overall Qinfiltration score. The basement door had gaping holes, particularly at the bottom, so great efforts were made to insulate and air seal there. The heat camera originally illustrated the Z-frame, and latterly that was invisible but for infiltration of cold air at the very bottom. 5.3 Thermal Leakage During the warmer months of Fall, the thermal camera did not have the range of temperature to capture much information on screen (figure 4-1). The extreme temperature ranges in winter made it much easier to register differences (figure 4-2) and therefore where heat loss was present through the walls, doors and windows. Figure 4-2 show a few (of the many) images taken after the insulation was complete. Notable heat loss was evident on much of the corner framing, studs, electric sockets (even if this shouldn’t have been the case 17 Visit this webpage for discussion on keeping relative humidity at mid-range. “Asthma Triggers Humidity Allergy." Breathe Easy Home. 17 Aug. 2015.
- 13. REE 295 Directed Study 12 with cellulose in the walls), creeping in around the chimney, the thinnest panels on the exterior doors, an isolated spot where the header board prevented insulation being placed. Other notable heat loss at the final assessment was all the corners of the framing. Insulators have spoken of it being impossible to stop this unless it is possible to insulate the framing, it will always act as a thermal bridge. Advanced framing allows for bridging to be reduced. The impressions of the 2nd floor ceiling (figure 4-4) before/after insulation was put in are very telling. A distinct loss of heat driving up through the ceiling. Couple this with the image of the door to the upstairs (figure 4-2) showing clearly the bottom panel cold with the air pouring down the stairs from the lesser insulated 2nd floor. Excellent before/after pictures can be seen on the slideshow of snow melt before/after 2nd floor attic insulation was installed, coupled with the thermal images of the ceiling losing/not losing heat. Thermal imagery is a great way to learn a property, discoveries that would otherwise be completely invisible. Reference figure 4-3 for how effective the camera was at troubleshooting where the insulation had a gap next to a soffit. From below the heat loss is clear, as is the heat gain from an image taken from above. This tool became essential when laying out the fiberglass in the attic as evenly as possible. There was a corner in the master bedroom that showed significant thermal bridging, which would not be ideal for pushing the bed up against, but would go unseen were it not for the thermal camera. The metal windows in the basement on the north and south showed very different conditions in the same moment in time (see slideshow), the south in the sun was bridging heat inward, the north metal frame bridging heat out. 5.4 Estimated Savings and Payback After rebates the insulation, boiler and heat pump water heater totalled $9,322 (upfront cost $13,772). Table 11 shows the unit costs, life expectancy and projected annual savings. It also shares how the boiler and insulation were arrived at using the differences between old and new systems. These metrics are used to calculate the three perspectives of payback in years, annual rate of return and savings:investment ratio (SIR). Rate of return is a profit on an investment over a period of time, expressed as a proportion of the original investment.18 At between 10-15% for each measure, this is quite high, and on the stock market this would be laudable. SIR takes the total energy savings over the lifetime of the improvement (Present Value) divided by the upfront cost of the investment. As all the values are (considerably) more than 1, this is good19 . This measurement shows no without units, and as a measure of performance is favoured in the weatherization trades. Payback period for all items is satisfactory being all less than a decade for significant household items. The washer was not added to the list as with the rebate and the Black Friday sales the price was unusually low. Albeit in the name of social science it should rightly be included. 5.5 Home Energy Intensity Assuming the amount of oil burned would be about 350gals/year20 and the assumed electrical consumption using an online calculator (table 12), an HEI figure can be established. Area Basement 898 ft2 Area 1st Floor 898 ft2 Area 2nd Floor 476 ft2 18 "Rate of Return." Wikipedia. Wikimedia Foundation. Web. 30 Dec. 2016. 19 Moody, Rob. "The Science of Saving Energy." GreenBuildingAdvisor.com. Green Building Advisor, 30 July 2009. Web. 30 Dec. 2016. 20 Several online accounts of retrofit houses of about the same age claimed approximately this amount.
- 14. REE 295 Directed Study 13 Total Area 2272 ft2 Est. Annual kWh 1592 kWh x 3412Btu/kWh = 5,431,904 Btus Est. Total Oil 350 gals x 138000Btu/gal = 48,300,000 Btus Est Annual Consumption 59,163,808 Btus Home Energy Intensity 59,163,808Btus /2272 ft2 26,040.409Btus/ft2 Conclusion If every household took the time to learn the anatomy of the building through the eyes of the blower door, thermal camera, and hygrometer, it is likely we could solve many of the problems we have on our planet. Having an insight in to one’s own home in terms of physics, knowing the interaction of heat, air and water, and how changes to one element affect the other two should really be common knowledge. Learning about how air sealing and insulation affect the movement of air and moisture through the house is key to maintaining an efficient and healthy home. The most important lesson learned in this study was the intricate flow and pressure distributions created by interactions between the building envelope, mechanical systems and exterior environment, and how this affects the way the building operates. Air carries moisture which impacts durability and performance of building materials, as well as the spread of pollutants (IAQ), thermal energy, and fire. So the control of air pressure is key to several important performance aspects of the building system. This is still a work in progress, so at the time of writing there is still another blower door test due at the end of this iteration of the renovation to see how close the house is to its target ACH. Subsequent measures are installing foam board on the rim joists, air sealing and insulating to R60 the top attic, and possibly sealing the attic hatch and using the outside window to enter that space should it ever be called for. Data on air quality will continued to be monitored to determine if tightening the house affected air quality. If a mechanical HRV is required and should this be located in the basement for additional removal of any radon. Occupant behaviour should be monitored for low energy living and in time the addition of solar PV and DC powered lighting and equipment will be considered. All the intended efficiency upgrades were complete for this stage of the renovation, and so far as the scope of this directed study is concerned we are able to conclude that all energy upgrades have been a success. So here we return to the question posed at the outlay, does EE pay back in actual savings not projected savings? The EPIC21 Report certainly caused a buzz in discovering that the federal program does not have the intended outcome as far as reduction of avoided carbon emissions is concerned. The energy use per participating household did go down, but it came at a cost of $32922 per ton of avoided CO2, well in excess of the $38 per ton government defined social cost. In this case study, there would have to be further access to data, at least a year of oil bills and a diligent calculation of the embodied energy of the entire renovation, which would presumably include details such as the life cycle costs of the cellulose, to the fuel to transport it to the property, to the energy used to blow it in the walls, to details like the future of the dumpster contents after demolition. 21 The Energy Policy Institute at the University of Chicago (EPIC) is contributing solutions to reliable and affordable energy, while limiting its social and environmental impacts. https://epic.uchicago.edu/about 22 “the monetized value of the avoided damages from a ton of abated CO2 emissions” Wolfram, Fowlie, and Greenstone. Do Energy Efficiency Investments Deliver? Evidence from the Weatherization Assistance Program. Page 30-33
- 15. REE 295 Directed Study 14 References Fowlie, Meredith, Michael Greenstone, and Catherine D. Wolfram. "Do Energy Efficiency Investments Deliver? Evidence from the Weatherization Assistance Program." SSRN Electronic Journal. Print. Lstiburek, Joseph W. “Builder's Guide to Cold Climates: A Systems Approach to Designing and Building Homes That Are Healthy, Comfortable, Durable, Energy Efficient, and Environmentally Responsible”. Westford, MA: Building Science, 2004. Print. Thomas, Brinda Ann. “Energy Efficiency and Rebound Effects in the United States: Implications for Renewables Investment and Emissions Abatement”. Carnegie Mellon U, n.d. Print. Porter, Eduardo. "Climate Change Calls for Science, Not Hope." The New York Times. 23 June 2015. Web. 29 Dec. 2016.
- 16. REE 295 Directed Study 15 Appendices Appendix Figures Figure 1-1. Topographical Map23 Figure 1-2. Land Property Boundaries Map 23 http://www.topozone.com/massachusetts/franklin-ma/city/south-deerfield/
- 17. REE 295 Directed Study 16 Figure 1-3. SketchUp Model of Buildings on Property
- 18. REE 295 Directed Study 17 Figure 1-4. Plan Views of each Floor a) Basement b) 1st Floor c) 2nd Floor
- 19. REE 295 Directed Study 18 Figure 1-5. Building Elevations a) South Elevation b) North Elevation b) West Elevation c) East Elevation
- 20. REE 295 Directed Study 19 Figure 2-1. Demolition Photos
- 21. REE 295 Directed Study 20 Figure 2-2. 1st Floor & Basement Wall Assembly
- 22. REE 295 Directed Study 21 Figure 2-3. 2nd Floor Wall and Floor Assemblies
- 23. REE 295 Directed Study 22 Figure 2-4. Old Balsam Wool Advertisement
- 24. REE 295 Directed Study 23 Figure 3-1. Mass Save Energy Efficiency Contract Figure 3-3. Thermal and Vapor Boundaries
- 25. REE 295 Directed Study 24 Figure 3-4. Insulation Installation a) Blowing cellulose in to balloon framing behind netting b) Blown in Cellulose to 1st Floor walls c) Fire Barrier Rockwool between floors
- 26. REE 295 Directed Study 25 Figure 4-1. Thermal Imaging Before Figure 4-2. Thermal Imaging After
- 27. REE 295 Directed Study 26
- 28. REE 295 Directed Study 27 Figure 4-3. Troubleshooting with Thermal Camera Figure 4-4. Before and After Thermal Images of Attic 1 Insulation Appendix Tables Table 1. Area and Volume of Building Volume of 399 Long Plain Road Location Condition/ Non- conditioned Length (ft) Width (ft) Height (ft) Volume (Ft3) 1st Floor Old Conditioned 25.63 18.58 7.63 3630.94 Floor Assembly 1st Fl old Conditioned 25.63 18.58 0.59 282.38 1st Floor New Conditioned 22.96 18.38 7.63 3216.63 Floor Assembly 1st Fl new Conditioned 25.63 18.38 0.76 357.85 2nd Floor Old Conditioned 25.63 18.58 7.34 3497.13 Floor Assembly 2nd Fl Conditioned 25.63 18.58 0.65 307.14 Basement Old Non-conditioned 25.63 18.58 6.84 3259.04 Basement New Non-conditioned 22.96 18.38 6.84 2887.16
- 29. REE 295 Directed Study 28 Porch Vol Non-conditioned 8.00 17.90 7.50 1074.00 Porch Attic Vol Non-conditioned 8.00 17.90 2.50 179.00 Attic Old Vol Non-conditioned 25.60 18.58 6.00 1427.17 Attic New Vol Non-conditioned 22.96 18.38 6.00 1265.56 Total Conditioned Area 1374.23 ft2 Total Non- Conditioned Area 1938.82 ft2 Total Volume of Area 3313.05 ft2 Total Conditioned Volume 11292.09 ft3 Total Non- Conditioned Volume 10091.94 ft3 Total Volume of Property 21384.02 ft3 Table 2. Roof Pitch Calculations Rise (M) 75 Inches Run (R) 118.5 Inches Slope (X) 7.6/ 12 inches Angle (A) 32.3degrees Rafter Length (L) 140 ¼ Inches Table 3. Original Building Assemblies Weighted R/U Values Wall Downstairs (old) Component R-Value on 2x4 R-Value Cavity Assembly R-Value Wall - Outside Air Film (winter) 0.17 0.17 0.17 Siding Aluminum 0.61 0.61 0.61 Siding - Cedar Wood 1.25 1.25 1.25 Housewrap (tar paper) 0.06 0.06 0.06 Sheathing 7/8 pine 2.06 2.06 2.06 2x4 stud @ 21" oc (1.2/inch) 4.2 3.332 Balsam 1" 3.25 5/8" Gypsum Board 0.56 0.56 0.56 1/8 wood panels 0.33 0.33 0.33 Inside Air Film 0.68 0.68 0.68 Percent for 21" o.c. + Additional studs 11% 89% Total Wall Component R-Values 9.92 8.97
- 30. REE 295 Directed Study 29 Wall Component U-Values 0.1008 0.1115 Total Wall Assembly R-Value 9.052 Wall Downstairs (new) Component R-Value on 2x6 R-Value Cavity Assembly R-Value Wall - Outside Air Film (winter) 0.17 0.17 0.17 Siding Aluminum 0.61 0.61 0.61 Siding - Cedar Wood 1.25 1.25 1.25 Housewrap (tar paper) 0.06 0.06 0.06 Sheathing 7/8 pine 2.06 2.06 2.06 2x4 stud @ 16" oc (1.2/inch) 4.2 3.365 Balsam 1" 3.25 5/8" Gypsum Board 0.56 0.56 0.56 1/8 wood panels 0.33 0.33 0.33 Inside Air Film 0.68 0.68 0.68 Percent for 16" o.c. + Additional studs 15% 85% Total Wall Component R-Values 9.92 8.97 Wall Component U-Values 0.1008 0.1115 Total Wall Assembly R-Value 9.085 Wall Upstairs (old) Component R-Value on 2x4 R-Value Cavity Assembly R-Value Wall - Outside Air Film (winter) 0.17 0.17 0.17 Siding Aluminum 0.61 0.61 0.61 Siding - Cedar Wood 1.25 1.25 1.25 Housewrap (tar paper) 0.06 0.06 0.06 Sheathing 7/8 pine 2.06 2.06 2.06 2x4 stud @ 21" oc (1.2/inch) 4.2 1.0275 Air Space 0.94 lath & plaster 0.25 0.25 0.25 1/8 wood panels 0.33 0.33 0.33 Inside Air Film 0.68 0.68 0.68 Percent for 21" o.c. + Additional studs 11% 89% Total Wall Component R-Values 9.61 6.35 Wall Component U-Values 0.1041 0.1575 Total Wall Assembly R-Value 6.4375
- 31. REE 295 Directed Study 30 Ceiling (old) Component R-Value on 2x6 R-Value Cavity Assembly R-Value Attic air film 0.61 0.61 0.61 2x6 joist @ 21" oc (1.2/inch) 6.6 8.251 Vermiculite (2.13/inch) 8.52 lath & plaster 0.25 0.25 0.25 Inside air film 0.61 0.61 0.61 Percent for 21" o.c. + Additional studs 11% 89% Total Ceiling Component R-Values 8.07 9.99 9.721 Ceiling Component U-Values 0.1239 0.1001 Total Ceiling Assembly R-Value 16.16 Ceiling (new) Component R-Value on 2x6 R-Value Cavity Assembly R-Value Attic air film 0.61 0.61 0.61 2x6 joist @ 16" oc (1.2/inch) 6.6 9.285 faced fiberglass 3" 10 razer lath & plaster 0.47 0.47 0.47 Inside air film 0.61 0.61 0.61 Percent for 16" o.c. + Additional studs 15% 85% Total Ceiling Component R-Values 8.29 11.69 10.975 Ceiling Component U-Values 0.1206 0.0855 Total Ceiling Assembly R-Value 27.13 Roof Component R-Value on 2x6 R-Value Cavity Assembly R-Value Wall - Outside Air Film (winter) 0.17 0.17 0.17 shingle 0.44 0.44 0.44 tar paper 0.06 0.06 0.06 sheathing 1.32 1.32 1.32 rafter 2x4 @ 21" oc (R1.2/inch) 4.2 1.0491 Air Space 0.96 Percent for 24" o.c. + Additional rafter 11% 89% Total Roof Component R-Values 6.19 2.95 3.0391 Roof Component U-Values 0.16 0.34 0.33 Total Roof Assembly R-Value 3.0391
- 32. REE 295 Directed Study 31 Basement Slab Component R-Value R-Value Cavity Assembly R-Value 1" concrete slab (assumed) 0.8 0.8 Total Slab Assembly R-Value 0.8 Basement Wall Component R-Value R-Value Cavity Assembly R-Value 8' Concrete Block 2 2 Total Wall Assembly R-Value 2 Table 4. R/U Values for Window/Doors/Walls Windows Component U-Value ft2 # windows Total Area 1. Single pane window combined with a storm window 0.5 10.86 16 173.74 2. Single pane window combined with a storm window 0.5 5.00 1 5.00 3. Single pane window combined with a storm window 0.5 15.17 1 15.17 4. Single pane window on Door 1 1.1 1.43 1 1.43 5. Single pane window on Door 2 1.1 3.35 1 3.35 Doors Component R-Value Total ft2 1. Kitchen Door 2.17 20.06 2. Front Door 2.17 20.06 Walls Component R-Value Total ft2 1. Old/Down 9.05 574.67 2. Old/Up 6.42 624.76 3. New/Down 9.09 529.07 Table 5. Building Assemblies Weighted R/U Values after Measures Wall Downstairs (old) Component R-Value on 2x4 R-Value Cavity Assembly R-Value Wall - Outside Air Film (winter) 0.17 0.17 0.17 Siding Aluminum 0.61 0.61 0.61 Siding - Cedar Wood 1.25 1.25 1.25 Housewrap (tar paper) 0.06 0.06 0.06 Sheathing 7/8 pine 2.06 2.06 2.06
- 33. REE 295 Directed Study 32 2x4 stud @ 21" oc (1.2/inch) 4.2 8.8472 Balsam 1" 3.25 Dense pack Cellulose (R3.5/inch) 7 5/8" Gypsum Board 0.56 0.56 0.56 1/8 wood panels 0.33 0.33 0.33 Inside Air Film 0.68 0.68 0.68 Percent for 21" o.c. + Additional studs 11% 89% Total Wall Component R-Values 9.92 15.97 Wall Component U-Values 0.1008 0.0626 Total Wall Assembly R-Value 14.5672 Wall Downstairs (new) Component R-Value on 2x6 R-Value Cavity Assembly R-Value Wall - Outside Air Film (winter) 0.17 0.17 0.17 Siding Aluminum 0.61 0.61 0.61 Siding - Cedar Wood 1.25 1.25 1.25 Housewrap (tar paper) 0.06 0.06 0.06 Sheathing 7/8 pine 2.06 2.06 2.06 2x4 stud @ 16" oc (1.2/inch) 4.2 8.4296 Balsam 1" 3.25 Dense pack Cellulose (R3.5/inch) 7 5/8" Gypsum Board 0.56 0.56 0.56 1/8 wood panels 0.33 0.33 0.33 Inside Air Film 0.68 0.68 0.68 Percent for 16" o.c. + Additional studs 15% 85% Total Wall Component R-Values 9.92 15.97 Wall Component U-Values 0.1008 0.0626 Total Wall Assembly R-Value 14.1496 Wall Upstairs (old) Component R-Value on 2x4 R-Value Cavity Assembly R-Value Wall - Outside Air Film (winter) 0.17 0.17 0.17 Siding Aluminum 0.61 0.61 0.61 Siding - Cedar Wood 1.25 1.25 1.25 Housewrap (tar paper) 0.06 0.06 0.06 Sheathing 7/8 pine 2.06 2.06 2.06 2x4 stud @ 21" oc (1.2/inch) 4.2 10.1163 Dense pack Cellulose (R3.5/inch) 12.25 Drywall 1/2" 0.45 0.45 0.45
- 34. REE 295 Directed Study 33 Inside Air Film 0.68 0.68 0.68 Percent for 21" o.c. + Additional studs 11% 89% Total Wall Component R-Values 9.48 17.53 Wall Component U-Values 0.1055 0.0570 Total Wall Assembly R-Value 15.3963 Ceiling (old) Component R-Value on 2x6 R-Value Cavity Assembly R-Value Attic air film 0.61 0.61 0.61 2x6 joist @ 21" oc (1.2/inch) 6.6 15.738 Fiberglass Batts (approx 6") 19 Drywall 1/2" 0.45 0.45 0.45 Inside air film 0.61 0.61 0.61 Percent for 21" o.c. + Additional studs 11% 89% Total Ceiling Component R-Values 8.27 20.67 17.408 Ceiling Component U-Values 0.1209 0.0484 Total Ceiling Assembly R-Value 32.80 Ceiling (new) Component R-Value on 2x6 R-Value Cavity Assembly R-Value Attic air film 0.61 0.61 0.61 2x6 joist @ 16" oc (1.2/inch) 6.6 15.5 Blown In Cellolose 16" 20.35 Blown In Cellolose 16" 38.85 38.85 38.85 razer lath & plaster 0.47 0.47 0.47 Inside air film 0.61 0.61 0.61 Percent for 16" o.c. + Additional studs 15% 85% Total Ceiling Component R-Values 47.14 60.89 56.04 Ceiling Component U-Values 0.0212 0.0164 Total Ceiling Assembly R-Value 88.84 Roof Component R-Value on 2x6 R-Value Cavity Assembly R-Value Wall - Outside Air Film (winter) 0.17 0.17 0.17 shingle 0.44 0.44 0.44 tar paper 0.06 0.06 0.06 sheathing 1.32 1.32 1.32 rafter 2x4 @ 21" oc (R1.2/inch) 4.2 1.0491
- 35. REE 295 Directed Study 34 Air Space 0.96 Percent for 24" o.c. + Additional rafter 11% 89% Total Roof Component R-Values 6.19 2.95 3.0391 Roof Component U-Values 0.16 0.34 0.33 Total Roof Assembly R-Value 3.0391 Basement Slab Component R-Value R-Value Cavity Assembly R-Value 1" concrete slab 0.8 0.8 Total Slab Assembly R-Value 0.8 Basement Wall Component R-Value R-Value Cavity Assembly R-Value 8' Concrete Block 2 2 Total Wall Assembly R-Value 2 Table 6. Assembly R Value Before/After Comparisons Total R Values for Assembly Before After % improvement Wall Downstairs (old) 9.052 14.5672 37.9 Wall Downstairs (new) 9.085 14.1496 35.8 Wall Upstairs (old) 6.4375 15.3963 58.2 Ceiling (old) 16.1585 17.408 7.2 Ceiling (new) 27.1335 56.04 51.6 Roof 3.0391 3.0391 0.0 Basement Slab 0.8 0.8 0.0 Basement Wall 2 2 0.0 Table 7. Hygrometer Readings Hygrometer Readings for 399 Long Plain Road Basement 1st Floor 2nd Floor Date Relativ e Humidi ty (%) 24Hr Hi/Lo (%) Temp (oF) 24Hr Hi/Lo (oF) Relative Humidity (%) 24Hr Hi/Lo (%) Temp (oF) 24Hr Hi/Lo (oF) Relative Humidity (%) 24Hr Hi/Lo (%) Temp (oF) 24Hr Hi/Lo (oF) 9/29/16 73 73/58 63 70/63 70 70/58 63 72/63 9/30/16 71 73/58 63 70/63 66 70/58 63 72/63 10/1/16 10/2/16 77 77/73 61 63/61 75 75/68 61 75/68 Rainy weekend
- 36. REE 295 Directed Study 35 10/3/16 10/4/16 10/5/16 10/6/16 75 78/71 61 63/59 74 74/67 61 63/59 sunny dry clear 10/7/16 75 80/70 59 61/59 70 79/50 59 64/57 10/8/16 86 86/72 63 63/59 89 89/69 63 64/59 By 5pm Humidity @ 89% 10/9/16 78 86/77 61 63/59 76 89/71 61 63/59 10/10/16 69 79/69 59 61/59 69 77/67 59 61/57 Dehumidifier in basement for box storage 10/11/16 63 79/60 57 61/55 60 77/59 54 61/54 10/12/16 68 69/63 57 59/57 62 63/44 55 57/54 10/13/16 68 71/63 55 59/55 70 70/44 54 59/54 9:30 10/13/16 71 74/65 59 59/55 76 84/60 59 59/54 22:00 10/14/16 65 74/62 57 59/57 48 84/48 55 59/54 Huge fluctuations 1st Fl. Prolly due to house tightness 10/15/16 61 66/52 57 59/55 57 57/46 55 57/52 10/16/16 69 70/52 57 57/54 82 86/50 61 61/52 10/17/16 71 72/52 59 59/54 81 86/50 61 61/52 10/18/16 77 77/72 61 63/59 85 91/79 64 66/61 rain 10/19/16 81 83/72 61 63/59 81 91/79 64 66/61 10/20/16 72 83/71 61 64/61 66 88/59 61 70/61 10/21/16 76 82/71 61 64/61 75 75/59 61 70/61 10/22/16 70 79/70 57 63/57 61 91/55 57 63/57 10/23/16 64 78/64 57 61/55 48 70/47 55 61/54 basement dehumidifier turned off 10/24/16 47 66/46 55 59/55 51 64/46 55 55/54 10/25/16 56 58/46 54 59/52 49 62/48 52 55/50 10/26/16 53 58/46 50 58/50 48 62/47 46 55/46 10/27/16 52 54/49 48 52/48 56 56/42 41 48/41 snow. burst pipe in basement from wiring job 10/28/16 66 66/52 48 48/46 67 67/55 45 45/41 10/29/16 57 66/55 55 59/48 58 70/56 52 61/43
- 37. REE 295 Directed Study 36 10/30/16 66 66/57 59 59/54 68 74/57 57 57/52 10/31/16 58 73/57 54 59/52 52 74/51 55 59/52 insulation blown in walls/basemen t sealed 11/1/16 52 57/48 52 57/50 52 58/49 50 57/48 11/2/16 63 64/48 54 57/50 57 59/49 52 57/48 11/3/16 63 70/60 64 66/55 59 69/55 70 70/57 11/4/16 68 70/60 59 66/55 56 69/55 66 70/57 11/5/16 11/6/16 11/7/16 11/8/16 55 55/47 61 61/57 47 50/45 64 66/59 11/9/16 52 55/47 57 61/57 48 50/45 61 66/59 11/10/16 53 57/50 61 63/59 45 48/43 64 68/64 11/11/16 51 54/49 59 63/59 43 48/42 68 68/64 50 55/42 55 68/55 11/12/16 46 54/44 59 63/59 39 55/38 64 68/55 11/13/16 51 51/44 59 61/59 41 41/37 64 66/63 11/14/16 47 51/44 59 63/59 40 43/36 66 68/63 11/15/16 46 51/44 63 63/57 62 62/36 50 68/46 11/16/16 57 58/46 61 63/59 69 71/63 55 55/52 11/17/16 56 59/51 57 63/57 67 74/67 57 59/45 11/18/16 58 58/51 59 63/57 56 73/53 59 59/45 11/19/16 57 58/51 59 59/57 70 72/53 59 59/46 11/20/16 55 58/51 59 59/57 70 72/53 48 59/46 11/21/16 42 54/41 55 63/55 54 71/53 50 52/45 11/22/16 42 45/41 57 59/55 52 66/49 46 55/46 11/23/16 41 45/40 55 59/55 53 66/49 46 55/41 11/24/16 11/25/16 47 47/41 57 59/55 63 63/52 46 50/43 11/26/16 50 54/47 59 61/55 66 67/62 48 55/48 11/27/16 48 53/45 57 61/55 65 73/62 50 55/43 11/28/16 47 49/42 57 59/55 65 75/64 52 54/39 11/29/16 46 48/45 59 59/55 64 72/60 50 54/46 drywall installed upstairs 11/30/16 52 53/45 57 61/55 77 77/60 54 54/46 12/1/16 55 58/52 61 61/57 77 82/74 57 57/52
- 38. REE 295 Directed Study 37 12/2/16 51 58/50 61 63/57 70 82/65 55 57/50 drywall taped/sanded 12/3/16 49 53/49 61 61/55 65 70/65 52 57/50 12/4/16 46 50/45 55 61/55 62 65/61 50 52/46 12/5/16 45 47/43 55 57/55 62 65/60 46 52/45 12/6/16 47 47/42 55 63/54 62 68/60 48 50/46 12/7/16 46 47/42 61 63/54 65 68/60 46 50/46 12/8/16 46 49/45 57 61/54 64 67/61 46 50/46 12/9/16 44 51/40 59 61/54 56 65/55 54 54/43 1st time use of indoor dryer vent 12/10/16 38 63/37 57 59/54 57 62/55 48 54/39 12/11/16 37 38/33 54 59/52 47 62/44 50 59/43 12/12/16 43 45/35 57 59/52 52 52/46 54 54/50 snow 12/13/16 45 46/41 55 59/54 51 69/49 59 59/50 12/14/16 44 47/42 55 61/54 49 53/48 61 63/52 12/15/16 38 47/36 54 61/54 46 72/46 55 63/52 laundry day in basement 12/16/16 31 66/28 55 59/52 44 54/44 59 61/46 Arctic Chill 12/17/16 35 36/28 57 57/52 46 47/41 50 61/48 12/18/16 42 44/33 55 57/54 49 49/45 50 50/48 12/19/16 36 45/35 55 57/54 47 50/47 54 54/48 12/20/16 34 41/34 56 56/51 45 49/45 53 53/47 12/21/16 32 38/30 50 55/50 43 48/42 48 54/45 12/22/16 41 41/32 54 54/50 46 46/42 50 50/48 12/23/16 43 43/39 52 55/52 48 48/45 54 54/48 12/24/16 12/25/16 12/26/16 38 48/37 57 57/52 47 50/46 50 55/48
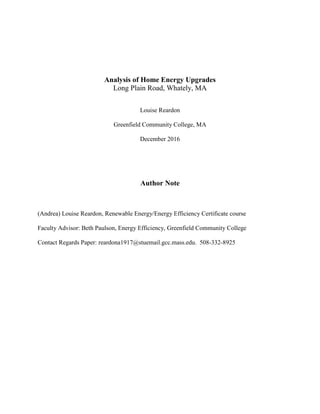
- 39. REE 295 Directed Study 38 Table 8. Annual Heat Loss Calculations (Q) Windows Component U-Value ft2 # windows Total Area Net Area per U value Q conduction 1. Single pane window combined with a storm window 0.5 10.859 16 173.744 0 10 20 30 40 50 60 70 80 90 100 Date 10/2/16 10/8/16 10/11/16 10/13/16 10/16/16 10/19/16 10/22/16 10/25/16 10/28/16 10/31/16 11/3/16 11/9/16 11/12/16 11/15/16 11/18/16 11/21/16 11/25/16 11/28/16 12/1/16 12/4/16 12/7/16 12/10/16 12/13/16 12/16/16 12/19/16 12/22/16 Humidity Readings Compared Basement 1st Floor 2nd Floor 0 10 20 30 40 50 60 70 80 Temperature Readings Compared Basement 1st Floor 2nd Floor
- 40. REE 295 Directed Study 39 2. Single pane window combined with a storm window 0.5 5 1 5 3. Single pane window combined with a storm window 0.5 15.167 1 15.167 193.911 12031401.91 4. Single pane window on Door 1 1.1 1.426 1 1.426 5. Single pane window on Door 2 1.1 3.35 1 3.35 4.776 651929.7312 Doors Component U-Value Total ft2 Net Area per U value Q conduction 1. Front Door 0.46 18.6372 2. Kitchen Door 0.46 16.713 35.3502 2017871.428 Walls Component U-Value R-value Total ft2 Net Area per U value Q conduction 1. Old/Down 0.1105 9.052 574.67 489.4528 6711458.043 -6 1 window, door 1+ window 2. Old/Up 0.1558 6.42 624.76 554.606 10722493.74 -6 window 1, 1 window 2 3. New/Down 0.1101 9.085 529.07 450.404 6153657.802 -4 window 1, 1 window 3, 1 door 2 + window Total 38288812.65 ACH conditioned area CFM CFM Nat mins in hr ACH Q infiltration 11292.09 5472 273.6 60 1.453760996 36667696.90 original existing 10/4 all open 11292.09 3867 193.35 60 1.027356318 25912643.26 original existing 10/4 upstairs shut 11292.09 1000 50 60 0.265672696 6 6700968 target Table 9. Annual Heat Loss Calculations After Measures (Q) Windows
- 41. REE 295 Directed Study 40 Component U-Value ft2 # windows Total Area Net Area per U value Q conduction 1. Single pane window combined with a storm window 0.5 10.859 16 173.744 2. Single pane window combined with a storm window 0.5 5 1 5 3. Single pane window combined with a storm window 0.5 15.167 1 15.167 193.911 12031401.91 4. Single pane window on Door 1 1.1 1.426 1 1.426 5. Single pane window on Door 2 1.1 3.35 1 3.35 4.776 651929.7312 Doors Component U-Value Total ft2 Net Area per U value Q conduction 1. Front Door 0.4600 18.6372 2. Kitchen Door 0.4600 16.713 35.3502 2017871.428 Walls Component U-Value R-value Total ft2 Net Area per U value Q conduction 1. Old/Down 0.0686 14.5672 574.67 489.4528 4169447.585 -6 1 window, door 1+ window 2. Old/Up 0.0707 14.1496 624.76 554.606 4863894.934 -6 window 1, 1 window 2 3. New/Down 0.0650 15.3963 529.07 450.404 3630192.525 -4 window 1, 1 window 3, 1 door 2 + window TOTAL 27364738.11 ACH conditioned area CFM CFM Nat mins in hr ACH Q infiltration 11292.09 2315 115.75 60 0.6150323 15512740.92 energia in 10/31 upstairs
- 42. REE 295 Directed Study 41 & basement shut 11292.09 1713 85.65 60 0.4550973 11478758.18 energia out 11/2 upstairs & basement shut 11292.09 3599 179.95 60 0.9561560 24116783.83 current existing 12/9 all open 11292.09 3045 152.25 60 0.8089734 20404447.56 current existing 12/9 upstairs closed 11292.09 2303 115.15 60 0.6118442 15432329.30 current existing 12/9 upstairs & basement closed 11292.09 0 60 0 0 ALL TIGHTENED UP! Date? 11292.09 2000 100 60 0.531345393 1 13401936 target Table 10. Q Before/After Comparison Annual Heat Loss Before After % improvement Q Convection 38288812.65 27364738.11 28.5 Q Infiltration 36667696.9 24116783.83 34.2 Q Total 74956509.54 51481521.94 31.3 Table 11. Costs analysis Cost Effectiveness Measure cost life expectancy annual savings projection Simple payback in years Annual Rate of return savings:investme nt ratio Insulation 2355 25 255 9.2 10.83% 2.71 Boiler 5355 20 641 8.4 11.97% 2.39 heat pump water heater 1612 13 240 6.7 14.89% 1.94 Boiler unit efficiency 800&350 gals in BTUs Btu output difference savings in $ old boiler 70 110400000 77280000 35403900 641.375
- 43. REE 295 Directed Study 42 new boiler 86.7 48300000 41876100 Heat Pump Water Heater no existing unit. savings from web Insulation Btus difference ann. heat loss before 74956509.54 23474987.6 ann. heat loss after 51481521.94 Table 12. Estimated Home Energy Consumption Energy Calculator Home & Shop Blender x 1 = 05 kwh/mo. Christmas Tree Lights x 1 = 011 kwh/mo. Circular Saw x 1 = 012 kwh/mo. Clothes Dryer (electric) x 1 = 013 kwh/mo. Clothes Washer x 1 = 014 kwh/mo. Coffee Maker x 1 = 015 kwh/mo. Computerx 2 = 034 kwh/mo. Crock Pot® x 1 = 018 kwh/mo. Food Processor x 1 = 031 kwh/mo. Hair Dryer x 1 = 038 kwh/mo. Heater, Portable x 1 = 039 kwh/mo. Iron x 1 = 050 kwh/mo. Lamp 100w x 1 = 052 kwh/mo. Lamp, Fluorescent x 1 = 053 kwh/mo. Mixer (hand held) x 1 = 054 kwh/mo. Oven (electric) x 1 = 057 kwh/mo. Range- Broiler x 1 = 058 kwh/mo. Refrigerator Freezer, Energy-Efficient x 1 = 060 kwh/mo. Sewing Machine x 1 = 064 kwh/mo. Shaver, Electric x 1 = 065 kwh/mo. Stereo x 1 = 066 kwh/mo. Television, Color 35 inch x 1 = 072 kwh/mo. Toaster 2 slice x 1 = 073 kwh/mo. Tools - Bench Grinder x 1 = 075 kwh/mo. Tools - Circular Saw x 1 = 076 kwh/mo. Tools - Drill x 1 = 077 kwh/mo. Tools - Sabre Saw x 1 = 078 kwh/mo. Tools - Sander, Belt x 1 = 079 kwh/mo. Tools - Sander, Disc x 1 = 080 kwh/mo. Vacuum x 1 = 084 kwh/mo. Water Heater, Electric x 1 = 089 kwh/mo. Total kwh/mo 1592 Estimated Monthly Cost $208.03