2. there is no sufficient amount of accurate in vivo WSS measurements
in human subjects.
The objective of this work was the quantification of blood volume
flow (Q), wall shear rate (WSR) and wall shear stress (WSS) in the
human smallest diameter arterioles of the eye using axial velocity
measurements from a previous work (Koutsiaris et al., 2010).
The quantification method described in the following section
takes into account the microvessel diameter in the estimation of the
cross-sectional velocity Vs by using a profile factor function (PFF)
which requires as input axial velocity measurements (Koutsiaris,
2005). Then Q and WSR can be estimated in relation to microvessel
diameter using Vs. In addition, the dependence of dynamic viscosity
on diameter is taken into account using the in vivo viscosity law
(Pries et al., 1994).
Therefore, the unique characteristic of this WSS quantification
method is that it takes into account the combined effect of diameter,
firstly on WSR and secondly on dynamic viscosity, leading to the final
estimation of WSS.
The aforementioned method was applied here, for the first time, to
the precapillary arterioles of the human eye where significant pulsa-
tion exists (Koutsiaris et al., 2010). So, averages of Q, WSR and WSS,
during the cardiac cycle, are presented separately from systolic and
diastolic values.
The equations of the power law best fit trend lines describing the
relationship of Q, WSR and WSS with diameter could be valuable to
basic science researchers who need reference to in vivo values for
their experiments in the laboratory or their theoretical models. In ad-
dition these equations could be helpful to clinical researchers in order
to study how physiological WSS values change in disease states or
after the administration of drugs.
Materials and methods
Experimental arrangement
The experimental set up shown in Fig. 1 consisted of a slit lamp
(Nikon FS-3 V) connected with a high-speed CCD camera (12 bit, PCO
Computer Optics GmbH, Germany) and a PC (Pentium 4, 3 GHz). The
system produced digital images of 320×240 pixels at a frame rate of
96 frames per second (fps) with an enhanced maximum magnification
of 242× and a digital resolution of 1.257±0.004 μm/pixel. More details
on the experimental set up can be found elsewhere (Koutsiaris et al.,
2010).
Subjects
Fifteen (15) normal human volunteers were included in the study
with an age between 24 and 38 years, an average body mass index
(BMI, defined as the number of body kilograms over the square of
the height) of 23±3 kg/m2
, no smoking or alcohol habit, no ocular
or systemic disease and they were not under any medication.
Nine (9) volunteers were men and six (6) were women. Data from
female subjects were acquired after their menstruation and before
the premenstrual period of 8 days.
Images were recorded from the right eyes (temporal side of the
bulbar conjunctiva) and no volunteer contributed by more than two
microvessels to the total sample. Recordings were not taken into
account when a 20% (or more) change occurred in either of the initial
systolic or diastolic arterial blood pressure. In addition, subjects with
a diastolic blood pressure greater than 90 mmHg were excluded from
the study as hypertensive. All subjects waited at least 40 min for
adaptation in a room temperature between 22 and 24 °C.
The project was approved by the research ethics committee of the
university hospital of Larissa and informed consent was obtained
from all participants in the study.
Image registration
Images were registered employing a manual approach and using
a graphical user interface programme developed in MATLAB soft-
ware platform. One image from each image sequence was tagged as
‘reference’ and the remaining ‘mobile’ images were all registered to
the reference using 2 white cross-hair tools forming a simple grid
of 9 rectangular quadrilaterals. Mobile images were translated
along the x and y axes (two-dimensional registration) so that its
characteristic regions were aligned with the ‘reference’ image. The
manual registration procedure is described in more detail in a previ-
ous work (Koutsiaris et al., 2010).
Internal diameter (D) and axial velocity (Vax) pulse quantification
The internal diameter (D) was estimated using the Pythagoras's the-
orem from the coordinates of the intersection points between a vertical
line to the vessel axis and the outer limits of the erythrocyte column.
The diametric value assigned to each arteriole was the average of 3 or
4 different measurements.
Objective
lens
CCD
CameraHuman
Conjunctiva
Optical Axis
LCD
MONITOR
Slit lamp
PC
Fig. 1. Schematic diagram of the experimental set-up.
35A.G. Koutsiaris et al. / Microvascular Research 85 (2013) 34–39
3. Axial erythrocyte velocity (Vax) was measured using the axial dis-
tance DC travelled by a RBC or a plasma gap, over a fixed time interval Δt:
Vax ¼ DC=Δt ð1Þ
Δt is known from the frame rate of the camera as equal to 10.04 ms.
Estimation of cross-sectional velocity Vs and volume flow Q
In microvessel diameters less than approximately 20 μm, blood
cannot be considered as a “continuum” and a velocity profile cannot
be used in the ordinary sense in order to estimate cross-sectional
velocity (Koutsiaris, 2012). So, for the conversion of the axial velocity
Vax to the cross-sectional velocity Vs a profile factor function
(PFF, Koutsiaris, 2005) was used, assuming that the average human
erythrocyte diameter is equal to 7.65 μm (Koutsiaris et al., 2007).
Blood volume flow (Q) was estimated by the product of the
cross-sectional velocity VS and the cross-sectional area S (assuming
a circular cross-section):
Q ¼ VS
π D
2
4
ð2Þ
Estimation of wall shear rate WSR
Wall shear rate (WSR) was determined using VS values:
WSR ¼
8 VS
D
ð3Þ
Estimation of wall shear stress WSS
The wall shear stress (WSS) was estimated from the formula:
WSS ¼ η WSR ð4Þ
where η is the dynamic viscosity (apparent) of blood which was
estimated as a function of diameter using the in vivo viscosity law
(Pries et al., 1994) and a technique described by Koutsiaris et al.
(2007). The in vivo viscosity law requires the instantaneous values of
the systemic hematocrit (Hs) and the discharge hematocrit (Hd) for
each microvessel separately. Since instantaneous hematocrit measure-
ments for each microvessel could not be performed here, average values
were used for all the microvessels: Hs=45% and Hd =18%.
Changes during the cardiac cycle
In contrast to the venular part of the human microcirculation, the
arteriolar part exhibits a pulsating behavior with an average resistive
index equal to 53% (Koutsiaris et al., 2010). Consequently the quanti-
ties of velocity, volume flow, wall shear rate and wall shear stress
change significantly throughout the cardiac cycle.
Every pulsating waveform related to the cardiac cycle is character-
ized by a peak systolic (PS) and an end diastolic (ED) value. The time
interval between 2 successive PS values defines the pulse period and
during this period the average (AV) value can be estimated. There-
fore, each hemodynamic quantity was presented in 3 parts: a) peak
systolic (PS), b) average (AV) and c) end diastolic (ED).
In each of the aforementioned parts, the equation of the power
law best fit trend line describing the relationship of the hemodynamic
quantity with the diameter was presented, together with the corre-
sponding correlation coefficient (r).
Statistical analysis
Microsoft Office EXCEL 2003 (professional edition) was used for
statistical analysis. Correlations were estimated with Pearson's corre-
lation coefficient.
Results
Measurements were taken from 30 different precapillary arteri-
oles of the bulbar conjunctiva with diameters ranging from 6 to
12 μm. At least 150 images were recorded from each microvessel, cor-
responding to a recording time of approximately 1.5–2 s and a total of
more than 5000 images were registered manually for subsequent
measurement of axial velocity Vax (Koutsiaris et al., 2010).
Axial velocities (Vax), cross-sectional velocities (Vs), volume flows
(Q), wall shear rates (WSR) and wall shear stresses (WSS) for all the
0
1
2
3
4
5
6
7
5 6 7 8 9 10 11 12 13
Diameter D (µm)
PSVax(mm/s)
(a)
0
1
2
3
4
5
6
7
5 6 7 8 9 10 11 12 13
Diameter D (µm)
AVVax(mm/s)
(b)
0
1
2
3
4
5
6
7
5 6 7 8 9 10 11 12 13
Diameter D (µm)
EDVax(mm/s)
(c)
Fig. 2. Axial erythrocyte velocity (Vax) in relation to the diameter of the pre capillary
arterioles of the eye (from Koutsiaris et al., 2010). (a) peak systolic axial velocity
(PSVax), (b) average axial velocity (AVVax) and (c) end diastolic axial velocity
(EDVax) are shown in triangles, circles and crosses respectively.
36 A.G. Koutsiaris et al. / Microvascular Research 85 (2013) 34–39
4. microvessels are shown in Figs. 2–6 respectively. Peak systolic, averages
and end diastolic values are presented in parts (a), (b) and (c) of each of
the aforementioned figures respectively. So, peak systolic Vax (PSVax),
peak systolic Vs (PSVs), peak systolic Q (PSQ), peak systolic WSR
(PSWSR) and peak systolic WSS (PSWSS) are presented in Figs. 2(a),
3(a), 4(a), 5(a) and 6(a) respectively. Average Vax (AVVax), average Vs
(AVVs), average Q (AVQ), average WSR (AVWSR) and average
(AVWSS) are presented in Figs. 2(b), 3(b), 4(b), 5(b) and 6(b) respec-
tively. End diastolic Vax (EDVax), end diastolic Vs (EDVs), end diastolic
Q (EDQ), end diastolic WSR (EDWSR) and end diastolic WSS (EDWSS)
are presented in Figs. 2(c), 3(c), 4(c), 5(c) and 6(c) respectively.
PSVax ranged from 0.62 to 5.84 mm/s (Fig. 2a), PSVs from 0.55 to
4.95 mm/s (Fig. 3a), PSQ from 16 to 362 pl/s (Fig. 4a), PSWSR
from 733 to 6562 s−1
(Fig. 5a) and PSWSS from 2.1 to 39.4 N/m2
(Fig. 6a). The upper limit values of 6562 s−1
and 39.4 N/m2
are not
shown in the corresponding graphs for a better presentation of the
results but they were taken into account in the estimation of the
trend lines described in the following paragraphs.
The ranges of the aforementioned quantities are smaller for the av-
erage values throughout the cardiac cycle: 0.52–3.26 mm/s for AVVax
(Fig. 2b), 0.46–2.65 mm/s for AVVs (Fig. 3b), 13–202 pl/s for AVQ
(Fig. 4b), 587–3515 s−1
for AVWSR (Fig. 5b) and 1.7–21.1 N/m2
for
AVWSS (Fig. 6b).
EDVax ranged from 0.40 to 1.80 mm/s (Fig. 2c), EDVs from 0.35 to
1.51 mm/s (Fig. 3c), EDQ from 10 to 115 pl/s (Fig. 4c), EDWSR from
330 to 2004 s−1
(Fig. 5c) and EDWSS from 0.9 to 12.0 N/m2
(Fig. 6c).
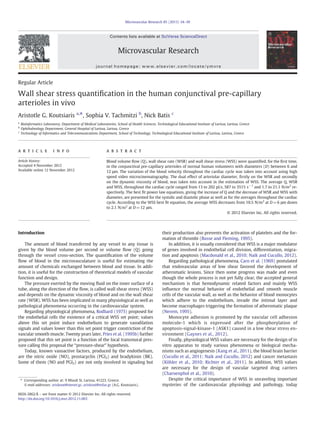
In all parts of Figs. 4–6 the best fit power law trend line equation
and the corresponding correlation coefficient (r) are shown. Using
these equations, the trends of volume flow, wall shear rate and
wall shear stress can be quantified for every diametric value between
6 and 12 μm. For example, the average Q throughout the cardiac
cycle (Fig. 4b) increases from 37 pl/s at D=6 μm up to 139 pl/s at
D=12 μm, the average WSR (Fig. 5b) decreases from 1752 s−1
at
D=6 μm down to 823 s−1
at D=12 μm and the average WSS
(Fig. 6b) decreases from 10.5 N/m2
at D=6 μm down to 2.1 N/m2
at D=12 μm.
0
1
2
3
4
5
6
5 6 7 8 9 10 11 12 13
Diameter D (µm)
PSVs(mm/s)
(a)
0
1
2
3
4
5
6
5 6 7 8 9 10 11 12 13
Diameter D (µm)
AVVs(mm/s)
(b)
0
1
2
3
4
5
6
5 6 7 8 9 10 11 12 13
Diameter D (µm)
EDVs(mm/s)
(c)
Fig. 3. Cross-sectional velocity (VS) in relation to the diameter of the pre-capillary ar-
terioles of the eye. (a) Peak systolic cross-sectional velocity (PSVs), (b) average
cross-sectional velocity (AVVs) and (c) end diastolic cross-sectional velocity (EDVs)
are shown in triangles, circles and crosses respectively.
PSQ = 1.85 D
1.88
r = 0.66
0
100
200
300
400
5 6 7 8 9 10 11 12 13
Diameter D (µm)
PSQ(pl/s)
(a)
AVQ = 1.21 D
1.91
r = 0.75
0
100
200
300
400
5 6 7 8 9 10 11 12 13
Diameter D (µm)
AVQ(pl/s)
(b)
(c)
EDQ = 0.89 D
1.84
r = 0.76
0
100
200
300
400
5 6 7 8 9 10 11 12 13
Diameter D (µm)
EDQ(pl/s)
Fig. 4. Volume flow (Q) in relation to the diameter of the pre capillary arterioles of the
eye. (a) Peak systolic volume flow (PSQ), (b) average volume flow (AVQ) and (c) end
diastolic volume flow (EDQ) are shown in triangles, circles and crosses respectively.
The best fit power law equation is shown in black line together with the correlation co-
efficient (r).
37A.G. Koutsiaris et al. / Microvascular Research 85 (2013) 34–39
5. In Figs. 2 and 3 there are no standard trend line best fits (linear,
logarithmic, power law or exponential) because the correlation coef-
ficient r was less than 0.16. It seems, in practice, there is no correla-
tion between velocity and diameter at least in the limited range of
the diameters examined here.
A histogram is shown in Fig. 7, where the frequencies of 7 different
groups of the AVVax are presented. The skewness and the kurtosis of
the frequency distribution were positive (+0.77 and +0.91, respec-
tively) but sufficiently low to consider the distribution as normal and
use the mean value and the standard deviation (SD). The mean axial
velocity of the average values of all the microvessels shown in circles
in Fig. 2b was: bAVVax>=1.66 mm/s±0.61 (SD) and the mean
cross-sectional velocity of the average values of all the microvessels
shown in circles in Fig. 3b was: bAVVs>=1.36 mm/s±0.51 (SD).
Discussion
The mean value of all average axial velocities shown in Fig. 2b
was 1.66 mm/s±0.6 (SD) which is almost identical to the mean of
1.6±0.5 mm/s from 14 rabbit mesentery precapillary arterioles
with diameters equal or less than 12 μm (Koutsiaris and Pogiatzi,
2004). It is a little lower than the mean of 2±1.7 mm/s from mea-
surements at rat mesenteric arterioles (Pries et al., 1995a) with an
average diameter of 13.2 μm which is higher in comparison to the
average of 8.5 μm in the present work.
Blood volume flow, wall shear rate and wall shear stress were
quantified for the first time in the pre-capillary microvasculature of
the bulbar conjunctiva of the human eye for diameters ranging
between 6 and 12 μm.
Volume flow and hematocrit are the primary physical quantities
for the correct estimation of the oxygen supply and WSS is necessary
PSWSR = 18820 D
-1.12
r = 0.47
0
1000
2000
3000
4000
5000
5 6 7 8 9 10 11 12 13
Diameter D (µm)
PSWSR(s-1)
(a)
AVWSR = 12352 D
-1.09
r = 0.54
0
1000
2000
3000
4000
5000
5 6 7 8 9 10 11 12 13
Diameter D (µm)
AVWSR(s-1)
(b)
EDWSR = 9083 D -1.16
r = 0.59
0
1000
2000
3000
4000
5000
5 6 7 8 9 10 11 12 13
Diameter D (µm)
EDWSR(s-1)
(c)
Fig. 5. Wall shear rate (WSR) in relation to the diameter of the pre capillary arterioles
of the eye. (a) Peak systolic wall shear rate (PSWSR), (b) average wall shear rate
(AVWSR) and (c) end diastolic wall shear rate (EDWSR) are shown in triangles, circles
and crosses respectively. The best fit power law equation is shown in black line togeth-
er with the correlation coefficient (r). The triangle (6 μm, 6562 s−1
) is not shown in
graph (a) for a better presentation of the results but it was taken into account in the
estimation of the best fit equation.
PSWSS = 1082 D -2.38
r = 0.75
0
5
10
15
20
25
5 6 7 8 9 10 11 12 13
Diameter D (µm)
PSWSS(N/m2)
(a)
AVWSS = 710 D
-2,35
r = 0.81
0
5
10
15
20
25
Diameter D (µm)
AVWSS(N/m2)
(b)
EDWSS = 522 D -2,41
r = 0.84
0
5
10
15
20
25
5 6 7 8 9 10 11 12 13
5 6 7 8 9 10 11 12 13
Diameter D (µm)
EDWSS(N/m2)
(c)
Fig. 6. Wall shear stress (WSS) in relation to the diameter of the pre capillary arterioles
of the eye. (a) Peak systolic wall shear stress (PSWSS), (b) average wall shear stress
(AVWSS) and (c) end diastolic wall shear stress (EDWSS) are shown in triangles, cir-
cles and crosses respectively. The best fit power law equation is shown in black line to-
gether with the correlation coefficient (r). The triangle (6 μm, 39.4 N/m2
) is not shown
in graph (a) for a better presentation of the results but it was taken into account in the
estimation of the best fit equation.
38 A.G. Koutsiaris et al. / Microvascular Research 85 (2013) 34–39
6. for the study of the morphological alterations of endothelial cells
(Κataoka et al., 1998) and of the corresponding genetic mechanisms.
As a consequence of its definition volume flow increases with in-
creasing diameter and as it is shown in Fig. 4b the relationship of
the average volume flow with the diameter can be approximated by
a 2nd power law relationship. This concurs with the results reported
for the human post capillary venules (Koutsiaris et al., 2007) and
departs from the 3rd power law proposed by Murray (1926).
In Figs. 5 and 6, it is shown that WSR and WSS decrease with in-
creasing diameter but WSS decreases at a much steeper gradient
than WSR and this is a consequence of the strong non linear nature
of the in vivo viscosity law. As a result, the AVWSS value given by
the trend line shown in Fig. 6b, is five times higher at D=6 μm
(10.5 N/m2
) compared to the value of 2.1 N/m2
at D=12 μm. The
AVWSR value given by the trend line shown in Fig. 5b on the other
hand is only 2.1 times higher at D=6 μm (1752 s−1
) in comparison
to the value of 823 N/m2
at D=12 μm.
The aforementioned range of AVWSS values coincides with the
range of values (3–10 N/m2
) reported from other animal tissues
(Lipowsky, 1995; Pries et al., 1995b). However, the AVWSS value at
D=6 μm is almost double than that expected by some authors
(Lipowsky, 1995) and more than 5 times higher than that expected
by other authors (Naik and Cucullo, 2012).
It seems also that the arteriolar trend line AVWSS values in the
human eye are approximately 3 times higher than the venular trend
line AVWSS values (Koutsiaris et al., 2007), in the corresponding di-
ameters. This concurs with results reported from other mammal tis-
sues (Lipowsky, 1995) and perhaps it correlates with differences in
the restrictive properties of the blood brain barrier among arterioles,
capillaries and venules (Macdonald et al., 2010).
In this work, volume flow, wall shear rate and wall shear stress
were quantified in the human pre-capillary arterioles of the conjunc-
tiva in relation to microvessel diameter taking into account the pulsa-
tion of arteriolar blood flow. The presented fitting results support a
2nd power law relation between average volume flow and diameter
values. In addition there is an approximately 5 fold increase of the
wall shear stress values as blood moves from the higher diameter
pre-capillary arterioles down to the smaller diameter capillaries in
the human bulbar conjunctiva. Finally, average wall shear stress
values in the pre-capillary arterioles are approximately 3 times higher
than those in the corresponding diameter post-capillary venules.
References
Busse, R., Fleming, I., 1995. Regulation of platelet function by flow-induced release of en-
dothelial autacoids. In: Bevan, J.A., Kaley, G., Rubanyi, G.M. (Eds.), Flow-dependent
regulation of vascular function. Oxford University Press Inc., New York, pp. 214–235.
Caro, C.G., Fitz-Gerald, J.M., Schroter, R.C., 1969. Arterial wall shear and distribution of
early atheroma in man. Nature 223, 1159–1160.
Charoenphol, P., Huang, R.B., Eniola-Adefeso, O., 2010. Potential role of size and hemo-
dynamics in the efficacy of vascular-targeted spherical drug carriers. Biomaterials
31, 1392–1402.
Cucullo, L., Hossain, M., Puvenna, V., Marchi, N., Janigro, D., 2011. The role of shear
stress in blood–brain barrier endothelial physiology. BMC Neurosci. 12, 11.
Gaynes, B., Teng, P.Y., Wanek, J., Shahidi, M., 2012. Feasibility of conjunctival hemody-
namic measurements in rabbits: reproducibility, validity and response to acute hy-
potension. Microcirculation 19, 521–529.
Kang, H., Kwak, H.I., Kaunas, R., Bayless, K.J., 2011. Fluid shear stress and sphingosine
1-phosphate activate calpaine to promote membrane type 1 matrix metalloproteinase
(MT1-MMP) membrane translocation and endothelial invasion into three-dimensional
collagen matrices. J. Biol. Chem. 286 (49), 42017–42026.
Köhler, S., Ulrich, S., Richter, U., Schumacher, U., 2010. E-/P-selectins and colon carci-
noma metastasis: first in vivo evidence for their crucial role in a clinically relevant
model of spontaneous metastasis formation in the lung. Br. J. Cancer 102,
602–609.
Koutsiaris, A.G., 2005. Volume flow estimation in the precapillary mesenteric micro-
vasculature in-vivo and the principle of constant pressure gradient. Biorheology
42, 479–491.
Koutsiaris, A., 2012. Digital micro PIV (μPIV) and velocity profiles in vitro and in vivo. In:
Cavazzini, G. (Ed.), Particle image velocimetry. InTech Inc., Rijeka, Croatia, pp. 283–318.
Koutsiaris, A.G., Pogiatzi, A., 2004. Velocity pulse measurements in the mesenteric arte-
rioles of rabbits. Physiol. Meas. 25, 15–25.
Koutsiaris, A.G., Tachmitzi, S.V., Batis, N., Kotoula, M.G., Karabatsas, C.H., Tsironi, E.,
Chatzoulis, D.Z., 2007. Volume flow and wall shear stress quantification in the
human conjunctival capillaries and post-capillary venules in-vivo. Biorheology 44
(5/6), 375–386.
Koutsiaris, A.G., Tachmitzi, S.V., Papavasileiou, P., Batis, N., Kotoula, M., Giannoukas,
A.D., Tsironi, E., 2010. Blood velocity pulse quantification in the human conjuncti-
val pre-capillary arterioles. Microvasc. Res. 80, 202–208.
Lipowsky, H.H., 1995. Shear stress in the circulation. In: Bevan, J.A., Kaley, G., Rubanyi,
G.M. (Eds.), Flow-dependent regulation of vascular function. Oxford University
Press Inc., New York, pp. 28–45.
Macdonald, J.A., Murugesan, N., Pachter, J.S., 2010. Endothelial cell heterogeneity of
blood–brain barrier gene expression along the celebral microvasculature.
J. Neurosci. Res. 88, 1457–1474.
Murray, C.D., 1926. The physiological principle of minimum work. I. The vascular sys-
tem and the cost of blood volume. Proc. Natl. Acad. Sci. U. S. A. 12, 207–214.
Naik, P., Cucullo, L., 2012. In vitro blood–brain barrier models: current and perspective
technologies. J. Pharm. Sci. 101 (4), 1337–1354.
Nerem, R., 1995. Atherosclerosis and the role of wall shear stress. In: Bevan, J.A., Kaley,
G., Rubanyi, G.M. (Eds.), Flow-dependent regulation of vascular function. Oxford
University Press Inc., New York, pp. 300–319.
Pries, A.R., Secomb, T.W., Geßner, T., Sperandio, M.B., Gross, J.F., Gaehtgens, P., 1994.
Resistance to blood flow in microvessels in vivo. Circ. Res. 75, 904–915.
Pries, A.R., Secomb, T.W., Gaehtgens, P., 1995a. Structure and hemodynamics of microvas-
cular networks: heterogeneity and correlations. Am. J. Physiol. 269, H1713–H1722.
Pries, A.R., Secomb, T.W., Gaehtgens, P., 1995b. Design Principles of Vascular Beds. Circ.
Res. 77, 1017–1023.
Richter, U., Schröder, C., Wicklein, D., Lange, T., Geleff, S., Dippel, V., Schumacher, U.,
Klutmann, S., 2011. Adhesion of small cell lung cancer cells to E- and P- Selectin
under physiological flow conditions: implications for metastasis formation.
Histochem. Cell Biol. 135, 499–512.
Rodbard, S., 1975. Vascular Caliber. Cardiology 60, 4–49.
Κataoka, N., Ujita, S., Kimura, K., Sato, M., 1998. Effect of flow direction on the morpholog-
ical responses of cultured bovine aortic endothelial cells. Med. Biol. Eng. Comput. 36,
122–128.
0
2
4
6
8
10
12
0.52 1.04 1.56 2.08 2.60 3.12 3.64
AVVax (mm/s)
Frequency
Fig. 7. A histogram of the average axial velocities (AVVax) shown in Fig. 2b. AVVax data
were categorized in 7 groups.
39A.G. Koutsiaris et al. / Microvascular Research 85 (2013) 34–39