

Recomendados
Recomendados
Mais conteúdo relacionado
Mais procurados
Mais procurados (20)
Destaque
Destaque (17)
Semelhante a MCX Commodity Technical Levels For 26 Feb 2013
Semelhante a MCX Commodity Technical Levels For 26 Feb 2013 (11)
Mais de Keynote Capitals Ltd.
Mais de Keynote Capitals Ltd. (20)
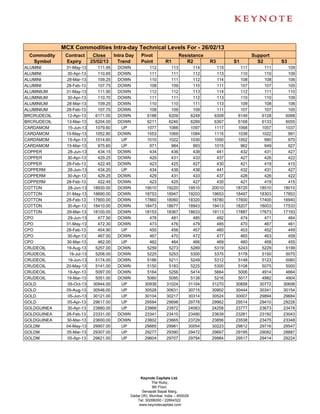
MCX Commodity Technical Levels For 26 Feb 2013
- 1. MCX Commodities Intra-day Technical Levels For - 26/02/13 Commodity Contract Close Intra Day Pivot Resistance Support Symbol Expiry 25/02/13 Trend Point R1 R2 R3 S1 S2 S3 ALUMINI 31-May-13 111.95 DOWN 112 113 114 115 111 111 109 ALUMINI 30-Apr-13 110.65 DOWN 111 111 112 113 110 110 109 ALUMINI 28-Mar-13 109.25 DOWN 110 111 112 114 108 108 106 ALUMINI 28-Feb-13 107.75 DOWN 108 109 110 111 107 107 105 ALUMINIUM 31-May-13 111.90 DOWN 112 112 113 114 112 111 110 ALUMINIUM 30-Apr-13 110.70 DOWN 111 111 112 113 110 110 109 ALUMINIUM 28-Mar-13 109.25 DOWN 110 110 111 113 109 108 106 ALUMINIUM 28-Feb-13 107.70 DOWN 108 109 109 111 107 107 105 BRCRUDEOIL 12-Apr-13 6171.00 DOWN 6188 6209 6248 6308 6149 6128 6068 BRCRUDEOIL 13-Mar-13 6204.00 DOWN 6211 6246 6289 6367 6168 6133 6055 CARDAMOM 15-Jun-13 1079.60 UP 1077 1088 1097 1117 1068 1057 1037 CARDAMOM 15-May-13 1052.80 DOWN 1053 1069 1084 1115 1038 1022 991 CARDAMOM 15-Apr-13 1014.60 UP 1010 1022 1030 1050 1002 990 970 CARDAMOM 15-Mar-13 975.60 UP 971 984 993 1015 962 949 927 COPPER 28-Jun-13 434.15 DOWN 434 436 438 441 432 431 427 COPPER 30-Apr-13 429.25 DOWN 429 431 433 437 427 426 422 COPPER 28-Feb-13 422.45 DOWN 423 425 427 430 421 419 415 COPPERM 28-Jun-13 434.20 UP 434 436 438 441 432 431 427 COPPERM 30-Apr-13 429.25 DOWN 429 431 433 437 428 426 422 COPPERM 28-Feb-13 422.45 DOWN 423 425 427 430 421 419 415 COTTON 28-Jun-13 18930.00 DOWN 19010 19220 19510 20010 18720 18510 18010 COTTON 31-May-13 18690.00 DOWN 18753 18947 19203 19653 18497 18303 17853 COTTON 28-Feb-13 17800.00 DOWN 17860 18060 18320 18780 17600 17400 16940 COTTON 30-Apr-13 18410.00 DOWN 18473 18677 18943 19413 18207 18003 17533 COTTON 29-Mar-13 18100.00 DOWN 18153 18367 18633 19113 17887 17673 17193 CPO 29-Jun-13 477.50 DOWN 478 481 485 492 474 471 464 CPO 31-May-13 472.30 DOWN 473 476 479 485 470 467 461 CPO 28-Feb-13 454.90 UP 455 456 457 460 453 452 449 CPO 30-Apr-13 467.00 DOWN 467 470 472 477 465 463 458 CPO 30-Mar-13 462.00 UP 462 464 466 469 460 458 455 CRUDEOIL 19-Aug-13 5257.00 DOWN 5259 5273 5289 5319 5243 5229 5199 CRUDEOIL 19-Jul-13 5206.00 DOWN 5225 5253 5300 5375 5178 5150 5075 CRUDEOIL 19-Jun-13 5174.00 DOWN 5186 5211 5249 5312 5148 5123 5060 CRUDEOIL 20-May-13 5141.00 DOWN 5150 5183 5225 5300 5108 5075 5000 CRUDEOIL 19-Apr-13 5097.00 DOWN 5164 5256 5414 5664 5006 4914 4664 CRUDEOIL 19-Mar-13 5051.00 DOWN 5060 5095 5138 5216 5017 4982 4904 GOLD 05-Oct-13 30944.00 UP 30938 31024 31104 31270 30858 30772 30606 GOLD 05-Aug-13 30546.00 UP 30528 30631 30715 30902 30444 30341 30154 GOLD 05-Jun-13 30121.00 UP 30104 30217 30314 30524 30007 29894 29684 GOLD 05-Apr-13 29617.00 UP 29594 29698 29778 29962 29514 29410 29226 GOLDGUINEA 30-Apr-13 23880.00 UP 23868 23972 24063 24258 23777 23673 23478 GOLDGUINEA 28-Feb-13 23331.00 DOWN 23341 23410 23490 23639 23261 23192 23043 GOLDGUINEA 30-Mar-13 23600.00 DOWN 23602 23665 23729 23856 23538 23475 23348 GOLDM 04-May-13 29907.00 UP 29885 29981 30054 30223 29812 29716 29547 GOLDM 05-Mar-13 29307.00 UP 29277 29390 29472 29667 29195 29082 28887 GOLDM 05-Apr-13 29621.00 UP 29604 29707 29794 29984 29517 29414 29224 Keynote Capitals Ltd. The Ruby, 9th Floor, Senapati Bapat Marg, Dadar (W), Mumbai, India – 400028 Tel: 30266000 / 22694322 www.keynotecapitals.com
- 2. MCX Commodities Intra-day Technical Levels For - 26/02/13 Commodity Contract Close Intra Day Pivot Resistance Support Symbol Expiry 25/02/13 Trend Point R1 R2 R3 S1 S2 S3 GOLDPETAL 30-Apr-13 2984.00 DOWN 2985 2994 3005 3025 2974 2965 2945 GOLDPETAL 28-Feb-13 2921.00 UP 2920 2929 2936 2952 2913 2904 2888 GOLDPETAL 30-Mar-13 2953.00 UP 2952 2960 2967 2982 2945 2937 2922 GOLDPTLDEL 30-Mar-13 2971.00 UP 2970 2981 2992 3014 2959 2948 2926 GOLDPTLDEL 30-Apr-13 2980.00 DOWN 2989 3000 3021 3053 2968 2957 2925 GOLDPTLDEL 28-Feb-13 2927.00 DOWN 2933 2944 2962 2991 2915 2904 2875 KAPAS 30-Mar-13 934.60 DOWN 949 966 998 1048 917 899 849 KAPAS 30-Apr-13 981.50 DOWN 994 1013 1045 1095 963 944 894 KAPASKHALI 31-May-13 1458.50 UP 1458 1473 1487 1515 1444 1430 1401 KAPASKHALI 28-Feb-13 1370.50 DOWN 1372 1382 1394 1416 1360 1350 1328 KAPASKHALI 30-Apr-13 1433.00 UP 1431 1448 1462 1493 1417 1400 1369 KAPASKHALI 30-Mar-13 1400.00 UP 1400 1415 1429 1459 1385 1370 1341 LEAD 31-May-13 124.80 DOWN 125 125 126 127 124 124 123 LEAD 30-Apr-13 124.65 DOWN 125 126 126 128 124 123 122 LEAD 28-Mar-13 124.20 DOWN 125 125 126 128 124 123 121 LEAD 28-Feb-13 123.80 DOWN 124 125 126 127 123 122 121 LEADMINI 31-May-13 124.70 DOWN 125 125 126 127 124 124 123 LEADMINI 30-Apr-13 124.55 DOWN 125 126 127 130 124 123 121 LEADMINI 28-Mar-13 124.20 DOWN 125 125 126 128 124 123 121 LEADMINI 28-Feb-13 123.80 DOWN 124 125 126 127 123 122 121 MENTHAOIL 31-May-13 1163.40 UP 1160 1171 1179 1197 1153 1142 1124 MENTHAOIL 30-Apr-13 1222.70 DOWN 1229 1242 1261 1293 1210 1197 1165 MENTHAOIL 28-Feb-13 1527.40 DOWN 1531 1582 1636 1741 1477 1426 1321 MENTHAOIL 30-Mar-13 1256.00 DOWN 1269 1287 1319 1368 1237 1219 1169 NATURALGAS 25-Apr-13 191.90 UP 190 194 196 202 188 184 179 NATURALGAS 25-Mar-13 187.90 UP 186 190 192 198 184 180 174 NATURALGAS 25-Feb-13 183.90 UP 182 187 190 197 180 175 168 NICKEL 31-May-13 922.30 DOWN 924 929 935 946 918 914 903 NICKEL 30-Apr-13 913.70 DOWN 918 924 933 949 908 903 888 NICKEL 28-Mar-13 906.30 DOWN 914 923 939 964 898 889 864 NICKEL 28-Feb-13 899.10 DOWN 904 911 922 940 893 886 868 NICKELM 31-May-13 922.70 DOWN 926 931 939 952 918 913 899 NICKELM 30-Apr-13 914.00 DOWN 919 925 935 951 908 903 886 NICKELM 28-Mar-13 906.50 DOWN 911 917 928 944 901 895 878 NICKELM 28-Feb-13 899.10 DOWN 905 913 928 951 891 882 859 POTATO 15-Apr-13 792.00 DOWN 802 811 830 859 782 773 744 POTATO 15-May-13 790.20 DOWN 799 809 827 855 781 772 744 POTATO 15-Mar-13 808.60 DOWN 819 829 850 880 798 788 757 SILVER 05-Jul-13 56671.00 UP 56602 56968 57265 57928 56305 55939 55276 SILVER 04-May-13 55380.00 UP 55307 55669 55958 56609 55018 54656 54005 SILVER 05-Mar-13 53972.00 UP 53891 54271 54569 55247 53593 53213 52535 SILVER1000 30-Mar-13 54484.00 DOWN 54511 54972 55459 56407 54024 53563 52615 SILVER1000 30-Apr-13 54575.00 DOWN 54578 55057 55539 56500 54096 53617 52656 SILVER1000 28-Feb-13 53542.00 UP 53111 54071 54601 56091 52581 51621 50131 SILVERM 29-Jun-13 56711.00 UP 56615 56996 57280 57945 56331 55950 55285 SILVERM 30-Apr-13 55412.00 UP 55337 55705 55998 56659 55044 54676 54015 SILVERM 28-Feb-13 53983.00 UP 53899 54284 54586 55273 53597 53212 52525 SILVERMIC 29-Jun-13 56716.00 UP 56623 56996 57276 57929 56343 55970 55317 SILVERMIC 30-Apr-13 55415.00 UP 55346 55704 55993 56640 55057 54699 54052 SILVERMIC 28-Feb-13 53982.00 UP 53900 54281 54579 55258 53602 53221 52542 Keynote Capitals Ltd. The Ruby, 9th Floor, Senapati Bapat Marg, Dadar (W), Mumbai, India – 400028 Tel: 30266000 / 22694322 www.keynotecapitals.com
- 3. MCX Commodities Intra-day Technical Levels For - 26/02/13 Commodity Contract Close Intra Day Pivot Resistance Support Symbol Expiry 25/02/13 Trend Point R1 R2 R3 S1 S2 S3 STEELRPR 20-May-13 31630.00 DOWN 31680 31800 31970 32260 31510 31390 31100 STEELRPR 18-Apr-13 31110.00 UP 31103 31307 31503 31903 30907 30703 30303 STEELRPR 20-Mar-13 30700.00 DOWN 30707 30863 31027 31347 30543 30387 30067 ZINC 31-May-13 114.05 UP 114 114 115 116 114 113 112 ZINC 30-Apr-13 113.50 UP 113 114 114 115 113 112 111 ZINC 28-Mar-13 112.90 UP 113 113 114 115 112 112 110 ZINC 28-Feb-13 112.40 UP 112 113 113 115 112 111 110 ZINCMINI 31-May-13 114.00 DOWN 114 115 115 117 113 113 111 ZINCMINI 30-Apr-13 113.55 UP 114 114 115 116 113 112 111 ZINCMINI 28-Mar-13 112.85 UP 113 113 114 115 112 111 110 ZINCMINI 28-Feb-13 112.35 UP 112 113 113 115 111 111 109 Sanjay Bhatia (AVP – Technical Research), Email Id sanjay@keynotecapitals.net Pivot Point: Intra- Day Trading Tool. - The key to the use of this tool is the use of Stop Loss Intra Day Trend: It is valid only till the point where Price trades above Pivot Point. For Eg. “UP” would be valid till Price remains above Pivot Point. It would become “DOWN” in event Price trades below Pivot Point. Pivot Point (PP): This is a trigger point for Intra Day Buy / Sell based on the price range of the previous day. R1: Resistance 1: 1st Resistance level over Pivot Point, R2: Resistance 2: Next Resistance level after R1. R3: Resistance 3: Next Resistance level after R2. S1: Support 1: 1st Support level after Pivot Point, S2: Support 2: Next Support level after S1. S3: Support 3: Next Support level after S2. Note: As per this tool, the trader should take BUY position just above the Pivot Point and keep the Pivot Point level as stop loss and the first target would be R1 level (Resistance 1). If R1 is crossed then R2 (Resistance 2) becomes the next target with the stop loss placed at R1 level. If R2 is crossed then R3 (Resistance 3) becomes the next target with the stop loss placed at R2 level. Similarly if price goes below the Pivot Point the trader should take a SELL position and keep the Pivot Point level as the stop loss and the first target would be S1 level (Support 1). If S1 level is breached then S2 level (Support 2) becomes the next target with the stop loss placed at S1 level. If S2 level is breached then S3 level (Support 3) becomes the next target with the stop loss placed at S2 level. Disclaimer: This document is not for public distribution and has been furnished to you solely for your information and must not be reproduced or redistributed to any other person. Persons into whose possession this document may come are required to observe these restrictions. This material is for the personal information of the authorized recipient, and we are not soliciting any action based upon it. This report is not to be construed as an offer to sell or the solicitation of an offer to buy any security in any jurisdiction where such an offer or solicitation would be illegal. It is for the general information of clients of Keynote Capitals Ltd. It does not constitute a personal recommendation or take into account the particular investment objectives, financial situations, or needs of individual clients. We have reviewed the report, and in so far as it includes current or historical information, it is believed to be reliable though its accuracy or completeness cannot be guaranteed. Neither Keynote Capitals Ltd., nor any person connected with it, accepts any liability arising from the use of this document. The recipients of this material should rely on their own investigations and take their own professional advice. Price and value of the investments referred to in this material may go up or down. Past performance is not a guide for future performance. Certain transactions - including those involving futures, options and other derivatives as well as non-investment grade securities - involve substantial risk and are not suitable for all investors. Reports based on technical analysis centers on studying charts of a stock’s price movement and trading volume, as opposed to focusing on a company’s fundamentals and as such, may not match with a report on a company’s fundamentals. Opinions expressed are our current opinions as of the date appearing on this material only. While we endeavor to update on a reasonable basis the information discussed in this material, there may be regulatory, compliance, or other reasons that prevent us from doing so. Prospective investors and others are cautioned that any forward-looking statements are not predictions and may be subject to change without notice. Our proprietary trading and investment businesses may make investment decisions that are inconsistent with the recommendations expressed herein. We and our affiliates, officers, directors, and employees world wide may: (a) from time to time, have long or short positions in, and buy or sell the securities thereof, of company (ies) mentioned herein or (b) be engaged in any other transaction involving such securities and earn brokerage or other compensation or act as a market maker in the financial instruments of the company (ies) discussed herein or act as advisor or lender / borrower to such company (ies) or have other potential conflict of interest with respect to any recommendation and related information and opinions. The analyst for this report certifies that all of the views expressed in this report accurately reflect his or her personal views about the subject company or companies and its or their securities, and no part of his or her compensation was, is or will be, directly or indirectly related to specific recommendations or views expressed in this report. No part of this material may be duplicated in any form and/or redistributed without Keynote Capitals Ltd’s., prior written consent. Keynote Capitals Ltd. The Ruby, 9th Floor, Senapati Bapat Marg, Dadar (W), Mumbai, India – 400028 Tel: 30266000 / 22694322 www.keynotecapitals.com