SlideShare a Scribd company logo
1 of 32
Download to read offline
1
A meta-regression analysis of frontier efficiency estimates from Africa
Kolawole OGUNDARI1
Dept. of Agricultural and Resource Economics,
Kyushu University, Fukuoka, Japan.
Selected Paper prepared for presentation at the Agricultural & Applied Economics Association’s
2014 AAEA Annual Meeting, Minneapolis, Minnesota, 27-29 June 2014
Copyright 2014 by Kolawole Ogundari. All rights reserved. Readers may make verbatim copies of
this document for non-commercial purposes by any means, provided that this copyright notice appears
on all such copies.
1
Email: ogundarikolawole@daad-alumni.de
Acknowledgement
The author gratefully acknowledge the financial support of the JSPS towards his postdoctoral fellowship at
Kyushu University, Fukuoka and also for providing research grant with ID No. 24-02406.
2
A meta-regression analysis of frontier efficiency estimates from Africa
The most valuable of all capital is investment in human beings
–Alfred Marshal, 1920
Abstract(
The study investigates whether African agricultural efficiency levels has been improving or
not and what drives its over the years based on 442 frontier studies using meta-regression
analysis. The results show that mean efficiency estimates from studies decrease significantly
as year of survey in the primary study increases. Also studies published in Journals, with
parametric specification and with panel data produced significantly higher efficiency
estimates, while those with a focus on grain crops reported significantly lower efficiency
estimates. Other results show that education, followed by experience; extension and credit are
the major drivers of agricultural efficiency levels in Africa.
Keywords: Agriculture, efficiency, meta-analysis, food security, fractional regression, Africa
JEL Classification: C13, Q12, Q18
1.0 Introduction
Agriculture remains the main trust of many countries in Africa, as the principal source of food
and livelihood, making it a critical component of programs that seek to reduce poverty and
attain food security in the continent. But in recent years, food insecurity has become a serious
concern in Africa, especially in sub-Saharan Africa (SSA), which is reminiscent of the same
issue in Asia for decades earlier (Otsuka, 2013). And, key to boosting food security in the
region cannot be divorced from agricultural total factor productivity (TFP) growth. As noted
by Brümmer (2006), improvement in the efficiency levels of agriculture and food production
has always been identified as a major component of total factor productivity (TFP) growth
that needs to be explored to effectively address food insecurity problem in the developing
economies.
Although, no country has successfully reduced poverty and food insecurity through
agriculture alone as institutional and industrial development are often needed, but almost none
has achieved it without first increasing its level of agricultural productivity and efficiency
(POSTnote, 2006). In other words, the study of agricultural efficiency is important to all
economies, developed and developing. And, this underscores why analysis of efficiency in
agriculture and food production and the role of efficiency in increasing agriculture and food
3
production, has received particular attention by researchers and policy makers alike as an
important input for better informed policy decisions around the globe (Thiam et al., 2001;
Ogundari et al., 2012).
According to Gallup et al., (1997), increase in efficiency and productivity of agricultural
enterprises is likely to enhance smallholder (or subsistence) farmers opportunities to produce
more, which in turn could lead to increase in their food security and income levels. This is
because improvement in agricultural efficiency levels provide opportunities for farmers to
produce more at same level of resources, while productivity and efficiency affect agriculture
and food production directly by increasing the available supply of food and indirectly by
increasing household income. For example, study by Gallup et al., (1997) has shown that 1%
rise in per capita agricultural output (or TFP growth) could led to a 1.6% rise in income of the
poorest. Likewise, Martin (2013) argues that the poverty impact of increase in agricultural
productivity growth is much larger than for industry or services sector.
The popularity of frontier efficiency studies in the last three decades has received attention
among researchers and policy analysts and this is evidenced by the proliferation of the
methodology and its application across the globe (Thiam et al., 2001). That said, recent
empirical findings by Thiam et al., (2001), Bravo-Ureta et al., (2007) and Ogundari and
Brümmer (2011) have shown that mean efficiency estimates of agricultural and food
production reported in the primary study differ across many study attributes (or dimensions)
such as methodology, data type, model specification, and location among others.
In addition, two recent cross-country analyses of agricultural productivity growth in Africa
based on FAOSTAT data by Alene (2010) and Yu and Nin-Pratty (2011) uncover evidence
that change in efficiency levels contributed negatively to the growth of the sector over the
years. This implies that decline in efficiency levels is the main cause of poor TFP growth in
African agriculture and food production, while both studies also identified technical progress
(technological change) as main driver of agricultural TFP growth in the region. This
observation however, strongly contradicts Fugile and Wang’s (2012) argument that the future
challenge to the global food security as in the past do not appear to be related to technical
constraints, but rather to uneven access to resources (i.e., poor resource use efficiency level).
Furthermore, recent study by Ogundari (2013) has shown that there are substantial number of
efficiency studies that have been used to raise policy debates on the performance of African
4
agriculture and food production over the years. That said, it will be interesting to understand
what literature reveal about the trends (or development) in African agricultural efficiency
levels and what drives the efficiency levels over the years as an important input in agricultural
policy decisions in the region. In other words, could similar findings obtained from existing
cross-country studies on agricultural productivity be distilled from synthesized literature on
efficiency of African agriculture over the years? As reveal by Ogundari et al., (2012),
lessons/policy implications drawn from previous studies on agriculture and food production,
could be very useful as guides to agricultural policymakers in designing effective food
security program. Thus, arising from the foregoing, the present study addresses the following
research questions:
RQ1. How did the relationship between reported mean efficiency estimates and year
of survey from the selected case studies develop (i.e., rise or decline) over the
years?
RQ2. Are there differences in reported mean efficiency estimates to a set of study-
specific attributes such as methodology used, model specification, publication
outlet, data type, location etc.?
RQ3. What factors (policy variables) have driven agricultural efficiency levels as
identified from the selected case studies over the years?
The present study builds on the earlier works by Thiam et al., (2001), Bravo-Ureta et al.,
(2007), and Ogundari and Brümmer (2011) that utilized meta-analysis to investigate how
mean efficiency scores from the primary study on agriculture and food production differ
across study attributes such as methodology used, data type, model specification etc. While
Thiam et al., (2001) focused on farm level efficiency estimates from the developing
agriculture with 2 studies from Africa, Bravo-Ureta et al., (2007) examined efficiency
estimates from both the developing and developed agriculture with 14 studies from Africa,
and Ogundari and Brümmer (2011) focused exclusively on efficiency estimates from Nigeria
with 124 studies involved.
To sum up, the present study contributes to existing literature in threefold. First, unlike
previous studies that include few numbers of observations from Africa, the present study
focuses exclusively on efficiency estimates from Africa with broader geographical coverage
that would produce a better understanding of the link between efficiency estimates in African
5
agriculture and attributes of studies reporting these estimates in the region. Second, unlike
previous studies that uses Tobit, OLS and truncated regressions, believed to yield biased
result as argued by McDonald (2009) and Ramaiho et al., (2011), the current study makes a
significant contribution in terms of methodology employed by using fractional regression
model for the meta-regression analysis (MRA). Three, unlike previous studies with exception
of Ogundari and Brümmer (2011), we extended our discussion to include drivers of
agricultural efficiency level over the years in Africa.
The paper is structured as follows. The next section provides overviews of frontier efficiency
and meta-analysis. Section three provides detailed description of the meta-dataset used for
the analysis. In section four, meta-regression model specification is provided. Section five
presents the results and discussion, while conclusions are provided in section six.
2.0 An overview of frontier efficiency and meta-analysis
2.1. An overview of frontier efficiency
Efficiency is refers to how well a system or unit of production performs in the use of
resources to produce outputs, given available technology relative to a standard (frontier)
production (Fried, 2008). In this regard, efficiency of decision-making units (DMU) can be
represented by technical efficiency, especially when primal technology specification is
employed to model the performance of the production unit. Given this, the body of literature
on the performance of farms examined how farmers have been using resources efficiently to
produce maximum output by applying best technology and managerial practices (known as
technical efficiency). Alternatively, it could be allocative efficiency/economic (cost)
efficiency or profit efficiency when dual technology specification is considered, depending on
the underlying behavioral assumption of cost minimization or profit maximization,
respectively that is made to describe the performance of the production unit. In this case,
literature examined how much costs can be reduced if the combination of inputs is optimal
according to prices (known as allocative efficiency) and or if farms are operating at the
optimal size that guarantee production at the minimum cost (known as economic or cost
6
efficiency)2
, while profit efficiency is view as the highest possible profit achieve by DMU
relative to the frontier profit, given the optimum combination of output and factor prices.3
Economic theory offers numerous procedures for evaluating efficiency of a DMU (Hoff,
2007). Nevertheless, the methodologies employ in estimating efficiency level of agriculture
and food production has evolved over the years. This however, ranges from when simple
indexing method and mathematical programming (or non-parametric method-Data
Envelopment Analysis-DEA) was used, use of simple and sophisticated econometrics (or
parametric method such a stochastic frontier analysis-SFA), introduction of theoretically
consistent functional forms, introduction of dynamic and spatial econometrics and systems of
equations, use of multi-output technology estimation to the introduction of meta-frontier
technology among others (for detail discussion see, Kumbhakar and Lovell, 2000 and Coelli
et al., 2005). 4
Another major extension in efficiency measurement is recent advances in panel data
methodologies, which led to the incorporation of efficiency into TFP growth decomposition
process similar to the Solow Growth model. As noted by Thiam et al., (2001), a major feature
of panel data is the ability to decompose TFP growth into technical change or technological
change (i.e., pushing out production frontier) and efficiency change (i.e., movement of
frontier, which could be catching up or lagging behind the production frontier) and until lately
into scale efficiency change (change in variety of inputs available), allocative efficiency
change in inputs and output and mix- efficiency change (Kumbhakar and Lovell 2000;
O’Donnell 2010). This decomposition makes it possible to study the sources of TFP growth
from different points of view (Nishimizu and Page, 1982) and this is very useful for designing
agricultural policy program.
Generally speaking, frontier efficiency model does not only serve as a benchmark, which
efficiency levels of DMU are estimated, but it is also very useful in identifying determinants
of efficiency levels for policy inference (Kumbhakar and Lovell, 2000). In this case, the
approach used to incorporate the determinants of efficiency into frontier model has evolved
over the years from two-stage approach to one stage approach that enables joint estimation of
2
Economic efficiency can also be defined as the product of technical and allocative efficiencies.
3
As noted by Thiam et al., (2001), the primal approach or direct estimation of the production function has been the more
common route used for frontier estimation in the economic literature.
4
A major assumption underlying frontier models is that all firms have access to the same production technologies.
Unfortunately, in practice some firms have access to different technologies. However, the use of meta-frontier model relaxes
this assumption to allow firms of different technologies to be compared.
7
efficiency and its determinants (Kumbhakar and Lovell, 2000; Coelli., et al 2005). Even
within the one stage approach, the methodology has also evolved from when mean of the pre-
truncated distribution of the inefficiency error term is model as a function of exogenous
variable that represents determinants of efficiency levels to when variance of the pre-
truncated inefficiency error term is model as a function of exogenous variables. The later is
believed to have possibility of solving two problems at once, namely to correct for
heteroskedasticity in the inefficiency error terms, while incorporating exogenous variables to
investigate inefficiency effects in the production process.
A search of literature however, shows that a number of studies have provided historical
review of agricultural efficiency literature over the years. Some of these studies include
Battese (1992), Bravo-Ureta and Pinheiro (1993), Ogundari et al., (2012) and Darkn et al.,
(2013). The conclusions from these studies highlight the efforts that have been devoted to
measuring efficiency in agriculture using different frontier methods and models over the years.
In addition, the general conclusion from many of these studies show that efficiency estimates
differ across many dimensions associated with study attributes such as methodology used,
data type: cross-sectional vs. panel data, functional forms, products, sample size, geographical
location and many more. This observation motivated the application of meta-analysis to
investigate whether agricultural efficiency estimates from the primary studies differ across
these dimensions as noted by Thiam et al., (2001), Bravo-Ureta et al., (2007) and Ogundari
and Brümmer (2011).
2.2. An overview of meta-analysis
Meta-analysis (MA) allows researchers to combine results of several homogenous studies into
a unified analysis that provides an overall estimate of interest for further discussion (Sterne,
2009). It provides the same methodological rigor to a qualitative review. A general model of
carrying out MA is the use of regression techniques. Meta-regression analysis (MRA) is
defined as a quantitative method used to evaluate the effect of methodological and other
study-specific characteristics on published empirical estimates of some indicators (Alston et
al. 2000). With reference to the present study, mean efficiency estimates (which could be
technical, allocative, economic (cost), or profit efficiency) from the primary study is treated as
dependent variable, while study attributes such as year of data collection (or year of survey) in
8
the primary study, model specification, methodology, data type etc. are taken as explanatory
variables.
Although, MA is quite popular in medical, education, pharmaceutical, and marketing
researches as noted by Thiam et al., (2001), a review of the literature however, shows that
MA has also been extended to a wide range of results in economic research other than
agricultural efficiency and productivity mentioned above in recent time. This includes effect
of immigration on wages (Longhi et al., 2005), income and calorie intake (Ogundari and
Abdulai, 2013), income inequality and economic growth (de Dominicis et al., 2008), effect of
aid on economic growth (Mekasha and Tarp, 2013), energy consumption and economic
growth (Chen et al., 2012), effect of currency unions on trade (Havranek, 2010), price and
income elasticity of demand for meat (Gallet 2010a,b), price and income elasticity of demand
for alcohol (Gallet, 2007), income elasticity of demand for cigarette (Gallet and List 2003),
exchange rate volatility and trade (Josheski and Lazarov, 2012), debt and economic growth
(Moore and Thomas, 2010), Willingness to pay for reduction in pesticide risk exposure
(Florax et al., 2005) and many more.
3.0 The Meta-Dataset
Meta-analysis requires a thorough search of literature that provides a complete description of
study specific characteristics or attributes of interest for the MRA. To this end, a variety of
sources were used to compile the selected case studies in the present study, which include
personal communication with the authors, economic database such as web of science, Google
scholar, AgEcons and ASCI Index and a host of other online database using relevant
keywords. In addition, we consulted PhD dissertation and Masters Thesis from website of
various Universities. The criteria used in selecting studies for the current analysis was that the
study reports mean efficiency estimates, data year or year of survey, and sample size. Based
on this, we selected 442 frontier studies for the current analysis. Because some of the
retrieved studies reported more than one efficiency estimates, a total 612 farm level efficiency
estimates were use for the MRA in the present study.5
The selected studies cut across the
entire region in Africa namely West Africa, East Africa, Central Africa, Southern Africa and
Northern Africa with a total of 30 countries represented in the meta-dataset.
5
The number of selected literature is not an exhaustive case study, nevertheless is a
representative list of frontier literature in the region.
9
That said, an overview of the database shows that the number of farm level efficiency
estimates (or frontier studies) obtained across the West Africa, East Africa, Central Africa,
Southern Africa, and North Africa regions are 418 (314), 114 (78), 12 (5), 43 (27), and 25
(18), respectively. This perhaps shows that the substantial number of studies on the
performance of Africa agriculture focus their research interest on the efficiency of agricultural
and food production in West Africa region. In addition, we uncover evidence that the selected
studies covered a range of products starting from grain crops such as maize, rice etc., tubers
such as cassava, yam, cocoyam, potatoes, cash crops (cocoa, coffee etc.) to non-crop products
such as egg production, poultry, livestock, fish etc.
Therefore, using previous studies by Thiele et al., (2001), Bravo-Ureta et al., (2007), and
Ogundari and Brümmer, (2011) as guides, we extracted and coded study specific attributes of
interest for the MRA is presented in Table 1. The summary statistics of the selected case
studies, detailed information regarding the authors, year of publication, the publication outlet
for the primary study, and the mean efficiency estimate reported can be requested from the
author. Because of space, this could not be included in the present paper.
4.0 The Meta-Regression Model and Empirical model
4.1 The Meta-Regression Model
To provide answers to the first and second research questions in the study, we use meta-
regression analysis (MRA). Below is the specification of the meta-regression model used in
the present study
EFF _ ESTir
=ψ0
+ βDATAYEARir
+ αk
Xkir
k=1
K
∑ + εir
; εir
 N 0,σε( ) (1)
where EFF _ ESTir
represents mean efficiency estimate(s) from the i-th primary study,
conducted in r-th region in Africa and ψ0
is intercept; DATAYEARir
is the average years of
survey used in the primary study, which starts from 1967, 1981, 1989, ….2012. This is
carefully constructed and included in equation 1 to investigate trends or development in
efficiency level of African agriculture and food production over the years. According to
Ogundari et al. (2012), it is possible to interpret the relationship between efficiency estimates
reported (i.e., EFF _ ESTir
) and the year of survey (i.e., DATAYEARir
) in primary studies as a
proxy indicator of efficiency change over time in absence of reliable panel data. Xkir
is a
vector of other study attributes also considered in MRA model as control variables, which
include D_ PANELDATA representing articles that used panel data (articles published with
10
cross section data served as reference); DF representing the degree of freedom in each study;
D_OUTPUT representing studies with non-aggregated output (studies with an aggregated
output served as reference); D_ JOURNAL representing articles published in Journals (articles
published in conference, working papers, and thesis/dissertation were taken as reference);
D_ IMPACTFACTOR representing articles published in top ranking journals with impact
factor; D_COBBDOUGLAS representing articles that employed Cobb Douglass functional
form (articles with other functional form and with no functional form served as reference);
D_TRANSLOG representing articles that employed Translog functional form (articles with
other functional form and with no functional form served as reference); D_ PARAMETRIC
representing articles that employed parametric method (articles with non-parametric method
served as reference); D_ PRIMAL representing articles that employed primal technology
(articles with dual technology served as reference); D_GRAIN representing studies that
focused on grain crops such as maize, rice etc. (articles with a focus on non-grains products
served as reference); D_ FOODCROP and D_CASHCROP represent studies with a focus on
food crops and cash crops, respectively (non-crop studies such as livestock, poultry, fish etc.
served as reference); D_ EAST , D_CENTRAL , D_ SOUTHERN , and D_ NORTH
represent articles published on countries in East Africa, Central Africa, Southern Africa, and
North Africa, respectively (articles published in countries in West Africa served as reference).
ψ0
,β , and αk
are parameters to be estimated and the sign of β and αk
will generally indicate
the direction in which a given variable influence changes in EFF _ ESTir
. While a positive
sign would indicate the variable having a positive effects on the EFF _ ESTir
, a negative sign
would suggest otherwise.6
εir
is the error term of the regression and is assumed to be normally
distributed with mean 0 and variance σε
.
Therefore, estimating any economic relationship from data requires assumptions about the
data generating process-DGP (Kumbhakar et al., 2013). In this regard, McDonald (2009) and
Ramaiho et al., (2010), argue that the DGP for EFF _ ESTir
is a fractional/proportional data
bounded between zero and 1 and not censored data by construction. Subsequently, the authors
argue that the use of linear models such as ordinary least square (OLS) and Tobit models may
not provide an accurate picture of the effects of explanatory variables on the dependent
6
With regards to the parameter of interest β - a positive sign would be taken as evidence of positive efficiency change in
African agriculture over the years, while a negative sign would suggest opposite.
11
variable of equation 1. For example, if the explanatory variables in equation 1 are used to
explain the dependent variable, the relationship must be bounded –otherwise, predicted
EFF _ ESTir
may be greater than one. In recognition of this, McDonald (2009) and Ramaiho
et al., (2010) proposed the use of Papke and Wooldridge’s (1996) fractional regression model
for the second stage analysis of the determinants of efficiency scores in the literature. Unlike
OLS and Tobit models, fractional regression model deals with dependent variable defined on
the unit interval, irrespective of whether boundary value of 0 or 1 is observed or not (Ramaiho
et al., 2010).
Intuitively, MRA of equation 1 is synonymous to investigating determinants of efficiency in
second stage of DEA efficiency analyses by using regression to relate efficiency estimates to
a number of factors seen to influence efficiency levels. These factors often include managerial
characteristics such as age, educational attainment, and experience of the producers or DMU,
and access to credit among others. Guided by this, the present study uses fractional regression
model to estimate the parameters of equation 1. As earlier mentioned, this is a departure from
previous studies on meta-analysis of efficiency studies on agriculture and food production that
employed OLS and Tobit regression models such as Thiam et al., (2001) and Bravo-Ureta et
al., (2007) and Truncated regression model by Ogundari and Brümmer (2011). The fractional
regression model is subsequently discussed below.
4.2. Empirical Model
Papke and Wooldridge (1996) highlight the drawbacks of linear models for fractional data
that are analogues to the drawbacks of the linear probability model for binary data. Likewise,
Kieschnick and McCullough (2003) argue that since fractional data are only observed over a
closed interval, it implies that the conditional expectation function will not be normally
distributed because they are not defined over ℜ , which is a domain over which the normal
distribution is defined. The authors therefore suggest that the use of linear models such as
average response function (OLS), censored regression (Tobit), or transformed logistic normal
model (e.g., the log-odds ratio of dependent variable) are inefficient as their error distributions
will be heteroskedastic, because their conditional variance will approach zero as their
conditional mean approaches either of their boundary points. 7
7
In this regards, the problem in using OLS on fractional dependent variable is that it is not asymptotically efficient estimator
but rather unbiased and consistent estimator.
12
The fractional response model is estimated using Quasi-Maximum Likelihood Estimation
(QMLE) method and is a non-linear model. QMLE is asymptotically efficient and consistent
compared to either OLS or Tobit or Truncated or transformed logistic normal often used by
researcher to handle DGP of this nature.
QMLE is one in which the variance of the observed data are known (up to a scale parameter)
functions of the means (Cox 1996). Papke and Wooldridge (1996) specify a quasi-likelihood
regression model for continuously measured proportions with a finite number of boundary
observations (i.e., 0s and 1s). It is robust to obtain an estimate of fractional response models
without ad hoc transformation of boundary values of the dataset. The authors used the
following Bernoulli Log-likelihood specification.
Li
β or α( )≡ yi
n G Zi( )( )+ 1− yi( )n 1− G Zi( )( ) (2)
where, 0 1iy≤ ≤ denotes the dependent variable equivalent to EFF _ EST in the present
study, while Zi
refers to the explanatory variables of observation i equivalent to DATAYEAR
and Xk
in the present study.
Accordingly, the specification above is well defined for0<G Zi( )<1. The QMLE of β or α
in equation 1 is obtained by simply maximizing equation 2 [that is., max
β or α
Li
β or α( )
l=1
N
∑ ].
Papke and Wooldridge concluded that Bernoulli QMLE β or α is consistent and N -
asymptotically normal regardless of the distribution of iy conditional on Zi
, while no special
data adjustments are needed for the extreme values of zero and one for iy . The conditional
expectation of iy given the explanatory variables according to the authors are estimated
directly. iy could be a continuous variable, a discrete variable, or have both continuous
variable and discrete characteristics.
Asymptotically efficient, unbiased and consistent estimator is achieved in QMLE by simply
transforming the G Zi( ) to produce models similar to either logit or probit in the binary
choice situation (McDonald, 2009). Cox (1996) and Papke and Wooldridge (1996) proposed
different specification for G Zi( ) such as logistic or probit distribution. However, Papke and
Wooldridge use logistic function for G Zi( ) within the framework of generalized linear
13
models (GLM) [that is.,G Zi( )=
exp Zi( )
1+ exp Zi( )
] which was extensively discussed in their paper
and implemented in STATA software used for the empirical analysis in this paper. 8
QMLE is estimated by weighted non-linear allowing for heteroskedasticity and testing
procedures, which are asymptotically efficient within a class of estimators (Oberhofor and
Pfaffermayer, 2009). 9
Therefore, the meta-QMLE regression employed for the empirical analysis is implicitly
specified below.
E EFF _ ESTir
Zi( )= G ψ0
+ βDATAYEARir
+ αk
Xkir
k=1
K
∑ + εir
⎛
⎝⎜
⎞
⎠⎟ t= 1967, … 2012 (3)
where, EFF _ ESTir
, DATAYEARir
, and Xkir
are as defined earlier and
Zi
= DATAYEARi
, Xki
⎡⎣ ⎤⎦
′ ; ( ).G is the logistic function.
Because many of the studies reported more than one efficiency estimates, Espey et al., (1997)
argue that lack of independence in the values of the dependent variable across observations is
one of the problem of meta-regression analysis (MRA), which likely to biased standard errors
of equation 3. That said, Nelson and Kennedy (2009) suggest the use of weighted regression
technique to eliminate lack of independence in the values of the dependent variable of MRA,
which Stanley (2008) also argue can potentially be use to lessen publication bias in MRA. In
addition, Stanley and Doucouliagos (2013) argue that weighted regression-MRA offers the
best of both fixed effect and random effect MRA. However, unlike un-weighted regression,
which gives equal weight to each observation, weighted regression also corrects for outliers
and measurement errors by giving less weight to such outliers to ensure that potentially more
reliable estimates are not confounded by observations subject to a larger variance.
In view of this, we estimate equation 3 by taken sample sizes from the primary study as
proxies for weights following the work of Stanley (2008) and Nelson and Kennedy (2009).
8
In STATA QMLE could be estimated using generalized linear model (glm) command with family (binomial), link (logit),
and robust standard error option.
9
QMLE accommodates naturally, non-constant variances and skewness (Oberhofor and Pfaffermayer 2009).!!
14
5.0 Results and Discussion
As a preliminary step before discussing the results of the findings, we follow the work of
Stanley and Rosenberger’s (2009), Root-n-meta-regression analysis (MRA) approach to
investigate the presence of publication selection bias using the relationship
EFF _ ESTir
= δi
+δ0
1
ni
⎛
⎝
⎜
⎜
⎞
⎠
⎟
⎟
+τi
with
1
ni
as measure of precision with which EFF _ EST
has been estimated.10
The result of this auxiliary regression indicates the presence of
publication bias represented by the significance of the estimated parameter δ0
at 1% level of
significance, while there is presence of genuine empirical effect that goes beyond publication
bias represented by the significance of the parameter δi
at 1% level of significance. However,
we did not investigate further the sources of potential publication bias, as this is not the focus
of the present paper. Subsequent discussions address research questions in the study.
5.1. RQ1: What is nexus between mean efficiency estimates and year of survey?11
Before we provide answer to the first research question, we take a closer look at the
distribution of the reported mean efficiency estimates from the primary study presented in
Figure 1. The figure on the left hand side shows that the mean efficiency scores from all the
selected primary study have a right-skewed distribution with most observations ranging from
0.52 - 0.99 and with an average of about 0.68 (see Table 1). This result is not surprising
because, a large number of studies place efficiency score of agriculture and food production
in the developing countries in the range of 0.60-0.85 (for details see, Bravo-Ureta and
Pinheiro, 1993; Thiam et al., 2001; Ogundari et al., 2012). That said, for the institution
responsible for agricultural and food policy design in Africa, it is very important to note that
0.68 average mean efficiency levels obtained the present study is an indication that there is
ample room for improvement of agriculture and food production in Africa. In addition, the
results imply that there is need to focus attention on investments that will push African
agriculture towards the existing frontier. Hence, a search of literature shows that the average
10
The Root-n-MRA approach was estimated using weighted regression with “ n ” as the weight, while n is number of
observation per efficiency estimate. For brevity, we did not present the result in the paper. The results can be made available
upon request from the author.
11
As earlier mentioned, efficiency estimates in our case comprises of technical, allocative, economic (cost) and profit
efficiency.
15
mean efficiency estimate obtained in the present study is lower than about 0.74 and 0.72
reported by Bravo-Ureta et al., (2007) and Ogundari and Brümmer (2011) from 14 and 124
published studies in Africa and Nigeria, respectively, while it is not different from 0.69
reported by Ogundari (2013) from 379 published frontier studies from Africa.
Also, closely related, the distribution of the reported mean efficiency estimates are allowed to
vary across the regions where the selected case studies were carried out, which is presented on
the right hand side of Figure 1. In this case, the figure shows that studies from West Africa
reported highest efficiency estimates within the range 0.50-0.90 and with a mean score of
about 0.71, followed by North Africa (0.66), Southern Africa (0.65), East Africa (0.63), and
Central Africa (0.54) countries in that order.
However, in an attempt to provide answer to the first research question, we first present in
Figure 2 the scatter plot of univariate relationship between reported mean efficiency estimates
and year of survey (or year of data) in the primary study. Guided by the fitted line, the figure
on the left hand side of Figure 2 shows a negative linear correlation relationship between
reported mean efficiency estimates per study and year of survey for the whole sample under
consideration. But when the relationship is allow to vary across the regions as presented on
the right-hand side of Figure 2, we uncover evidence of linear negative correlation in the
studies carried out in the West Africa, East Africa and Central Africa regions and positive
linear correlation in the studies carried out in the Southern Africa and Northern Africa regions.
Therefore, we augment the results of the scatter plot by using MRA based on equation 3,
which is presented in Tables 2A and 2B. While Table 2A focuses on estimates from un-
weighted fractional regression model, Table 2B is based on weighted fractional regression
model with number of observations from the primary study as weight. And for each of the
results in the tables, we estimate 5 different models to provide robustness check to the result
of the coefficient of DATAYEARir
, which happens to be the variable of interest designed to
provide answer to the first research question using MRAin the study. In this regard, other
variables included in MRA are considered as control variables, since studies have shown that
efficiency estimates often differ across many dimensions other than year of primary survey,
such as methodology used, data, functional forms, products, sample size, and geographical
location among others (Thiam et al., 2001; Bravo-Ureta et al., 2007; Ogundari and Brümmer
2011). The first and second models focus on the primary studies from Africa but without and
with the regional specific effects, respectively. The third model focuses on the selected case
16
studies from sub-Saharan Africa (SSA), while fourth and fifth models focus on the selected
case studies published from 1984-2003 and 2004-2013, respectively.
Thus, a closer look at the results obtained from both the un-weighted (i.e., Table 2A) and
weighted (i.e., Table 2B) regressions shows that the mean efficiency estimates EFF _ ESTir
from the selected case studies decrease significantly as survey year DATAYEARir
in the
primary study increases across all the models judging by the coefficient of DATAYEARir
.
Apparently, this implies that on average, the mean efficiency levels of African agriculture and
food production reported by the empirical studies has been declining or lags behind the best –
practice frontier over the years.12
This perhaps is an indication that efficiency change
contribute negatively to the African agricultural productivity growth over the years, which
also aligns strongly with Mugera and Oyede’s (2013) argument that in the context of African
agriculture, declines in efficiency and negative growth of TFP are possible.
To sum up, we find that the MRA result in the present study conform with the results of the
scatter plot earlier discussed as both findings lend support also to the findings of two recent
cross-country analysis of TFP growth of African Agriculture and food production based on
FAOSTAT data from 1961-2008 by Alene (2010) and Yu and Nin-Pratty (2011). The authors
found evidence that change in efficiency contributes negatively to agricultural productivity
growth over the years in the region. Given these, the contribution of efficiency to the growth
(or development) of African agriculture and food production is apparently negative from both
the meta-analysis results in the present study and the cross-country studies highlighted above.
13
The implication of this is that if food insecurity problem in Africa is to be addressed, then
policy challenge is to be able to identify factors driven efficiency levels of African agriculture
and food production that can be explore to improve its growth (or development) in the region.
These drivers will be discussed in section 5.3 of this paper.
5.2. RQ2: Are there differences in mean efficiency estimates across other study attributes?
Before we address the second research question, it is important to mention that looking
through the results presented in Tables 2A and 2B, there is a significant major differences
12
As noted by Ogundari and Brümmer (2011), in the absence of reliable panel data, it is possible to interpret the relationship
between efficiency scores reported in the primary studies and the survey year or year of data in the case studies as an implicit
indicator of efficiency change over time.
13
TFP growth is driven by four distinct components namely efficiency change, technical change (or technology change),
scale efficiency and allocative efficiency change in puts and outputs (Kumbhakar and Lovell 2000).
17
between the two. Nevertheless, because of the potential advantage of weighted regression as
earlier discussed, we address the second research question of the study using results of Table
2B. In this regard, the parameters of models 1 through 3 have similar significant results with
similar pattern, while models 4 and 5 due to different time period covered gave slightly
different results, especially model 4 as model 5 strongly align with the results of models 1-3.
That said, the results show that studies published in journal (D_JOURNAL), with parametric
method (D_PARAMETRIC), with panel data (D_PANELDATA), with single output or un-
aggregated output (D_OUTPUT) yield significantly higher mean efficiency estimates than
studies not published in journals, with non-parametric, with cross-sectional data, and
aggregated output, respectively across. The coefficient of panel data (D_PANELDATA) is
insignificant in models 1, 3 and 4 but significant in model 2 and 5, while coefficient of
D_JOURNAL, D_PARAMETRIC, and D_OUTPUT are statistically significant in all the
models with exception of coefficient of D_PARAMETRIC, which is not significant in model
4. And, looking through the literature, we notice that Thiam et al., (2001) and Bravo-Ureta et
al., (2007) found evidence that studies with cross sectional data report significantly lower
efficiency estimate compared to studies with panel data in their respective studies, thus
confirming the result of the present study. Also, closely related, Bravo-Ureta et al., (2007)
found evidence that studies with non-parametric specification reports higher efficiency
estimates, which contradict the present finding.14
Furthermore, we find that studies with large degree of freedom (DF) shows significantly
lower mean efficiency estimates in all the models with exception of model 4. Likewise, our
findings show that studies with Cobb-Douglass (D_COBBDOUGLAS) and Translog
(D_TRANSLOG) functional forms were insignificantly different from those that uses other
functional form and with no functional forms, especially in all the models with exception of
model 4. Also, we find that studies published in top ranking journals (D_IMPACTFACTOR)
reported lower and insignificant mean efficiency estimates in all the models with exception of
model 4 that gives significant result, compared to studies with no impact factors.
Studies with a focus on grain crops (D_GRAIN) reported lower and significant efficiency
estimates, compared to non-grain crops studies, while studies with a focus on food crops
(D_FOODCROP), and cash crop (D_CASHCROP) yield insignificantly lower mean
14
Since most if not all the previous studies highlighted in the text employed un-weighted regression, it is most likely to find
it difficult to compare the result of the present study that is based on weighted regression to many of these previous studies.
For example, we find that many of the significant results in Table 2A actually align strongly with the significant results
reported in many of the previous studies.
18
efficiency estimates compared to studies with non-food crops, respectively across all the
models. By contrast, studies with a focus on cash crop were found to have higher and
significant efficiency estimates by Ogundari and Brümmer (2011). But similar to the finding
of the present study, Bravo-Ureta et al., (2007) found consistently lower mean efficiency
scores for studies with a focus on grain crops.
While, no regional effects was considered in model 1, the empirical results show that
countries in the East Africa (D_EAST) and Central Africa (D_CENTRAL) regions report
significant lower mean efficiency estimates, while countries in the Southern Africa
(D_SOUTHERN), and North Africa (D_NORTH) yield lower and insignificant mean
efficiency estimates compared to countries in the West Africa (D_WEST) region especially in
models 2, 3 and 5. The implication of this finding is that regional differences to some extend
play a significant influence in the systematic heterogeneity that exist in the reported mean
efficiency estimates conditional on study-specific attributes in the study. Interestingly, Bravo-
Ureta et al., (2007) found significant differences in reported efficiency estimates across the
region and income groups considered in their study.15
5.3. RQ3: What drives African agriculture and food production efficiency over the years?
In an attempt to provide answer to the third research question, we specially construct a
database to identify variables that are associated with the decision-making units (i.e., farmers)
from the primary study, but had positive or negative significant effects on African agriculture
and food production efficiency over the years. The idea is to be able to synthesis important
socio-demographic variables of the decision-making units (DMU) or farmers that are key to
improving/increasing agricultural efficiency levels, which could serve as guide to agricultural
policy design and implementation in the continent in the future. This is important because
literature identified socio-demographic variables of the DMU such as age, years of experience,
educational level, etc. as the underlying causes of deviation from the frontier (Kumbhakar and
Lovell, 2000; Coelli et al., 2005). In this regard, Bravo-Ureta et al., (2007) stressed the
importance of efficiency as a relative measure of managerial ability for a given technology,
which could be related to a set of control variables associated with the decision-making unit
(or farmers).
15
Bravo-Ureta et al., (2007) employed efficiency studies from both the developed and developing agriculture, which
probably explain the significant of the regional dummies in their study.
19
To this end, our database shows that out of the 612 farm level mean efficiency estimates from
the 442 selected frontier studies, only 439 estimates sought to explain the sources of variation
in the efficiency level from the primary study. Thus, the database shows that variable
postulated to affect the efficiency levels of the respondents in the primary study varies from
region to region and this includes age, years of experience, educational level, health,
occupation (farming as a major occupation), and gender (male) of the farmers in the primary
study. Others include credit, extension activity, crop diversification, distant of the farm to
market, membership of cooperative society, farm size, land tenure, age of the farm, crop
rotation, and among others. However, Figure 3 shows the distribution of the socio-
demographic variables of the respondents (farmers) from the primary study identify from the
primary studies as the key drivers of African Agricultural efficiency over the years. Because
of few significant observations recorded in many of the identified variables, couple with the
fact that in many of the selected case studies, some of these variables were not jointly
considered by the primary researchers, the figure contains variables with highest percentage
of occurrence for both the positive and negative significant effect on the efficiency estimates
reported in the primary studies.16
Since, our interest is to identify the drivers of efficiency
level of African agriculture and food production as retrieved from the primary studies,
subsequent discussions are based on the variables with positive and statistical effect in Figure
3.
In this regards, the result shows that 41% of the 439 estimates identify education as a major
driver of efficiency level of African agriculture over the years. This was followed by year of
farming experience (28%); contact with extension agents (23%), age of the farmer (22%),
credit (15%), household size (15%), gender-male (12%), membership of cooperative society
(9%), and farm size (8%). Other analysis shows that 16%, 13%, and 11% of the 439 estimates
recognized joint significance influence of education and experience, education and extension,
and education and age on the efficiency level of African agriculture and food production over
the years. However, these factors can be broadly characterized to what Fugile and Wang’s
(2012) termed the enabling environment essential to enhance agricultural productivity in
terms of dissemination of new technologies and practices to the farmers.
16
The statistics presented in Figure 2 should be view as a multiple-choice response. In this regard, the percentage short fall
of each of the variable presented in the figure from 100% mark cannot be interpreted as indicator of studies that did not
identify the variable in explaining efficiency levels in the primary studies.
20
Therefore, the highest ranking of education is a further confirmation of Philips’s (1994)
argument that “there is a general consensus that education has a positive effect on agricultural
productivity and efficiency”. Also, the ranking of experience after education lends support to
Huffman’s (2001) suggestion that in some agricultural environments, experience and
education are likely to be the most important form of human capital for enhancing the
efficiency level of a producing unit in either a static or dynamic environment. Also, closely
related, the ranking of age as fourth most important driver of efficiency levels of agriculture
and food production in Africa can be attributed to the fact that age is considered in many
studies as a proxy for farming experience in the economic literature. According to Ogundari
et al., (2012), one possible reason why a number of studies identified age as a key
determinants could be as a result of the perceived correlation between experience and age of
the primary respondents in the selected studies.
Furthermore, identification of extension service (a proxy for agricultural education) as third
most important factor driving efficiency levels of African agriculture, underscores the
relevance of extension as inevitable vehicle for disseminating breakthrough technologies and
innovation to farmers that should be intensify vigorously in Africa.
Thus, we believe the findings have a number of policy implications, in particular policy
relevance of education in increasing agricultural production and productivity in Africa. Also,
the results attest to the crucial role of other human capital indicators such as farming
experience and extension, which are mainly related to training in new agricultural
technologies to increase agricultural productivity in the region. While Pudasain (1983)
argued that education contributes to agricultural production and productivity much higher in
modernize environment, which highlight the role of investment in technology, Otsuka (2013)
suggests that what is needed in SSA is an effective extension system to disseminate the
potentially productive technology in the region. The author argues further that the vision of
the appropriate technologies and their dissemination strategies are still missing or at best
weak in SSA. While we acknowledge that the findings from the present study has been
established in the literature on the efficiency of developing agriculture (see; Weir and Knight,
2000; Asadullah and Rahman, 2005; Ogundari and Brümmer, 2001; Ogundari et al., 2012),
the present review should be seen as a confirmation of the need to effectively foster
agricultural policies that embraces human capital development in the region and sub Saharan
Africa (SSA) in particular.
21
Given the evidence from this study that gains in African agricultural efficiency are associated
closely with farmers’ education over the years, the crucial question is, what exact role does
education play to increase agricultural productivity in Africa? Pudasaini (1983) and Reimers
and Klasen (2011) highlighted a number of roles, which education play in increasing
agricultural production. First, education helps farmers become better managers of limited
resources by enhancing their decision-making skills. Second, education enhances farmers
access to information on low-cost and sustainable alternatives, that could potentially help
them pay and receive better prices for inputs used and outputs sold, thus making education a
remedy to prevailing information asymmetries in the market. Third, education helps farmers
adapt new technologies faster to have a first mover advantage. Fourth, education helps
farmers to prefer riskier production technologies since they are able to evaluate adequately the
implied opportunities.
6.0 Conclusions
The paper attempts to shed light on whether efficiency estimates of African agriculture
improve or decline and what drives the efficiency levels from three decades (1984-2013) of
research on productivity of African agriculture. We employ meta-regression analysis (MRA)
on a total of 442 studies resulting in 612 farm level efficiency estimates for the analysis, given
that some studies reported more than one estimates. The studies cut across all the regions in
the continent with 30 countries represented.
Taken together, the overall mean farm level efficiency estimates of about 0.68 was obtained
from the case studies, which indicates that there is scope to improve efficiency level of
African agriculture as about 32% cost saving could be achieved if agricultural production is
on the frontier level in the region. The results of MRA show that mean efficiency estimates of
African agriculture from the primary studies decrease significantly as year of survey in
increases. Apparently, this implies that over the years, negative efficiency change
characterized development of African agriculture and food production. Also, the results of
other study attributes considered in MRA other than the survey years, show that studies
published in journal, with parametric method and with panel data significantly report higher
mean efficiency estimates, while studies with a focus on grain crops and with higher degree of
freedom significantly yield lower efficiency estimates. The variation in reported efficiency
estimates is significantly lower among countries from the Eastern and Central Africa regions,
compared to studies from Western Africa region taken as reference.
22
Other results identify key drivers of efficiency levels of African agriculture and food
production over the years to be education, years of experience, extension, credit, farm size
and membership of cooperative society. These findings have policy implications for
strengthening food security through increase in efficiency of African agriculture and food
production. Besides, the results could be very useful for researchers and academicians to
enable them identify study-specific attributes, essential for modeling farm level efficiency and
to evaluate the sensitivity of their results to the choice of model specification and method in
the region and elsewhere around the world.
Given these findings, the potential role of agriculture in reducing poverty and enhancing food
security will not materialize without concerted and purposeful policy action that is align with
the identified drivers of efficiency of African agriculture obtained in the present study.
However, this points to the needs for programmes and policies that will boost agricultural
efficiency levels and thus, productivity in the region. In this case, we suggest policies that
focus on improvement in extension services, introduction of incentives that will encourage
young, able and educated individuals with basic education to go into farming, and
introduction of robust training program for farmers on modern technology through activities
of extension. These policies should be seen as critical components of program that will enable
smallholder farms to be more efficient in the region.
Reference
Alston, J. M., M. C. Marra, P.G. Pardey and T. J. Wyatt (2000). Research Returns Redux: A
Meta-Analysis of the Returns to Agricultural R & D. The Australian Journal of
Agricultural and Resource Economics, Vol.44 (2): 185-215.
Alene, A. D. (2010). Productivity Growth and the effects of R&D in African Agriculture.
Agricultural Economics, Vol. 41: 223-238.
Asadullah, M. N, S. Rahman (2005). Farm productivity and Efficiency in Rural Bangladesh:
The role of Education Revisited. Working paper CSAE WPS/2005-10, Center for the
study of African Economies, University of Oxford.
Battese, G. E. (1992). Frontier production functions and technical efficiency: a survey of
empirical applications in agricultural economics. Agricultural economics, Vol.7: 185-
208.
Bravo-Ureta, B. E., D. Solis, V.H. Moreira Lopez, J. F. Maripani, A. Thiam and T. Rivas
(2007). Technical Efficiency in Farming: A Meta-Regression analysis. Journal of
Productivity Analysis, Vol. 27: 57-72.
23
Bravo-Ureta, B. E., and Pinheiro, A. E. (1993), ‘Efficiency analysis of developing country
agriculture: a review of the frontier function literature’, Agricultural Resources
Economics Review, Vol 22, pp 88–101.
Brümmer, B (2006). Food Policy to alleviate rural poverty: the potential contribution of
productivity growth in Agriculture and agricultural trade linearization, Quarterly
Journal of international Agriculture, Vol. 45(1): 1-6.
Chen, P-C., S-T. Chen and C-C. Chen (2012). Energy consumption and economic growth-
New evidence from meta-analysis, Energy policy, Vol. 44: 245-255.
Coelli, T. J., Rao, D. S. P., O’Donnell, C. J., and Battese, G. E. (2005), An Introduction to
Efficiency and Productivity Analysis, 2nd edition, Springer, New York.
Cox, C. (1996). Nonlinear quasi-likelihood models applications to continuous proportions.
Computational Statistics & Data Analysis 21: 449-461.
Darku, A. B., S. Malla and K. C. Tran (2013). Historical review of Agricultural Efficiency
Studies. CAIRN Research Network.
de Dominicis, L., R. J. G. M. Florax and H. L. F. de Groot (2008). A meta-analysis on the
relationship between income inequality and Economic Growth. Scottish Journal of
Political Economy Vol. 55(5): 654-682.
Espey, M., J. A. and W. Shaw (1997). Price elasticity of residential demand for water: a meta-
analysis. Water Resource, Vol. 33(6): 1369-1374.
Florax, R. J. G. M, C.M. Travisi and P. Nijkamp (2005). A meta-analysis of the willingness to
pay for reductions in pesticide risk exposure, European Review of Agricultural
Economics, Vol. 32(4): 441-467.
Fugile, K and S. L. Wang (2012). Productivity Growth in Global Agriculture shifting to
developing countries. Choices 4th
Quarter, Vol. 27(4).
Fried, H. O (2008). Efficiency and production. In Fried, H. O., C.A.K. Lovell and S.S.
Schmidt (eds.), measurement of productive efficiency and productivity growth,
Oxford University Press, New York.
Gallet, C (2010a). Meat Meets Meta: A quantitative Review of the Price Elasticity of meat.
American Journal of Agricultural Economics, 92(1): 258-272.
Gallet. C.A (2010b). The income elasticity of meat: a meta-analysis. The Australian Journal
of agricultural and Resources Economics, 54:477-490.
Gallet, C. A. (2007). The Demand for Alcohol: A Meta-Analysis of Elasticities. Australian
Journal of Agricultural and Resource Economics 51(2): 121–35.
24
Gallet, C. A., and J. A. List. (2003). Cigarette Demand: A Meta-Analysis of Elasticities.
Health Economics 12(10): 821–35.
Gallup, J., S. Radielet, and A. Warmer (1997). Economic growth and income of the poor.
CAER Discussion paper No.36, Harvard Institute for International Development,
Cambridge MA USA.
Hoff, A (2007). Second stage DEA: comparison of approaches for modeling the DEA score.
European Journal of Operational Research, Vol. 181: 425-435.
Huffman, W. E (2001). Human capital: Education and Agriculture. In B.L. Gardner and G. C.
Rausser (eds). Handbooks of Agricultural Economics, Vol. 1A, Elsevier, Amsterdam.
Josheski, D and D. Lazarov (2012). Exchange rate volatility and trade: a meta-regression
analysis, GRP International Journal of Business and Economics, Vol. 1(2): 24-49.
Kieschnick, R and B. D. McCullough (2003). Regression analysis of variates observed on
(0,1): percentages, proportions and fractions. Statistical Modeling 3: 193-213.
Kumbhakar, S. C., F. Asche and R. Tveteras (2013). Estimation and decomposition of
inefficiency when producers maximize return to outlay: an application to Norwegian
fishing trawlers. Journal of Productivity Analysis. DOI 10.1007/s11123-012-0336-5.
Kumbhakar, S. C., and Lovell, C. A. K. (2000), Stochastic Frontier Analysis, Cambridge
University Press, Cambridge.
Longhi, S., Nijkamp, P. and Poot, J. (2005) A Meta-Analytic Assessment of the Effect of
Immigration on Wages. Journal of Economic Surveys 19(3): 451-477.
Martin, W (2013). Productivity Growth, Trade and Poverty. Paper presented at the IARTC
meeting Seville, 3rd
June 2013.
Marshall, A (1920). Principles of Economics, 8th
edition. London: Macmillan & Co Ltd.
Mekasha, T. J and F. Tarp (2013). Aid and Growth: What meta-analysis reveals. The Journal
of Development Studies, 49 (4): 564-583.
McDonald, J (2009). Using least squares and Tobit in second stage DEA efficiency analysis,
European Journal of Operational Research, Vol.197: 792-798.
Mugera, A and A. Ojede (2013). Technical efficiency in African Agriculture: Is it catching up
or lagging behind? Journal of International Development. Do1:10.1002/jid.2907.
Moore, W and C. Thomas (2010). A meta-analysis of the relationship between debt and
growth, International Journal of Development Issues, Vol. 9(3): 214-225.
Nelson, J.P. and P. E. Kennedy (2009). The use and abuse of meta-analysis in environmental
and natural resource economics: An assessment. Environmental and Resource
Economics, Vol. 42(3): 345-377.
25
Nishimizu, M and J. Page (1982). Total factor productivity growth, technological progress,
and technical efficiency change: dimensions of productivity change in Yugoslavia,
1965-1978, Economic Journal, 92: 920-936.
Oberhofer, H and M. Pfaffermayr (2009). Fractional response models-A replication exercise
of Papke and Wooldridge (1996). A working paper in Econometrics and Statistics,
University of Innsbruck No.2009-02.
O’Donnell, D. J (2010). Measuring and decomposing agricultural productivity and
profitability change, Australian Journal Agricultural Resource Economics, Vol. 54:
527-560.
Ogundari, K (2013). The Paradigm of African Agricultural Efficiency, 1967-2012: What does
meta-analysis reveal? Paper presented at 7th
International conferences organized by
the Meta Analysis of Economic Research Network (MAER-Net) at University of
Greenwich, 5-7 Sept.
http://www2.gre.ac.uk/about/schools/business/services/events/current/maer-
net/conference-themes.
Ogundari, K. and A. Abdulai (2013). Examining the Heterogeneity in Calorie-Income
Elasticities: A meta-analysis. Food Policy: Vol. 40: 119-128.
Ogundari, K., T. T. Amos and V.O. Okoruwa (2012). A review of Nigerian agricultural
production efficiency literature, 1999-2011: What does one learn from frontier
studies? African Development Review, Vol. 24(1): 93-106.
Ogundari, K and B. Brümmer (2011). Technical efficiency of Nigerian Agriculture: A meta-
regression analysis. Outlook on Agriculture, Vol. 40 (2): 171-180.
Otsuka, K (2013). Food security, Income, Inequality and the Changing comparative
Advantage in World Agriculture. Agricultural Economics, Vol. 44: 1-12.
Papke, L. S and J. M. Wooldridge (1996). Econometric methods for fractional response
variables with an application to 401(K) plan participation rates. Journal of Applied
Econometrics, Vol.11: 619-632.
Philips, J.M (1994). Farmer Education and farmer efficiency: a meta-analysis, Economic
Development and Cultural Change, Vol. 4391): 149-165.
POSTnote (2006). Food security in developing countries, Published by Parliamentary office
of Science and Technology, UK, Issues No. 274.
Pudasaini, S. P (1983). The effects of education in Agriculture: Evidence from Nepal.
American Journal of Agricultural Economics, Vol. 65(3): 509-515.
26
Reimers, M and S. Klasen (2011). Revisiting the role of education for Agricultural
productivity, Courant Research Center, Discussion paper No. 90, Georg-August
University of Goettingen, Germany.
Romalho, E. A., J.J.S. Ramalho and P. D. Henriques (2010). Fractional regression models for
second stage DEA efficiency analyses, Journal of Productivity Analysis, Vol. 34:
239-255.
Stanley, T. D and H. Doucouliagos (2013). Neither fixed nor random: Weighted Least
Squares Meta-analysis. School Working paper (SWP) 2013/1, Faculty of Business
and Law, School of Accounting, Economics and Finance, Deakin University
Australia.
Stanley, T. D and R. S. Rosenberger (2009). Are recreation values systematically under
estimated? Reducing publication selection bias for benefit transfer. A paper
presented at the 2009 MAER-Net Colloquium, Corvallis Oregon USA.
Stanley, T.D (2008). Meta-regression methods for detecting and estimating empirical effects
in the presence of publication selection. Oxford Bulletin of Economics and Statistics
Vol. 70: 103-127.
Sterne, J. A. C. (2009), Meta-Analysis in Stata: An Updated Collection from the Stata Journal,
Stata Press, College Station, TX.
Thiam, A., Bravo-Ureta, B. E., and Rivas, T. (2001), ‘Technical efficiency in developing
country agriculture: a meta-analysis’, Agricultural Economics, Vol 25, pp 235–243.
Weir, S. and J. Knight (2000). Education Externalities in Rural Ethiopia: Evidence from
Average and Stochastic Frontier Production Functions. Working Paper CSAE
WPS/2000.4, Centre for the Study of African Economies, University of Oxford.
Yu, B and A. Nin-Pratt (2011). Agricultural Productivity and Policies in sub Saharan Africa.
IFPRI Discussion paper No. 01150 Washington DC.
Table&1:&Summary&statistics&of&variables&used&in&meta7regression&analysis&(MRA)&
Category)) Description) Variable) Mean) SD)
Efficiency&Score& Mean&efficiency&score&reported&(Dependent(variable)& EFF_EST& 0.6822& 0.1749&
Data& Average&year&of&the&data&that&a&primary&study&used&
Articles&with&panel&data&
Articles&with&cross7sectional&data&
Degree&of&Freedom&
DATAYEAR&
D_PANELDATA&
D_CROSSDATA&
DF&
2005.5&
0.0507&
0.9493&
261.28&
5.5349&
0.2195&&&&&&&&&&&&&&&&&&&&&&&&&&&&&&&&&&&&&&&&&&&&&&&&&&&&&&&&&&&&&&&&&&&&&
0.2195&
749.57&
Output&measure& Articles&with&single&output&measure/&un7aggregated&output& D_OUTPUT& 0.7941& 0.4047&
Publication& Journal&Articles&
Articles&in&top&ranking&journal&&
D_JOURNAL&
D_IMPACTFACTOR&
0.8839&
0.1258&
0.3205&
0.3319&
Specification& Articles&with&Cobb7Douglas&functional&form&
Articles&with&Translog&functional&form&
Articles&with&other&Functional&forms&and&with&no&functional&form&
D_COBBDOUGLAS&
D_TRANSLOG&
D_NOFUNCTION&
0.7075&
0.2239&
0.1046&
0.4553&
0.4172&
0.3062&
Methodology& Articles&with&parametric&method&
Articles&with&non7parametric&method&
D_PARAMETRIC&
D_NONPARAMETRIC&
0.8922&
0.1078&
0.3104&
0.3104&
Technology& Articles&with&Primal&Technology&representation&
Articles&with&Dual&Technology&representation&
D_PRIMAL&
D_DUAL&
0.8791&
0.0964&
0.2954&
0.2954&
Product& Articles&with&focus&on&Grain&crop&production&
Articles&with&focus&on&Food&crop&production&
Articles&with&focus&on&Cash&crop&production&
Articles&with&focus&on&non7crop&production&(livestock,&fish&etc.)&
D_GRAIN&
D_FOODCROP&
D_CASHCROP&
D_NONCROP&
0.2942&
0.7467&
0.1160&
0.1519&
0.4560&
0.4352&
0.3205&
0.3593&
Region& Articles&carried&out&in&East&Africa&
Articles&carried&out&in&Central&Africa&
Articles&carried&out&in&Southern&Africa&
Articles&carried&out&in&North&Africa&
Articles&carried&out&in&West&Africa&
D_EAST&
D_CENTRAL&
D_SOUTHERN&
D_NORTH&
D_WEST&
0.1863&
0.0212&
0.0686&
0.0408&
0.6846&
0.3896&
0.1443&
0.2530&
0.1981&
0.4650&
28
Table&2A:&Meta7regression&results&without&weight&
EXPLANATORY&
VARIABLES&
&
ALL&AFRICA:&&
Without&Regional&Effects&
ALL&AFRICA:&&
With&Regional&Effects&
SSA&REGION&&
ONLY&
PERIOD&OF&PUBLICATION&
198472003&
PERIOD&OF&PUBLICATION&
200472013&
Model&1& Model&2& Model&3& Model&4& Model&5&
Coefficient( Std.(Error( Coefficient( Std.(Error( Coefficient( Std.(Error( Coefficient( Std.(Error( Coefficient( Std.(Error(
DATAYEAR& 50.0198***) 0.0061) 50.0205***) 0.0059) 50.0266***) 0.0059) 50.0356***) 0.0075) 50.0215**) 0.0087)
D_PANELDATA& &0.4884& 0.2006& &0.1028& 0.1304& &0.0115& 0.1389& 70.4445& 0.7045& &0.1371& 0.1279&
DF& 70.0001*& 0.0000& 70.0001*& 0.0000& 70.0001*& 0.0000& 70.0005& 0.0003& 70.0001**& 0.0000&
D_JOURNAL& &0.3426**& 0.0962& &0.1988**& 0.1020& &0.1716*& 0.1044& &0.6260& 0.4043& &0.2062**& 0.1042&
D_IMPACTFACTOR& 70.1784*& 0.0963& 70.0746& 0.1003& 70.1039& 0.1024& 70.9398***& 0.1911& &0.0198& 0.1146&
D_COBBDOUGLAS& 70.2313& 0.1652& 70.3641**& 0.1681& 70.3442**& 0.1708& &2.0351**& 0.9054& 70.4452***& 0.1732&
D_TRANSLOG& 70.2637*& 0.1535& 70.3538**& 0.1545& 70.3644**& 0.1573& &1.0570& 0.8882& 70.3784**& 0.1593&
D_PARAMETRIC& &0.4884**& 0.2006& &0.5549***& 0.1995& &0.6357***& 0.2065& 70.7140& 0.8586& &0.5275***& 0.2154&
D_PRIMAL& &0.2094**& 0.1059& &0.2504**& 0.1029& &0.2293**& 0.1031& 70.1815& 0.4280& &0.2945***& 0.1057&
D_OUTPUT& &0.2288**& 0.0966& &0.2609***& 0.0953& &0.2961***& 0.0969& 70.3187*& 0.1852& &0.2588***& 0.0994&
D_GRAIN& 70.0781& 0.0817& 70.0993& 0.0809& 70.1156& 0.0829& &1.0739***& 0.3601& 70.0788& 0.0833&
D_FOODCROP& 70.0667& 0.1157& 70.0376& 0.1150& 70.0323& 0.1157& 71.1033& 0.7389& 70.0019& 0.1149&
D_CASHCROP& 70.1113& 0.1417& 70.0914& 0.1422& 70.0199& 0.1484& 70.2861& 0.7869& 70.0319& 0.1429&
D_EAST& 7& 7& 70.3135***& 0.0854& 70.3122***& 0.0860& 70.0865& 0.2213& 70.3504***& 0.0891&
D_CENTRAL& 7& 7& 70.7127***& 0.2139& 70.7109***& 0.2011& No&case&study& 70.7904***& 0.2187&
D_SOUTHERN& 7& 7& 70.1923& 0.1243& 70.1884& 0.1249& 70.8310***& 0.3564& &0.0693& 0.451&
D_NORTH& 7& 7& 70.2351& 0.1567& Not&part&of&SSA& No&case&study& 70.2855*& 0.1519&
CONSTANT& 39.783***& 12.121& 41.295***& 12.029& 53.468***& 11.757& 72.408***& 14.894& &43.257***& 17.480&
LOG_PSLIKELIHOOD& 7268.82& 7267.45& 7255.99& 716.48& 7249.11&
DEVIANCE& 85.00& 82.25& 79.08& 1.85& 76.71&
PEARSON& 80.80& 78.69& 75.49& 1.86& 73.46&
(1/DF)&DEVIANCE& 0.1421& 0.1385& 0.1387& 0.0638& 0.1392&
(1/DF)&PEARSON& 0.1351& 0.1325& 0.1325& 0.0641& 0.1333&
AIC& 0.9243& 0.9328& 0.9301& 1.4178& 0.9388&
BIC& 73752.20& 73729.29& 73554.68& 7107.22& 73418.77&
#&OBSERVATION& 612& 612& 587& 043& 569&
Note:(***,(**,(*(implies(that(the(estimated(parameters(are(significantly(different(from(zero(at(1%,(5%,(and(10%(significance(level,(respectively.(Standard(errors(reported(are(robust(standard(errors.
29
Table&2B:&Meta7regression&results&with&weight&
EXPLANATORY&
VARIABLES&
&
ALL&AFRICA:&&
Without&Regional&Effects&
ALL&AFRICA:&&
With&Regional&Effects&
SSA&REGION&&
ONLY&
PERIOD&OF&PUBLICATION&
198472003&
PERIOD&OF&PUBLICATION&
200472013&
Model&1& Model&2& Model&3& Model&4& Model&5&
Coefficient( Std.(Error( Coefficient( Std.(Error( Coefficient( Std.(Error( Coefficient( Std.(Error( Coefficient( Std.(Error(
DATAYEAR& 50.0339***) 0.0096) 50.0342***) 0.0095) 50.0393***) 0.0099) 50.0368***) 0.0077) 50.0416***) 0.0141)
D_PANELDATA& &0.2881& 0.1829& &0.2815*& 0.1649& &0.2579& 0.1684& 70.4544& 0.5653& &0.3255**& 0.1649&
DF& 70.0001& 0.0000*& 70.0001**& 0.0000& 70.0001**& 0.0000& 70.0003& 0.0004& 70.0001**& 0.0000&
D_JOURNAL& &0.3577***& 0.1303& &0.2666**& 0.1269& &0.2521**& 0.1275& &0.8957***& 0.2680& &0.2844***& 0.1265&
D_IMPACTFACTOR& 70.1591& 0.2225& 70.1087& 0.2165& 70.1309& 0.2197& 70.8619***& 0.1679& 70.0606& 0.2329&
D_COBBDOUGLAS& 70.1139& 0.2132& 70.2819& 0.2239& 70.2741& 0.2278& &2.2007**& 0.8827& 70.4137*& 0.2168&
D_TRANSLOG& 70.0233& 0.1683& 70.1507& 0.1769& 70.1618& 0.1807& &1.3875& 0.8686& 70.2869*& 0.1647&
D_PARAMETRIC& &0.9377***& 0.3315& &1.1102***& 0.3354& &1.1663***& 0.3392& 70.7710& 0.8578& &1.2862***& 0.3658&
D_PRIMAL& 70.1886& 0.1946& 70.1322& 0.1829& 70.1304& 0.1795& 70.2226& 0.3305& 70.1267& 0.1817&
D_OUTPUT& &0.3322**& 0.1501& &0.3383**& 0.1518& &0.3667**& 0.1536& 70.3442**& 0.1073& &0.3641**& 0.1560&
D_GRAIN& 70.3927***& 0.1249& 70.3979***& 0.1258& 70.4192***& 0.1525& &0.8650***& 0.3413& 70.3995***& 0.1289&
D_FOODCROP& 70.0376& 0.1414& 70.0257& 0.1478& 70.0209& 0.1492& 70.4193& 0.5049& &0.0022& 0.1514&
D_CASHCROP& 70.2737& 0.1916& 70.2896& 0.2069& 70.2420& 0.2176& &0.4695& 0.5728& 70.2909& 0.2151&
D_EAST& 7& 7& 70.3367***& 0.1368& 70.3369***& 0.1366& 70.1269& 0.1650& 70.3575***& 0.1440&
D_CENTRAL& 7& 7& 70.5456***& 0.1993& 70.5634***& 0.1965& No&case&study& 70.5884***& 0.2101&
D_SOUTHERN& 7& 7& 70.1064& 0.2343& 70.1078& 0.2300& 70.5809**& 0.2698& 70.1142& 0.2529&
D_NORTH& 7& 7& 70.0363& 0.2214& Not&part&of&SSA& No&case&study& 70.0675& 0.2355&
CONSTANT& 67.749***& 19.100& 69.212***& 19.284& 78.488***& 19.697& 73.546***& 15.324& &84.506***& 28.409&
LOG_PSLIKELIHOOD& 7275.18& 7273.75& 7262.15& 717.40& 7254.97&
DEVIANCE& 72.16& 69.31& 65.85& 1.04& 65.46&
PEARSON& 67.64& 65.55& 62.30& 0.97& 62.14&
1/DF&DEVIANCE& 0.1207& 0.1167& 0.1155& 0.0360& 0.1188&
1/DF&PEARSON& 0.1131& 0.1104& 0.1093& 0.0335& 0.1128&
AIC& 0.9450& 0.9534& 0.9511& 1.4607& 0.9595&
BIC& 73765.05& 73742.22& 73567.91& 7108.03& 73430.02&
#&OBSERVATION& 612& 612& 587& 043& 569&
Note:(***,(**,(*(implies(that(the(estimated(parameters(are(significantly(different(from(zero(at(1%,(5%,(and(10%(significance(level,(respectively.(Standard(errors(reported(are(robust(standard(errors.(Weight(is(the(size(
of(observation(in(the(primary(study.
30
Fig.1: Distribution of mean efficiency estimates from the selected case studies for the whole sample & also across the regions in Africa
0204060
Frequency
0 .2 .4 .6 .8 1
EFF_EST
02460246
0 .5 1
0 .5 1 0 .5 1
West_Africa East_Africa Central_Africa
Southern_Africa North_Africa
Density
EFF_EST
Graphs by region
31
Fig. 2: Scatter plot of the univariate relationship between the mean efficiency estimates and year of survey for the whole sample and the regions in Africa
0.2.4.6.81
1970 1980 1990 2000 2010
Data_Year
EFF_EST Fitted values
0.510.51
1960 1980 2000 2020
1960 1980 2000 20201960 1980 2000 2020
West_Africa East_Africa Central_Africa
Southern_Africa North_Africa
EFF_EST Fitted values
Data_Year
Graphs by region
32
(
Fig.&3:(Distribution(of(identified(key(drivers(African(Agricultural(Efficiency(Levels(from(the(selected(case(studies
((((((((((((((((((((
(
22 28 15 23
15
41 12 9
8
16 15 7 10
12
15 6 5
8
Positive Effect (%) Negative Effect(%)

More Related Content

What's hot

Evaluating economic impacts of agricultural research ciat
Evaluating economic impacts of agricultural research ciatEvaluating economic impacts of agricultural research ciat
Evaluating economic impacts of agricultural research ciatCIAT
 
11.[1 10]technical efficiency in agriculture in ghana analyses of determining...
11.[1 10]technical efficiency in agriculture in ghana analyses of determining...11.[1 10]technical efficiency in agriculture in ghana analyses of determining...
11.[1 10]technical efficiency in agriculture in ghana analyses of determining...Alexander Decker
 
Technical efficiency in agriculture in ghana analyses of determining factors
Technical efficiency in agriculture in ghana analyses of determining factorsTechnical efficiency in agriculture in ghana analyses of determining factors
Technical efficiency in agriculture in ghana analyses of determining factorsAlexander Decker
 
11.technical efficiency in agriculture in ghana analyses of determining factors
11.technical efficiency in agriculture in ghana analyses of determining factors11.technical efficiency in agriculture in ghana analyses of determining factors
11.technical efficiency in agriculture in ghana analyses of determining factorsAlexander Decker
 
Energy consumption pattern in wheat production in sindh
Energy consumption pattern in wheat production in sindhEnergy consumption pattern in wheat production in sindh
Energy consumption pattern in wheat production in sindhsanaullah noonari
 
The effects of food price increases on urban household food commodities expen...
The effects of food price increases on urban household food commodities expen...The effects of food price increases on urban household food commodities expen...
The effects of food price increases on urban household food commodities expen...nanaeghan
 
Stability criterion of periodic oscillations in a (5)
Stability criterion of periodic oscillations in a (5)Stability criterion of periodic oscillations in a (5)
Stability criterion of periodic oscillations in a (5)Alexander Decker
 
Influence of Farmer Level of Education on the Practice of Improved Agricultur...
Influence of Farmer Level of Education on the Practice of Improved Agricultur...Influence of Farmer Level of Education on the Practice of Improved Agricultur...
Influence of Farmer Level of Education on the Practice of Improved Agricultur...paperpublications3
 
Agricultural growth in Ethiopia (2004-2014): Evidence and drivers
Agricultural growth in Ethiopia (2004-2014): Evidence and driversAgricultural growth in Ethiopia (2004-2014): Evidence and drivers
Agricultural growth in Ethiopia (2004-2014): Evidence and driversessp2
 
Source, Availability and Use of Agricultural Informationby Extension Agents i...
Source, Availability and Use of Agricultural Informationby Extension Agents i...Source, Availability and Use of Agricultural Informationby Extension Agents i...
Source, Availability and Use of Agricultural Informationby Extension Agents i...paperpublications3
 
Attitude and Academic Success in Practical Agriculture: Evidence from Public ...
Attitude and Academic Success in Practical Agriculture: Evidence from Public ...Attitude and Academic Success in Practical Agriculture: Evidence from Public ...
Attitude and Academic Success in Practical Agriculture: Evidence from Public ...Olutosin Ademola Otekunrin
 
Food price inflation and consumer welfare in ghana
Food price inflation and consumer welfare in ghanaFood price inflation and consumer welfare in ghana
Food price inflation and consumer welfare in ghanananaeghan
 
Analysis of agricultural subsectors contribution growth rate in the agricultu...
Analysis of agricultural subsectors contribution growth rate in the agricultu...Analysis of agricultural subsectors contribution growth rate in the agricultu...
Analysis of agricultural subsectors contribution growth rate in the agricultu...inventionjournals
 
ISSUES AND CHALLENGES IN THE SUPPLY CHAIN OF FRUITS & VEGETABLES SECTOR IN IN...
ISSUES AND CHALLENGES IN THE SUPPLY CHAIN OF FRUITS & VEGETABLES SECTOR IN IN...ISSUES AND CHALLENGES IN THE SUPPLY CHAIN OF FRUITS & VEGETABLES SECTOR IN IN...
ISSUES AND CHALLENGES IN THE SUPPLY CHAIN OF FRUITS & VEGETABLES SECTOR IN IN...ijmvsc
 
Determinants of seed cotton output evidence from the northern region of ghana
Determinants of seed cotton output  evidence from the northern region of ghanaDeterminants of seed cotton output  evidence from the northern region of ghana
Determinants of seed cotton output evidence from the northern region of ghanaAlexander Decker
 
Does market access mitigate the impact of seasonality on child growth? Panel ...
Does market access mitigate the impact of seasonality on child growth?Panel ...Does market access mitigate the impact of seasonality on child growth?Panel ...
Does market access mitigate the impact of seasonality on child growth? Panel ...essp2
 

What's hot (18)

Evaluating economic impacts of agricultural research ciat
Evaluating economic impacts of agricultural research ciatEvaluating economic impacts of agricultural research ciat
Evaluating economic impacts of agricultural research ciat
 
11.[1 10]technical efficiency in agriculture in ghana analyses of determining...
11.[1 10]technical efficiency in agriculture in ghana analyses of determining...11.[1 10]technical efficiency in agriculture in ghana analyses of determining...
11.[1 10]technical efficiency in agriculture in ghana analyses of determining...
 
Technical efficiency in agriculture in ghana analyses of determining factors
Technical efficiency in agriculture in ghana analyses of determining factorsTechnical efficiency in agriculture in ghana analyses of determining factors
Technical efficiency in agriculture in ghana analyses of determining factors
 
11.technical efficiency in agriculture in ghana analyses of determining factors
11.technical efficiency in agriculture in ghana analyses of determining factors11.technical efficiency in agriculture in ghana analyses of determining factors
11.technical efficiency in agriculture in ghana analyses of determining factors
 
C0341923
C0341923C0341923
C0341923
 
Energy consumption pattern in wheat production in sindh
Energy consumption pattern in wheat production in sindhEnergy consumption pattern in wheat production in sindh
Energy consumption pattern in wheat production in sindh
 
The effects of food price increases on urban household food commodities expen...
The effects of food price increases on urban household food commodities expen...The effects of food price increases on urban household food commodities expen...
The effects of food price increases on urban household food commodities expen...
 
Stability criterion of periodic oscillations in a (5)
Stability criterion of periodic oscillations in a (5)Stability criterion of periodic oscillations in a (5)
Stability criterion of periodic oscillations in a (5)
 
Influence of Farmer Level of Education on the Practice of Improved Agricultur...
Influence of Farmer Level of Education on the Practice of Improved Agricultur...Influence of Farmer Level of Education on the Practice of Improved Agricultur...
Influence of Farmer Level of Education on the Practice of Improved Agricultur...
 
Agricultural growth in Ethiopia (2004-2014): Evidence and drivers
Agricultural growth in Ethiopia (2004-2014): Evidence and driversAgricultural growth in Ethiopia (2004-2014): Evidence and drivers
Agricultural growth in Ethiopia (2004-2014): Evidence and drivers
 
Source, Availability and Use of Agricultural Informationby Extension Agents i...
Source, Availability and Use of Agricultural Informationby Extension Agents i...Source, Availability and Use of Agricultural Informationby Extension Agents i...
Source, Availability and Use of Agricultural Informationby Extension Agents i...
 
Attitude and Academic Success in Practical Agriculture: Evidence from Public ...
Attitude and Academic Success in Practical Agriculture: Evidence from Public ...Attitude and Academic Success in Practical Agriculture: Evidence from Public ...
Attitude and Academic Success in Practical Agriculture: Evidence from Public ...
 
Food price inflation and consumer welfare in ghana
Food price inflation and consumer welfare in ghanaFood price inflation and consumer welfare in ghana
Food price inflation and consumer welfare in ghana
 
AGRIMONITOR
AGRIMONITORAGRIMONITOR
AGRIMONITOR
 
Analysis of agricultural subsectors contribution growth rate in the agricultu...
Analysis of agricultural subsectors contribution growth rate in the agricultu...Analysis of agricultural subsectors contribution growth rate in the agricultu...
Analysis of agricultural subsectors contribution growth rate in the agricultu...
 
ISSUES AND CHALLENGES IN THE SUPPLY CHAIN OF FRUITS & VEGETABLES SECTOR IN IN...
ISSUES AND CHALLENGES IN THE SUPPLY CHAIN OF FRUITS & VEGETABLES SECTOR IN IN...ISSUES AND CHALLENGES IN THE SUPPLY CHAIN OF FRUITS & VEGETABLES SECTOR IN IN...
ISSUES AND CHALLENGES IN THE SUPPLY CHAIN OF FRUITS & VEGETABLES SECTOR IN IN...
 
Determinants of seed cotton output evidence from the northern region of ghana
Determinants of seed cotton output  evidence from the northern region of ghanaDeterminants of seed cotton output  evidence from the northern region of ghana
Determinants of seed cotton output evidence from the northern region of ghana
 
Does market access mitigate the impact of seasonality on child growth? Panel ...
Does market access mitigate the impact of seasonality on child growth?Panel ...Does market access mitigate the impact of seasonality on child growth?Panel ...
Does market access mitigate the impact of seasonality on child growth? Panel ...
 

Similar to A meta-regression analysis of frontier efficiency estimates from Africa

Cost-benefit-analysis of Africa RISING technologies in Tanzania
Cost-benefit-analysis of Africa RISING technologies in Tanzania Cost-benefit-analysis of Africa RISING technologies in Tanzania
Cost-benefit-analysis of Africa RISING technologies in Tanzania africa-rising
 
Farmer's Agribusiness Training Course: Module 1 Lesson 3 Supplementary Readin...
Farmer's Agribusiness Training Course: Module 1 Lesson 3 Supplementary Readin...Farmer's Agribusiness Training Course: Module 1 Lesson 3 Supplementary Readin...
Farmer's Agribusiness Training Course: Module 1 Lesson 3 Supplementary Readin...PiLNAfrica
 
Farmer's Agribusiness Training Course: Module 1 Lesson 3 Supplementary Readin...
Farmer's Agribusiness Training Course: Module 1 Lesson 3 Supplementary Readin...Farmer's Agribusiness Training Course: Module 1 Lesson 3 Supplementary Readin...
Farmer's Agribusiness Training Course: Module 1 Lesson 3 Supplementary Readin...Saide OER Africa
 
Agricultural productivity growth and incidence of poverty
Agricultural productivity growth and incidence of povertyAgricultural productivity growth and incidence of poverty
Agricultural productivity growth and incidence of povertyAlexander Decker
 
Regional livestock modeling for climate change adaptation and mitigation in S...
Regional livestock modeling for climate change adaptation and mitigation in S...Regional livestock modeling for climate change adaptation and mitigation in S...
Regional livestock modeling for climate change adaptation and mitigation in S...ILRI
 
Productivity and resource use efficiency in tomato and watermelon farms
Productivity and resource use efficiency in tomato and watermelon farmsProductivity and resource use efficiency in tomato and watermelon farms
Productivity and resource use efficiency in tomato and watermelon farmsAlexander Decker
 
11.productivity and resource use efficiency in tomato and watermelon farms
11.productivity and resource use efficiency in tomato and watermelon farms11.productivity and resource use efficiency in tomato and watermelon farms
11.productivity and resource use efficiency in tomato and watermelon farmsAlexander Decker
 
Impact assessment of Volta2 innovation platforms on improvement of crop and l...
Impact assessment of Volta2 innovation platforms on improvement of crop and l...Impact assessment of Volta2 innovation platforms on improvement of crop and l...
Impact assessment of Volta2 innovation platforms on improvement of crop and l...ILRI
 
A meta analysis of the use of genetically modified cotton and its conventiona...
A meta analysis of the use of genetically modified cotton and its conventiona...A meta analysis of the use of genetically modified cotton and its conventiona...
A meta analysis of the use of genetically modified cotton and its conventiona...Alexander Decker
 
Evaluation of Global Competitiveness Power of Food Sector in Turkey: An Analy...
Evaluation of Global Competitiveness Power of Food Sector in Turkey: An Analy...Evaluation of Global Competitiveness Power of Food Sector in Turkey: An Analy...
Evaluation of Global Competitiveness Power of Food Sector in Turkey: An Analy...inventionjournals
 
Job Performance and Job Satisfaction of Agricultural Extension Agents Inriver...
Job Performance and Job Satisfaction of Agricultural Extension Agents Inriver...Job Performance and Job Satisfaction of Agricultural Extension Agents Inriver...
Job Performance and Job Satisfaction of Agricultural Extension Agents Inriver...iosrjce
 
World food fao statistical data 2014
World food fao statistical data 2014World food fao statistical data 2014
World food fao statistical data 2014pvinothkanna
 
Bali-Singla2021_Article_EmergingTrendsInMachineLearnin.pdf
Bali-Singla2021_Article_EmergingTrendsInMachineLearnin.pdfBali-Singla2021_Article_EmergingTrendsInMachineLearnin.pdf
Bali-Singla2021_Article_EmergingTrendsInMachineLearnin.pdfmawande sikibi
 
What determines public budgets for agricultural growth in the developing world?
What determines public budgets for agricultural growth in the developing world?What determines public budgets for agricultural growth in the developing world?
What determines public budgets for agricultural growth in the developing world?IFPRI-PIM
 
Do Investments in Agricultural Extension Deliver Positive Benefits to Health,...
Do Investments in Agricultural Extension Deliver Positive Benefits to Health,...Do Investments in Agricultural Extension Deliver Positive Benefits to Health,...
Do Investments in Agricultural Extension Deliver Positive Benefits to Health,...Premier Publishers
 
Assessment of Experts’ Opinion on Irish Potato Farmers Perceptions about Clim...
Assessment of Experts’ Opinion on Irish Potato Farmers Perceptions about Clim...Assessment of Experts’ Opinion on Irish Potato Farmers Perceptions about Clim...
Assessment of Experts’ Opinion on Irish Potato Farmers Perceptions about Clim...Premier Publishers
 

Similar to A meta-regression analysis of frontier efficiency estimates from Africa (20)

Cost-benefit-analysis of Africa RISING technologies in Tanzania
Cost-benefit-analysis of Africa RISING technologies in Tanzania Cost-benefit-analysis of Africa RISING technologies in Tanzania
Cost-benefit-analysis of Africa RISING technologies in Tanzania
 
Farmer's Agribusiness Training Course: Module 1 Lesson 3 Supplementary Readin...
Farmer's Agribusiness Training Course: Module 1 Lesson 3 Supplementary Readin...Farmer's Agribusiness Training Course: Module 1 Lesson 3 Supplementary Readin...
Farmer's Agribusiness Training Course: Module 1 Lesson 3 Supplementary Readin...
 
Farmer's Agribusiness Training Course: Module 1 Lesson 3 Supplementary Readin...
Farmer's Agribusiness Training Course: Module 1 Lesson 3 Supplementary Readin...Farmer's Agribusiness Training Course: Module 1 Lesson 3 Supplementary Readin...
Farmer's Agribusiness Training Course: Module 1 Lesson 3 Supplementary Readin...
 
Agroecology_Poster_Cornell
Agroecology_Poster_CornellAgroecology_Poster_Cornell
Agroecology_Poster_Cornell
 
Agriculture Public Expenditure Workshop Module 3
Agriculture Public Expenditure Workshop Module 3Agriculture Public Expenditure Workshop Module 3
Agriculture Public Expenditure Workshop Module 3
 
Agricultural productivity growth and incidence of poverty
Agricultural productivity growth and incidence of povertyAgricultural productivity growth and incidence of poverty
Agricultural productivity growth and incidence of poverty
 
Regional livestock modeling for climate change adaptation and mitigation in S...
Regional livestock modeling for climate change adaptation and mitigation in S...Regional livestock modeling for climate change adaptation and mitigation in S...
Regional livestock modeling for climate change adaptation and mitigation in S...
 
Productivity and resource use efficiency in tomato and watermelon farms
Productivity and resource use efficiency in tomato and watermelon farmsProductivity and resource use efficiency in tomato and watermelon farms
Productivity and resource use efficiency in tomato and watermelon farms
 
11.productivity and resource use efficiency in tomato and watermelon farms
11.productivity and resource use efficiency in tomato and watermelon farms11.productivity and resource use efficiency in tomato and watermelon farms
11.productivity and resource use efficiency in tomato and watermelon farms
 
A i3621e
A i3621eA i3621e
A i3621e
 
Impact assessment of Volta2 innovation platforms on improvement of crop and l...
Impact assessment of Volta2 innovation platforms on improvement of crop and l...Impact assessment of Volta2 innovation platforms on improvement of crop and l...
Impact assessment of Volta2 innovation platforms on improvement of crop and l...
 
Impact evaluation as a learning and accountability tool for agricultural exte...
Impact evaluation as a learning and accountability tool for agricultural exte...Impact evaluation as a learning and accountability tool for agricultural exte...
Impact evaluation as a learning and accountability tool for agricultural exte...
 
A meta analysis of the use of genetically modified cotton and its conventiona...
A meta analysis of the use of genetically modified cotton and its conventiona...A meta analysis of the use of genetically modified cotton and its conventiona...
A meta analysis of the use of genetically modified cotton and its conventiona...
 
Evaluation of Global Competitiveness Power of Food Sector in Turkey: An Analy...
Evaluation of Global Competitiveness Power of Food Sector in Turkey: An Analy...Evaluation of Global Competitiveness Power of Food Sector in Turkey: An Analy...
Evaluation of Global Competitiveness Power of Food Sector in Turkey: An Analy...
 
Job Performance and Job Satisfaction of Agricultural Extension Agents Inriver...
Job Performance and Job Satisfaction of Agricultural Extension Agents Inriver...Job Performance and Job Satisfaction of Agricultural Extension Agents Inriver...
Job Performance and Job Satisfaction of Agricultural Extension Agents Inriver...
 
World food fao statistical data 2014
World food fao statistical data 2014World food fao statistical data 2014
World food fao statistical data 2014
 
Bali-Singla2021_Article_EmergingTrendsInMachineLearnin.pdf
Bali-Singla2021_Article_EmergingTrendsInMachineLearnin.pdfBali-Singla2021_Article_EmergingTrendsInMachineLearnin.pdf
Bali-Singla2021_Article_EmergingTrendsInMachineLearnin.pdf
 
What determines public budgets for agricultural growth in the developing world?
What determines public budgets for agricultural growth in the developing world?What determines public budgets for agricultural growth in the developing world?
What determines public budgets for agricultural growth in the developing world?
 
Do Investments in Agricultural Extension Deliver Positive Benefits to Health,...
Do Investments in Agricultural Extension Deliver Positive Benefits to Health,...Do Investments in Agricultural Extension Deliver Positive Benefits to Health,...
Do Investments in Agricultural Extension Deliver Positive Benefits to Health,...
 
Assessment of Experts’ Opinion on Irish Potato Farmers Perceptions about Clim...
Assessment of Experts’ Opinion on Irish Potato Farmers Perceptions about Clim...Assessment of Experts’ Opinion on Irish Potato Farmers Perceptions about Clim...
Assessment of Experts’ Opinion on Irish Potato Farmers Perceptions about Clim...
 

Recently uploaded

The Economic History of the U.S. Lecture 30.pdf
The Economic History of the U.S. Lecture 30.pdfThe Economic History of the U.S. Lecture 30.pdf
The Economic History of the U.S. Lecture 30.pdfGale Pooley
 
Top Rated Pune Call Girls Viman Nagar ⟟ 6297143586 ⟟ Call Me For Genuine Sex...
Top Rated  Pune Call Girls Viman Nagar ⟟ 6297143586 ⟟ Call Me For Genuine Sex...Top Rated  Pune Call Girls Viman Nagar ⟟ 6297143586 ⟟ Call Me For Genuine Sex...
Top Rated Pune Call Girls Viman Nagar ⟟ 6297143586 ⟟ Call Me For Genuine Sex...Call Girls in Nagpur High Profile
 
Call Girls Koregaon Park Call Me 7737669865 Budget Friendly No Advance Booking
Call Girls Koregaon Park Call Me 7737669865 Budget Friendly No Advance BookingCall Girls Koregaon Park Call Me 7737669865 Budget Friendly No Advance Booking
Call Girls Koregaon Park Call Me 7737669865 Budget Friendly No Advance Bookingroncy bisnoi
 
High Class Call Girls Nagpur Grishma Call 7001035870 Meet With Nagpur Escorts
High Class Call Girls Nagpur Grishma Call 7001035870 Meet With Nagpur EscortsHigh Class Call Girls Nagpur Grishma Call 7001035870 Meet With Nagpur Escorts
High Class Call Girls Nagpur Grishma Call 7001035870 Meet With Nagpur Escortsranjana rawat
 
The Economic History of the U.S. Lecture 19.pdf
The Economic History of the U.S. Lecture 19.pdfThe Economic History of the U.S. Lecture 19.pdf
The Economic History of the U.S. Lecture 19.pdfGale Pooley
 
Malad Call Girl in Services 9892124323 | ₹,4500 With Room Free Delivery
Malad Call Girl in Services  9892124323 | ₹,4500 With Room Free DeliveryMalad Call Girl in Services  9892124323 | ₹,4500 With Room Free Delivery
Malad Call Girl in Services 9892124323 | ₹,4500 With Room Free DeliveryPooja Nehwal
 
Dividend Policy and Dividend Decision Theories.pptx
Dividend Policy and Dividend Decision Theories.pptxDividend Policy and Dividend Decision Theories.pptx
Dividend Policy and Dividend Decision Theories.pptxanshikagoel52
 
06_Joeri Van Speybroek_Dell_MeetupDora&Cybersecurity.pdf
06_Joeri Van Speybroek_Dell_MeetupDora&Cybersecurity.pdf06_Joeri Van Speybroek_Dell_MeetupDora&Cybersecurity.pdf
06_Joeri Van Speybroek_Dell_MeetupDora&Cybersecurity.pdfFinTech Belgium
 
Instant Issue Debit Cards - School Designs
Instant Issue Debit Cards - School DesignsInstant Issue Debit Cards - School Designs
Instant Issue Debit Cards - School Designsegoetzinger
 
Pooja 9892124323 : Call Girl in Juhu Escorts Service Free Home Delivery
Pooja 9892124323 : Call Girl in Juhu Escorts Service Free Home DeliveryPooja 9892124323 : Call Girl in Juhu Escorts Service Free Home Delivery
Pooja 9892124323 : Call Girl in Juhu Escorts Service Free Home DeliveryPooja Nehwal
 
High Class Call Girls Nashik Maya 7001305949 Independent Escort Service Nashik
High Class Call Girls Nashik Maya 7001305949 Independent Escort Service NashikHigh Class Call Girls Nashik Maya 7001305949 Independent Escort Service Nashik
High Class Call Girls Nashik Maya 7001305949 Independent Escort Service NashikCall Girls in Nagpur High Profile
 
Dharavi Russian callg Girls, { 09892124323 } || Call Girl In Mumbai ...
Dharavi Russian callg Girls, { 09892124323 } || Call Girl In Mumbai ...Dharavi Russian callg Girls, { 09892124323 } || Call Girl In Mumbai ...
Dharavi Russian callg Girls, { 09892124323 } || Call Girl In Mumbai ...Pooja Nehwal
 
Booking open Available Pune Call Girls Talegaon Dabhade 6297143586 Call Hot ...
Booking open Available Pune Call Girls Talegaon Dabhade  6297143586 Call Hot ...Booking open Available Pune Call Girls Talegaon Dabhade  6297143586 Call Hot ...
Booking open Available Pune Call Girls Talegaon Dabhade 6297143586 Call Hot ...Call Girls in Nagpur High Profile
 
Independent Call Girl Number in Kurla Mumbai📲 Pooja Nehwal 9892124323 💞 Full ...
Independent Call Girl Number in Kurla Mumbai📲 Pooja Nehwal 9892124323 💞 Full ...Independent Call Girl Number in Kurla Mumbai📲 Pooja Nehwal 9892124323 💞 Full ...
Independent Call Girl Number in Kurla Mumbai📲 Pooja Nehwal 9892124323 💞 Full ...Pooja Nehwal
 
Instant Issue Debit Cards - High School Spirit
Instant Issue Debit Cards - High School SpiritInstant Issue Debit Cards - High School Spirit
Instant Issue Debit Cards - High School Spiritegoetzinger
 
The Economic History of the U.S. Lecture 20.pdf
The Economic History of the U.S. Lecture 20.pdfThe Economic History of the U.S. Lecture 20.pdf
The Economic History of the U.S. Lecture 20.pdfGale Pooley
 
VVIP Pune Call Girls Katraj (7001035870) Pune Escorts Nearby with Complete Sa...
VVIP Pune Call Girls Katraj (7001035870) Pune Escorts Nearby with Complete Sa...VVIP Pune Call Girls Katraj (7001035870) Pune Escorts Nearby with Complete Sa...
VVIP Pune Call Girls Katraj (7001035870) Pune Escorts Nearby with Complete Sa...Call Girls in Nagpur High Profile
 
Stock Market Brief Deck (Under Pressure).pdf
Stock Market Brief Deck (Under Pressure).pdfStock Market Brief Deck (Under Pressure).pdf
Stock Market Brief Deck (Under Pressure).pdfMichael Silva
 

Recently uploaded (20)

The Economic History of the U.S. Lecture 30.pdf
The Economic History of the U.S. Lecture 30.pdfThe Economic History of the U.S. Lecture 30.pdf
The Economic History of the U.S. Lecture 30.pdf
 
Top Rated Pune Call Girls Viman Nagar ⟟ 6297143586 ⟟ Call Me For Genuine Sex...
Top Rated  Pune Call Girls Viman Nagar ⟟ 6297143586 ⟟ Call Me For Genuine Sex...Top Rated  Pune Call Girls Viman Nagar ⟟ 6297143586 ⟟ Call Me For Genuine Sex...
Top Rated Pune Call Girls Viman Nagar ⟟ 6297143586 ⟟ Call Me For Genuine Sex...
 
Call Girls Koregaon Park Call Me 7737669865 Budget Friendly No Advance Booking
Call Girls Koregaon Park Call Me 7737669865 Budget Friendly No Advance BookingCall Girls Koregaon Park Call Me 7737669865 Budget Friendly No Advance Booking
Call Girls Koregaon Park Call Me 7737669865 Budget Friendly No Advance Booking
 
High Class Call Girls Nagpur Grishma Call 7001035870 Meet With Nagpur Escorts
High Class Call Girls Nagpur Grishma Call 7001035870 Meet With Nagpur EscortsHigh Class Call Girls Nagpur Grishma Call 7001035870 Meet With Nagpur Escorts
High Class Call Girls Nagpur Grishma Call 7001035870 Meet With Nagpur Escorts
 
The Economic History of the U.S. Lecture 19.pdf
The Economic History of the U.S. Lecture 19.pdfThe Economic History of the U.S. Lecture 19.pdf
The Economic History of the U.S. Lecture 19.pdf
 
Malad Call Girl in Services 9892124323 | ₹,4500 With Room Free Delivery
Malad Call Girl in Services  9892124323 | ₹,4500 With Room Free DeliveryMalad Call Girl in Services  9892124323 | ₹,4500 With Room Free Delivery
Malad Call Girl in Services 9892124323 | ₹,4500 With Room Free Delivery
 
Dividend Policy and Dividend Decision Theories.pptx
Dividend Policy and Dividend Decision Theories.pptxDividend Policy and Dividend Decision Theories.pptx
Dividend Policy and Dividend Decision Theories.pptx
 
06_Joeri Van Speybroek_Dell_MeetupDora&Cybersecurity.pdf
06_Joeri Van Speybroek_Dell_MeetupDora&Cybersecurity.pdf06_Joeri Van Speybroek_Dell_MeetupDora&Cybersecurity.pdf
06_Joeri Van Speybroek_Dell_MeetupDora&Cybersecurity.pdf
 
Commercial Bank Economic Capsule - April 2024
Commercial Bank Economic Capsule - April 2024Commercial Bank Economic Capsule - April 2024
Commercial Bank Economic Capsule - April 2024
 
Instant Issue Debit Cards - School Designs
Instant Issue Debit Cards - School DesignsInstant Issue Debit Cards - School Designs
Instant Issue Debit Cards - School Designs
 
Pooja 9892124323 : Call Girl in Juhu Escorts Service Free Home Delivery
Pooja 9892124323 : Call Girl in Juhu Escorts Service Free Home DeliveryPooja 9892124323 : Call Girl in Juhu Escorts Service Free Home Delivery
Pooja 9892124323 : Call Girl in Juhu Escorts Service Free Home Delivery
 
(Vedika) Low Rate Call Girls in Pune Call Now 8250077686 Pune Escorts 24x7
(Vedika) Low Rate Call Girls in Pune Call Now 8250077686 Pune Escorts 24x7(Vedika) Low Rate Call Girls in Pune Call Now 8250077686 Pune Escorts 24x7
(Vedika) Low Rate Call Girls in Pune Call Now 8250077686 Pune Escorts 24x7
 
High Class Call Girls Nashik Maya 7001305949 Independent Escort Service Nashik
High Class Call Girls Nashik Maya 7001305949 Independent Escort Service NashikHigh Class Call Girls Nashik Maya 7001305949 Independent Escort Service Nashik
High Class Call Girls Nashik Maya 7001305949 Independent Escort Service Nashik
 
Dharavi Russian callg Girls, { 09892124323 } || Call Girl In Mumbai ...
Dharavi Russian callg Girls, { 09892124323 } || Call Girl In Mumbai ...Dharavi Russian callg Girls, { 09892124323 } || Call Girl In Mumbai ...
Dharavi Russian callg Girls, { 09892124323 } || Call Girl In Mumbai ...
 
Booking open Available Pune Call Girls Talegaon Dabhade 6297143586 Call Hot ...
Booking open Available Pune Call Girls Talegaon Dabhade  6297143586 Call Hot ...Booking open Available Pune Call Girls Talegaon Dabhade  6297143586 Call Hot ...
Booking open Available Pune Call Girls Talegaon Dabhade 6297143586 Call Hot ...
 
Independent Call Girl Number in Kurla Mumbai📲 Pooja Nehwal 9892124323 💞 Full ...
Independent Call Girl Number in Kurla Mumbai📲 Pooja Nehwal 9892124323 💞 Full ...Independent Call Girl Number in Kurla Mumbai📲 Pooja Nehwal 9892124323 💞 Full ...
Independent Call Girl Number in Kurla Mumbai📲 Pooja Nehwal 9892124323 💞 Full ...
 
Instant Issue Debit Cards - High School Spirit
Instant Issue Debit Cards - High School SpiritInstant Issue Debit Cards - High School Spirit
Instant Issue Debit Cards - High School Spirit
 
The Economic History of the U.S. Lecture 20.pdf
The Economic History of the U.S. Lecture 20.pdfThe Economic History of the U.S. Lecture 20.pdf
The Economic History of the U.S. Lecture 20.pdf
 
VVIP Pune Call Girls Katraj (7001035870) Pune Escorts Nearby with Complete Sa...
VVIP Pune Call Girls Katraj (7001035870) Pune Escorts Nearby with Complete Sa...VVIP Pune Call Girls Katraj (7001035870) Pune Escorts Nearby with Complete Sa...
VVIP Pune Call Girls Katraj (7001035870) Pune Escorts Nearby with Complete Sa...
 
Stock Market Brief Deck (Under Pressure).pdf
Stock Market Brief Deck (Under Pressure).pdfStock Market Brief Deck (Under Pressure).pdf
Stock Market Brief Deck (Under Pressure).pdf
 

A meta-regression analysis of frontier efficiency estimates from Africa

  • 1. 1 A meta-regression analysis of frontier efficiency estimates from Africa Kolawole OGUNDARI1 Dept. of Agricultural and Resource Economics, Kyushu University, Fukuoka, Japan. Selected Paper prepared for presentation at the Agricultural & Applied Economics Association’s 2014 AAEA Annual Meeting, Minneapolis, Minnesota, 27-29 June 2014 Copyright 2014 by Kolawole Ogundari. All rights reserved. Readers may make verbatim copies of this document for non-commercial purposes by any means, provided that this copyright notice appears on all such copies. 1 Email: ogundarikolawole@daad-alumni.de Acknowledgement The author gratefully acknowledge the financial support of the JSPS towards his postdoctoral fellowship at Kyushu University, Fukuoka and also for providing research grant with ID No. 24-02406.
  • 2. 2 A meta-regression analysis of frontier efficiency estimates from Africa The most valuable of all capital is investment in human beings –Alfred Marshal, 1920 Abstract( The study investigates whether African agricultural efficiency levels has been improving or not and what drives its over the years based on 442 frontier studies using meta-regression analysis. The results show that mean efficiency estimates from studies decrease significantly as year of survey in the primary study increases. Also studies published in Journals, with parametric specification and with panel data produced significantly higher efficiency estimates, while those with a focus on grain crops reported significantly lower efficiency estimates. Other results show that education, followed by experience; extension and credit are the major drivers of agricultural efficiency levels in Africa. Keywords: Agriculture, efficiency, meta-analysis, food security, fractional regression, Africa JEL Classification: C13, Q12, Q18 1.0 Introduction Agriculture remains the main trust of many countries in Africa, as the principal source of food and livelihood, making it a critical component of programs that seek to reduce poverty and attain food security in the continent. But in recent years, food insecurity has become a serious concern in Africa, especially in sub-Saharan Africa (SSA), which is reminiscent of the same issue in Asia for decades earlier (Otsuka, 2013). And, key to boosting food security in the region cannot be divorced from agricultural total factor productivity (TFP) growth. As noted by Brümmer (2006), improvement in the efficiency levels of agriculture and food production has always been identified as a major component of total factor productivity (TFP) growth that needs to be explored to effectively address food insecurity problem in the developing economies. Although, no country has successfully reduced poverty and food insecurity through agriculture alone as institutional and industrial development are often needed, but almost none has achieved it without first increasing its level of agricultural productivity and efficiency (POSTnote, 2006). In other words, the study of agricultural efficiency is important to all economies, developed and developing. And, this underscores why analysis of efficiency in agriculture and food production and the role of efficiency in increasing agriculture and food
  • 3. 3 production, has received particular attention by researchers and policy makers alike as an important input for better informed policy decisions around the globe (Thiam et al., 2001; Ogundari et al., 2012). According to Gallup et al., (1997), increase in efficiency and productivity of agricultural enterprises is likely to enhance smallholder (or subsistence) farmers opportunities to produce more, which in turn could lead to increase in their food security and income levels. This is because improvement in agricultural efficiency levels provide opportunities for farmers to produce more at same level of resources, while productivity and efficiency affect agriculture and food production directly by increasing the available supply of food and indirectly by increasing household income. For example, study by Gallup et al., (1997) has shown that 1% rise in per capita agricultural output (or TFP growth) could led to a 1.6% rise in income of the poorest. Likewise, Martin (2013) argues that the poverty impact of increase in agricultural productivity growth is much larger than for industry or services sector. The popularity of frontier efficiency studies in the last three decades has received attention among researchers and policy analysts and this is evidenced by the proliferation of the methodology and its application across the globe (Thiam et al., 2001). That said, recent empirical findings by Thiam et al., (2001), Bravo-Ureta et al., (2007) and Ogundari and Brümmer (2011) have shown that mean efficiency estimates of agricultural and food production reported in the primary study differ across many study attributes (or dimensions) such as methodology, data type, model specification, and location among others. In addition, two recent cross-country analyses of agricultural productivity growth in Africa based on FAOSTAT data by Alene (2010) and Yu and Nin-Pratty (2011) uncover evidence that change in efficiency levels contributed negatively to the growth of the sector over the years. This implies that decline in efficiency levels is the main cause of poor TFP growth in African agriculture and food production, while both studies also identified technical progress (technological change) as main driver of agricultural TFP growth in the region. This observation however, strongly contradicts Fugile and Wang’s (2012) argument that the future challenge to the global food security as in the past do not appear to be related to technical constraints, but rather to uneven access to resources (i.e., poor resource use efficiency level). Furthermore, recent study by Ogundari (2013) has shown that there are substantial number of efficiency studies that have been used to raise policy debates on the performance of African
  • 4. 4 agriculture and food production over the years. That said, it will be interesting to understand what literature reveal about the trends (or development) in African agricultural efficiency levels and what drives the efficiency levels over the years as an important input in agricultural policy decisions in the region. In other words, could similar findings obtained from existing cross-country studies on agricultural productivity be distilled from synthesized literature on efficiency of African agriculture over the years? As reveal by Ogundari et al., (2012), lessons/policy implications drawn from previous studies on agriculture and food production, could be very useful as guides to agricultural policymakers in designing effective food security program. Thus, arising from the foregoing, the present study addresses the following research questions: RQ1. How did the relationship between reported mean efficiency estimates and year of survey from the selected case studies develop (i.e., rise or decline) over the years? RQ2. Are there differences in reported mean efficiency estimates to a set of study- specific attributes such as methodology used, model specification, publication outlet, data type, location etc.? RQ3. What factors (policy variables) have driven agricultural efficiency levels as identified from the selected case studies over the years? The present study builds on the earlier works by Thiam et al., (2001), Bravo-Ureta et al., (2007), and Ogundari and Brümmer (2011) that utilized meta-analysis to investigate how mean efficiency scores from the primary study on agriculture and food production differ across study attributes such as methodology used, data type, model specification etc. While Thiam et al., (2001) focused on farm level efficiency estimates from the developing agriculture with 2 studies from Africa, Bravo-Ureta et al., (2007) examined efficiency estimates from both the developing and developed agriculture with 14 studies from Africa, and Ogundari and Brümmer (2011) focused exclusively on efficiency estimates from Nigeria with 124 studies involved. To sum up, the present study contributes to existing literature in threefold. First, unlike previous studies that include few numbers of observations from Africa, the present study focuses exclusively on efficiency estimates from Africa with broader geographical coverage that would produce a better understanding of the link between efficiency estimates in African
  • 5. 5 agriculture and attributes of studies reporting these estimates in the region. Second, unlike previous studies that uses Tobit, OLS and truncated regressions, believed to yield biased result as argued by McDonald (2009) and Ramaiho et al., (2011), the current study makes a significant contribution in terms of methodology employed by using fractional regression model for the meta-regression analysis (MRA). Three, unlike previous studies with exception of Ogundari and Brümmer (2011), we extended our discussion to include drivers of agricultural efficiency level over the years in Africa. The paper is structured as follows. The next section provides overviews of frontier efficiency and meta-analysis. Section three provides detailed description of the meta-dataset used for the analysis. In section four, meta-regression model specification is provided. Section five presents the results and discussion, while conclusions are provided in section six. 2.0 An overview of frontier efficiency and meta-analysis 2.1. An overview of frontier efficiency Efficiency is refers to how well a system or unit of production performs in the use of resources to produce outputs, given available technology relative to a standard (frontier) production (Fried, 2008). In this regard, efficiency of decision-making units (DMU) can be represented by technical efficiency, especially when primal technology specification is employed to model the performance of the production unit. Given this, the body of literature on the performance of farms examined how farmers have been using resources efficiently to produce maximum output by applying best technology and managerial practices (known as technical efficiency). Alternatively, it could be allocative efficiency/economic (cost) efficiency or profit efficiency when dual technology specification is considered, depending on the underlying behavioral assumption of cost minimization or profit maximization, respectively that is made to describe the performance of the production unit. In this case, literature examined how much costs can be reduced if the combination of inputs is optimal according to prices (known as allocative efficiency) and or if farms are operating at the optimal size that guarantee production at the minimum cost (known as economic or cost
  • 6. 6 efficiency)2 , while profit efficiency is view as the highest possible profit achieve by DMU relative to the frontier profit, given the optimum combination of output and factor prices.3 Economic theory offers numerous procedures for evaluating efficiency of a DMU (Hoff, 2007). Nevertheless, the methodologies employ in estimating efficiency level of agriculture and food production has evolved over the years. This however, ranges from when simple indexing method and mathematical programming (or non-parametric method-Data Envelopment Analysis-DEA) was used, use of simple and sophisticated econometrics (or parametric method such a stochastic frontier analysis-SFA), introduction of theoretically consistent functional forms, introduction of dynamic and spatial econometrics and systems of equations, use of multi-output technology estimation to the introduction of meta-frontier technology among others (for detail discussion see, Kumbhakar and Lovell, 2000 and Coelli et al., 2005). 4 Another major extension in efficiency measurement is recent advances in panel data methodologies, which led to the incorporation of efficiency into TFP growth decomposition process similar to the Solow Growth model. As noted by Thiam et al., (2001), a major feature of panel data is the ability to decompose TFP growth into technical change or technological change (i.e., pushing out production frontier) and efficiency change (i.e., movement of frontier, which could be catching up or lagging behind the production frontier) and until lately into scale efficiency change (change in variety of inputs available), allocative efficiency change in inputs and output and mix- efficiency change (Kumbhakar and Lovell 2000; O’Donnell 2010). This decomposition makes it possible to study the sources of TFP growth from different points of view (Nishimizu and Page, 1982) and this is very useful for designing agricultural policy program. Generally speaking, frontier efficiency model does not only serve as a benchmark, which efficiency levels of DMU are estimated, but it is also very useful in identifying determinants of efficiency levels for policy inference (Kumbhakar and Lovell, 2000). In this case, the approach used to incorporate the determinants of efficiency into frontier model has evolved over the years from two-stage approach to one stage approach that enables joint estimation of 2 Economic efficiency can also be defined as the product of technical and allocative efficiencies. 3 As noted by Thiam et al., (2001), the primal approach or direct estimation of the production function has been the more common route used for frontier estimation in the economic literature. 4 A major assumption underlying frontier models is that all firms have access to the same production technologies. Unfortunately, in practice some firms have access to different technologies. However, the use of meta-frontier model relaxes this assumption to allow firms of different technologies to be compared.
  • 7. 7 efficiency and its determinants (Kumbhakar and Lovell, 2000; Coelli., et al 2005). Even within the one stage approach, the methodology has also evolved from when mean of the pre- truncated distribution of the inefficiency error term is model as a function of exogenous variable that represents determinants of efficiency levels to when variance of the pre- truncated inefficiency error term is model as a function of exogenous variables. The later is believed to have possibility of solving two problems at once, namely to correct for heteroskedasticity in the inefficiency error terms, while incorporating exogenous variables to investigate inefficiency effects in the production process. A search of literature however, shows that a number of studies have provided historical review of agricultural efficiency literature over the years. Some of these studies include Battese (1992), Bravo-Ureta and Pinheiro (1993), Ogundari et al., (2012) and Darkn et al., (2013). The conclusions from these studies highlight the efforts that have been devoted to measuring efficiency in agriculture using different frontier methods and models over the years. In addition, the general conclusion from many of these studies show that efficiency estimates differ across many dimensions associated with study attributes such as methodology used, data type: cross-sectional vs. panel data, functional forms, products, sample size, geographical location and many more. This observation motivated the application of meta-analysis to investigate whether agricultural efficiency estimates from the primary studies differ across these dimensions as noted by Thiam et al., (2001), Bravo-Ureta et al., (2007) and Ogundari and Brümmer (2011). 2.2. An overview of meta-analysis Meta-analysis (MA) allows researchers to combine results of several homogenous studies into a unified analysis that provides an overall estimate of interest for further discussion (Sterne, 2009). It provides the same methodological rigor to a qualitative review. A general model of carrying out MA is the use of regression techniques. Meta-regression analysis (MRA) is defined as a quantitative method used to evaluate the effect of methodological and other study-specific characteristics on published empirical estimates of some indicators (Alston et al. 2000). With reference to the present study, mean efficiency estimates (which could be technical, allocative, economic (cost), or profit efficiency) from the primary study is treated as dependent variable, while study attributes such as year of data collection (or year of survey) in
  • 8. 8 the primary study, model specification, methodology, data type etc. are taken as explanatory variables. Although, MA is quite popular in medical, education, pharmaceutical, and marketing researches as noted by Thiam et al., (2001), a review of the literature however, shows that MA has also been extended to a wide range of results in economic research other than agricultural efficiency and productivity mentioned above in recent time. This includes effect of immigration on wages (Longhi et al., 2005), income and calorie intake (Ogundari and Abdulai, 2013), income inequality and economic growth (de Dominicis et al., 2008), effect of aid on economic growth (Mekasha and Tarp, 2013), energy consumption and economic growth (Chen et al., 2012), effect of currency unions on trade (Havranek, 2010), price and income elasticity of demand for meat (Gallet 2010a,b), price and income elasticity of demand for alcohol (Gallet, 2007), income elasticity of demand for cigarette (Gallet and List 2003), exchange rate volatility and trade (Josheski and Lazarov, 2012), debt and economic growth (Moore and Thomas, 2010), Willingness to pay for reduction in pesticide risk exposure (Florax et al., 2005) and many more. 3.0 The Meta-Dataset Meta-analysis requires a thorough search of literature that provides a complete description of study specific characteristics or attributes of interest for the MRA. To this end, a variety of sources were used to compile the selected case studies in the present study, which include personal communication with the authors, economic database such as web of science, Google scholar, AgEcons and ASCI Index and a host of other online database using relevant keywords. In addition, we consulted PhD dissertation and Masters Thesis from website of various Universities. The criteria used in selecting studies for the current analysis was that the study reports mean efficiency estimates, data year or year of survey, and sample size. Based on this, we selected 442 frontier studies for the current analysis. Because some of the retrieved studies reported more than one efficiency estimates, a total 612 farm level efficiency estimates were use for the MRA in the present study.5 The selected studies cut across the entire region in Africa namely West Africa, East Africa, Central Africa, Southern Africa and Northern Africa with a total of 30 countries represented in the meta-dataset. 5 The number of selected literature is not an exhaustive case study, nevertheless is a representative list of frontier literature in the region.
  • 9. 9 That said, an overview of the database shows that the number of farm level efficiency estimates (or frontier studies) obtained across the West Africa, East Africa, Central Africa, Southern Africa, and North Africa regions are 418 (314), 114 (78), 12 (5), 43 (27), and 25 (18), respectively. This perhaps shows that the substantial number of studies on the performance of Africa agriculture focus their research interest on the efficiency of agricultural and food production in West Africa region. In addition, we uncover evidence that the selected studies covered a range of products starting from grain crops such as maize, rice etc., tubers such as cassava, yam, cocoyam, potatoes, cash crops (cocoa, coffee etc.) to non-crop products such as egg production, poultry, livestock, fish etc. Therefore, using previous studies by Thiele et al., (2001), Bravo-Ureta et al., (2007), and Ogundari and Brümmer, (2011) as guides, we extracted and coded study specific attributes of interest for the MRA is presented in Table 1. The summary statistics of the selected case studies, detailed information regarding the authors, year of publication, the publication outlet for the primary study, and the mean efficiency estimate reported can be requested from the author. Because of space, this could not be included in the present paper. 4.0 The Meta-Regression Model and Empirical model 4.1 The Meta-Regression Model To provide answers to the first and second research questions in the study, we use meta- regression analysis (MRA). Below is the specification of the meta-regression model used in the present study EFF _ ESTir =ψ0 + βDATAYEARir + αk Xkir k=1 K ∑ + εir ; εir  N 0,σε( ) (1) where EFF _ ESTir represents mean efficiency estimate(s) from the i-th primary study, conducted in r-th region in Africa and ψ0 is intercept; DATAYEARir is the average years of survey used in the primary study, which starts from 1967, 1981, 1989, ….2012. This is carefully constructed and included in equation 1 to investigate trends or development in efficiency level of African agriculture and food production over the years. According to Ogundari et al. (2012), it is possible to interpret the relationship between efficiency estimates reported (i.e., EFF _ ESTir ) and the year of survey (i.e., DATAYEARir ) in primary studies as a proxy indicator of efficiency change over time in absence of reliable panel data. Xkir is a vector of other study attributes also considered in MRA model as control variables, which include D_ PANELDATA representing articles that used panel data (articles published with
  • 10. 10 cross section data served as reference); DF representing the degree of freedom in each study; D_OUTPUT representing studies with non-aggregated output (studies with an aggregated output served as reference); D_ JOURNAL representing articles published in Journals (articles published in conference, working papers, and thesis/dissertation were taken as reference); D_ IMPACTFACTOR representing articles published in top ranking journals with impact factor; D_COBBDOUGLAS representing articles that employed Cobb Douglass functional form (articles with other functional form and with no functional form served as reference); D_TRANSLOG representing articles that employed Translog functional form (articles with other functional form and with no functional form served as reference); D_ PARAMETRIC representing articles that employed parametric method (articles with non-parametric method served as reference); D_ PRIMAL representing articles that employed primal technology (articles with dual technology served as reference); D_GRAIN representing studies that focused on grain crops such as maize, rice etc. (articles with a focus on non-grains products served as reference); D_ FOODCROP and D_CASHCROP represent studies with a focus on food crops and cash crops, respectively (non-crop studies such as livestock, poultry, fish etc. served as reference); D_ EAST , D_CENTRAL , D_ SOUTHERN , and D_ NORTH represent articles published on countries in East Africa, Central Africa, Southern Africa, and North Africa, respectively (articles published in countries in West Africa served as reference). ψ0 ,β , and αk are parameters to be estimated and the sign of β and αk will generally indicate the direction in which a given variable influence changes in EFF _ ESTir . While a positive sign would indicate the variable having a positive effects on the EFF _ ESTir , a negative sign would suggest otherwise.6 εir is the error term of the regression and is assumed to be normally distributed with mean 0 and variance σε . Therefore, estimating any economic relationship from data requires assumptions about the data generating process-DGP (Kumbhakar et al., 2013). In this regard, McDonald (2009) and Ramaiho et al., (2010), argue that the DGP for EFF _ ESTir is a fractional/proportional data bounded between zero and 1 and not censored data by construction. Subsequently, the authors argue that the use of linear models such as ordinary least square (OLS) and Tobit models may not provide an accurate picture of the effects of explanatory variables on the dependent 6 With regards to the parameter of interest β - a positive sign would be taken as evidence of positive efficiency change in African agriculture over the years, while a negative sign would suggest opposite.
  • 11. 11 variable of equation 1. For example, if the explanatory variables in equation 1 are used to explain the dependent variable, the relationship must be bounded –otherwise, predicted EFF _ ESTir may be greater than one. In recognition of this, McDonald (2009) and Ramaiho et al., (2010) proposed the use of Papke and Wooldridge’s (1996) fractional regression model for the second stage analysis of the determinants of efficiency scores in the literature. Unlike OLS and Tobit models, fractional regression model deals with dependent variable defined on the unit interval, irrespective of whether boundary value of 0 or 1 is observed or not (Ramaiho et al., 2010). Intuitively, MRA of equation 1 is synonymous to investigating determinants of efficiency in second stage of DEA efficiency analyses by using regression to relate efficiency estimates to a number of factors seen to influence efficiency levels. These factors often include managerial characteristics such as age, educational attainment, and experience of the producers or DMU, and access to credit among others. Guided by this, the present study uses fractional regression model to estimate the parameters of equation 1. As earlier mentioned, this is a departure from previous studies on meta-analysis of efficiency studies on agriculture and food production that employed OLS and Tobit regression models such as Thiam et al., (2001) and Bravo-Ureta et al., (2007) and Truncated regression model by Ogundari and Brümmer (2011). The fractional regression model is subsequently discussed below. 4.2. Empirical Model Papke and Wooldridge (1996) highlight the drawbacks of linear models for fractional data that are analogues to the drawbacks of the linear probability model for binary data. Likewise, Kieschnick and McCullough (2003) argue that since fractional data are only observed over a closed interval, it implies that the conditional expectation function will not be normally distributed because they are not defined over ℜ , which is a domain over which the normal distribution is defined. The authors therefore suggest that the use of linear models such as average response function (OLS), censored regression (Tobit), or transformed logistic normal model (e.g., the log-odds ratio of dependent variable) are inefficient as their error distributions will be heteroskedastic, because their conditional variance will approach zero as their conditional mean approaches either of their boundary points. 7 7 In this regards, the problem in using OLS on fractional dependent variable is that it is not asymptotically efficient estimator but rather unbiased and consistent estimator.
  • 12. 12 The fractional response model is estimated using Quasi-Maximum Likelihood Estimation (QMLE) method and is a non-linear model. QMLE is asymptotically efficient and consistent compared to either OLS or Tobit or Truncated or transformed logistic normal often used by researcher to handle DGP of this nature. QMLE is one in which the variance of the observed data are known (up to a scale parameter) functions of the means (Cox 1996). Papke and Wooldridge (1996) specify a quasi-likelihood regression model for continuously measured proportions with a finite number of boundary observations (i.e., 0s and 1s). It is robust to obtain an estimate of fractional response models without ad hoc transformation of boundary values of the dataset. The authors used the following Bernoulli Log-likelihood specification. Li β or α( )≡ yi n G Zi( )( )+ 1− yi( )n 1− G Zi( )( ) (2) where, 0 1iy≤ ≤ denotes the dependent variable equivalent to EFF _ EST in the present study, while Zi refers to the explanatory variables of observation i equivalent to DATAYEAR and Xk in the present study. Accordingly, the specification above is well defined for0<G Zi( )<1. The QMLE of β or α in equation 1 is obtained by simply maximizing equation 2 [that is., max β or α Li β or α( ) l=1 N ∑ ]. Papke and Wooldridge concluded that Bernoulli QMLE β or α is consistent and N - asymptotically normal regardless of the distribution of iy conditional on Zi , while no special data adjustments are needed for the extreme values of zero and one for iy . The conditional expectation of iy given the explanatory variables according to the authors are estimated directly. iy could be a continuous variable, a discrete variable, or have both continuous variable and discrete characteristics. Asymptotically efficient, unbiased and consistent estimator is achieved in QMLE by simply transforming the G Zi( ) to produce models similar to either logit or probit in the binary choice situation (McDonald, 2009). Cox (1996) and Papke and Wooldridge (1996) proposed different specification for G Zi( ) such as logistic or probit distribution. However, Papke and Wooldridge use logistic function for G Zi( ) within the framework of generalized linear
  • 13. 13 models (GLM) [that is.,G Zi( )= exp Zi( ) 1+ exp Zi( ) ] which was extensively discussed in their paper and implemented in STATA software used for the empirical analysis in this paper. 8 QMLE is estimated by weighted non-linear allowing for heteroskedasticity and testing procedures, which are asymptotically efficient within a class of estimators (Oberhofor and Pfaffermayer, 2009). 9 Therefore, the meta-QMLE regression employed for the empirical analysis is implicitly specified below. E EFF _ ESTir Zi( )= G ψ0 + βDATAYEARir + αk Xkir k=1 K ∑ + εir ⎛ ⎝⎜ ⎞ ⎠⎟ t= 1967, … 2012 (3) where, EFF _ ESTir , DATAYEARir , and Xkir are as defined earlier and Zi = DATAYEARi , Xki ⎡⎣ ⎤⎦ ′ ; ( ).G is the logistic function. Because many of the studies reported more than one efficiency estimates, Espey et al., (1997) argue that lack of independence in the values of the dependent variable across observations is one of the problem of meta-regression analysis (MRA), which likely to biased standard errors of equation 3. That said, Nelson and Kennedy (2009) suggest the use of weighted regression technique to eliminate lack of independence in the values of the dependent variable of MRA, which Stanley (2008) also argue can potentially be use to lessen publication bias in MRA. In addition, Stanley and Doucouliagos (2013) argue that weighted regression-MRA offers the best of both fixed effect and random effect MRA. However, unlike un-weighted regression, which gives equal weight to each observation, weighted regression also corrects for outliers and measurement errors by giving less weight to such outliers to ensure that potentially more reliable estimates are not confounded by observations subject to a larger variance. In view of this, we estimate equation 3 by taken sample sizes from the primary study as proxies for weights following the work of Stanley (2008) and Nelson and Kennedy (2009). 8 In STATA QMLE could be estimated using generalized linear model (glm) command with family (binomial), link (logit), and robust standard error option. 9 QMLE accommodates naturally, non-constant variances and skewness (Oberhofor and Pfaffermayer 2009).!!
  • 14. 14 5.0 Results and Discussion As a preliminary step before discussing the results of the findings, we follow the work of Stanley and Rosenberger’s (2009), Root-n-meta-regression analysis (MRA) approach to investigate the presence of publication selection bias using the relationship EFF _ ESTir = δi +δ0 1 ni ⎛ ⎝ ⎜ ⎜ ⎞ ⎠ ⎟ ⎟ +τi with 1 ni as measure of precision with which EFF _ EST has been estimated.10 The result of this auxiliary regression indicates the presence of publication bias represented by the significance of the estimated parameter δ0 at 1% level of significance, while there is presence of genuine empirical effect that goes beyond publication bias represented by the significance of the parameter δi at 1% level of significance. However, we did not investigate further the sources of potential publication bias, as this is not the focus of the present paper. Subsequent discussions address research questions in the study. 5.1. RQ1: What is nexus between mean efficiency estimates and year of survey?11 Before we provide answer to the first research question, we take a closer look at the distribution of the reported mean efficiency estimates from the primary study presented in Figure 1. The figure on the left hand side shows that the mean efficiency scores from all the selected primary study have a right-skewed distribution with most observations ranging from 0.52 - 0.99 and with an average of about 0.68 (see Table 1). This result is not surprising because, a large number of studies place efficiency score of agriculture and food production in the developing countries in the range of 0.60-0.85 (for details see, Bravo-Ureta and Pinheiro, 1993; Thiam et al., 2001; Ogundari et al., 2012). That said, for the institution responsible for agricultural and food policy design in Africa, it is very important to note that 0.68 average mean efficiency levels obtained the present study is an indication that there is ample room for improvement of agriculture and food production in Africa. In addition, the results imply that there is need to focus attention on investments that will push African agriculture towards the existing frontier. Hence, a search of literature shows that the average 10 The Root-n-MRA approach was estimated using weighted regression with “ n ” as the weight, while n is number of observation per efficiency estimate. For brevity, we did not present the result in the paper. The results can be made available upon request from the author. 11 As earlier mentioned, efficiency estimates in our case comprises of technical, allocative, economic (cost) and profit efficiency.
  • 15. 15 mean efficiency estimate obtained in the present study is lower than about 0.74 and 0.72 reported by Bravo-Ureta et al., (2007) and Ogundari and Brümmer (2011) from 14 and 124 published studies in Africa and Nigeria, respectively, while it is not different from 0.69 reported by Ogundari (2013) from 379 published frontier studies from Africa. Also, closely related, the distribution of the reported mean efficiency estimates are allowed to vary across the regions where the selected case studies were carried out, which is presented on the right hand side of Figure 1. In this case, the figure shows that studies from West Africa reported highest efficiency estimates within the range 0.50-0.90 and with a mean score of about 0.71, followed by North Africa (0.66), Southern Africa (0.65), East Africa (0.63), and Central Africa (0.54) countries in that order. However, in an attempt to provide answer to the first research question, we first present in Figure 2 the scatter plot of univariate relationship between reported mean efficiency estimates and year of survey (or year of data) in the primary study. Guided by the fitted line, the figure on the left hand side of Figure 2 shows a negative linear correlation relationship between reported mean efficiency estimates per study and year of survey for the whole sample under consideration. But when the relationship is allow to vary across the regions as presented on the right-hand side of Figure 2, we uncover evidence of linear negative correlation in the studies carried out in the West Africa, East Africa and Central Africa regions and positive linear correlation in the studies carried out in the Southern Africa and Northern Africa regions. Therefore, we augment the results of the scatter plot by using MRA based on equation 3, which is presented in Tables 2A and 2B. While Table 2A focuses on estimates from un- weighted fractional regression model, Table 2B is based on weighted fractional regression model with number of observations from the primary study as weight. And for each of the results in the tables, we estimate 5 different models to provide robustness check to the result of the coefficient of DATAYEARir , which happens to be the variable of interest designed to provide answer to the first research question using MRAin the study. In this regard, other variables included in MRA are considered as control variables, since studies have shown that efficiency estimates often differ across many dimensions other than year of primary survey, such as methodology used, data, functional forms, products, sample size, and geographical location among others (Thiam et al., 2001; Bravo-Ureta et al., 2007; Ogundari and Brümmer 2011). The first and second models focus on the primary studies from Africa but without and with the regional specific effects, respectively. The third model focuses on the selected case
  • 16. 16 studies from sub-Saharan Africa (SSA), while fourth and fifth models focus on the selected case studies published from 1984-2003 and 2004-2013, respectively. Thus, a closer look at the results obtained from both the un-weighted (i.e., Table 2A) and weighted (i.e., Table 2B) regressions shows that the mean efficiency estimates EFF _ ESTir from the selected case studies decrease significantly as survey year DATAYEARir in the primary study increases across all the models judging by the coefficient of DATAYEARir . Apparently, this implies that on average, the mean efficiency levels of African agriculture and food production reported by the empirical studies has been declining or lags behind the best – practice frontier over the years.12 This perhaps is an indication that efficiency change contribute negatively to the African agricultural productivity growth over the years, which also aligns strongly with Mugera and Oyede’s (2013) argument that in the context of African agriculture, declines in efficiency and negative growth of TFP are possible. To sum up, we find that the MRA result in the present study conform with the results of the scatter plot earlier discussed as both findings lend support also to the findings of two recent cross-country analysis of TFP growth of African Agriculture and food production based on FAOSTAT data from 1961-2008 by Alene (2010) and Yu and Nin-Pratty (2011). The authors found evidence that change in efficiency contributes negatively to agricultural productivity growth over the years in the region. Given these, the contribution of efficiency to the growth (or development) of African agriculture and food production is apparently negative from both the meta-analysis results in the present study and the cross-country studies highlighted above. 13 The implication of this is that if food insecurity problem in Africa is to be addressed, then policy challenge is to be able to identify factors driven efficiency levels of African agriculture and food production that can be explore to improve its growth (or development) in the region. These drivers will be discussed in section 5.3 of this paper. 5.2. RQ2: Are there differences in mean efficiency estimates across other study attributes? Before we address the second research question, it is important to mention that looking through the results presented in Tables 2A and 2B, there is a significant major differences 12 As noted by Ogundari and Brümmer (2011), in the absence of reliable panel data, it is possible to interpret the relationship between efficiency scores reported in the primary studies and the survey year or year of data in the case studies as an implicit indicator of efficiency change over time. 13 TFP growth is driven by four distinct components namely efficiency change, technical change (or technology change), scale efficiency and allocative efficiency change in puts and outputs (Kumbhakar and Lovell 2000).
  • 17. 17 between the two. Nevertheless, because of the potential advantage of weighted regression as earlier discussed, we address the second research question of the study using results of Table 2B. In this regard, the parameters of models 1 through 3 have similar significant results with similar pattern, while models 4 and 5 due to different time period covered gave slightly different results, especially model 4 as model 5 strongly align with the results of models 1-3. That said, the results show that studies published in journal (D_JOURNAL), with parametric method (D_PARAMETRIC), with panel data (D_PANELDATA), with single output or un- aggregated output (D_OUTPUT) yield significantly higher mean efficiency estimates than studies not published in journals, with non-parametric, with cross-sectional data, and aggregated output, respectively across. The coefficient of panel data (D_PANELDATA) is insignificant in models 1, 3 and 4 but significant in model 2 and 5, while coefficient of D_JOURNAL, D_PARAMETRIC, and D_OUTPUT are statistically significant in all the models with exception of coefficient of D_PARAMETRIC, which is not significant in model 4. And, looking through the literature, we notice that Thiam et al., (2001) and Bravo-Ureta et al., (2007) found evidence that studies with cross sectional data report significantly lower efficiency estimate compared to studies with panel data in their respective studies, thus confirming the result of the present study. Also, closely related, Bravo-Ureta et al., (2007) found evidence that studies with non-parametric specification reports higher efficiency estimates, which contradict the present finding.14 Furthermore, we find that studies with large degree of freedom (DF) shows significantly lower mean efficiency estimates in all the models with exception of model 4. Likewise, our findings show that studies with Cobb-Douglass (D_COBBDOUGLAS) and Translog (D_TRANSLOG) functional forms were insignificantly different from those that uses other functional form and with no functional forms, especially in all the models with exception of model 4. Also, we find that studies published in top ranking journals (D_IMPACTFACTOR) reported lower and insignificant mean efficiency estimates in all the models with exception of model 4 that gives significant result, compared to studies with no impact factors. Studies with a focus on grain crops (D_GRAIN) reported lower and significant efficiency estimates, compared to non-grain crops studies, while studies with a focus on food crops (D_FOODCROP), and cash crop (D_CASHCROP) yield insignificantly lower mean 14 Since most if not all the previous studies highlighted in the text employed un-weighted regression, it is most likely to find it difficult to compare the result of the present study that is based on weighted regression to many of these previous studies. For example, we find that many of the significant results in Table 2A actually align strongly with the significant results reported in many of the previous studies.
  • 18. 18 efficiency estimates compared to studies with non-food crops, respectively across all the models. By contrast, studies with a focus on cash crop were found to have higher and significant efficiency estimates by Ogundari and Brümmer (2011). But similar to the finding of the present study, Bravo-Ureta et al., (2007) found consistently lower mean efficiency scores for studies with a focus on grain crops. While, no regional effects was considered in model 1, the empirical results show that countries in the East Africa (D_EAST) and Central Africa (D_CENTRAL) regions report significant lower mean efficiency estimates, while countries in the Southern Africa (D_SOUTHERN), and North Africa (D_NORTH) yield lower and insignificant mean efficiency estimates compared to countries in the West Africa (D_WEST) region especially in models 2, 3 and 5. The implication of this finding is that regional differences to some extend play a significant influence in the systematic heterogeneity that exist in the reported mean efficiency estimates conditional on study-specific attributes in the study. Interestingly, Bravo- Ureta et al., (2007) found significant differences in reported efficiency estimates across the region and income groups considered in their study.15 5.3. RQ3: What drives African agriculture and food production efficiency over the years? In an attempt to provide answer to the third research question, we specially construct a database to identify variables that are associated with the decision-making units (i.e., farmers) from the primary study, but had positive or negative significant effects on African agriculture and food production efficiency over the years. The idea is to be able to synthesis important socio-demographic variables of the decision-making units (DMU) or farmers that are key to improving/increasing agricultural efficiency levels, which could serve as guide to agricultural policy design and implementation in the continent in the future. This is important because literature identified socio-demographic variables of the DMU such as age, years of experience, educational level, etc. as the underlying causes of deviation from the frontier (Kumbhakar and Lovell, 2000; Coelli et al., 2005). In this regard, Bravo-Ureta et al., (2007) stressed the importance of efficiency as a relative measure of managerial ability for a given technology, which could be related to a set of control variables associated with the decision-making unit (or farmers). 15 Bravo-Ureta et al., (2007) employed efficiency studies from both the developed and developing agriculture, which probably explain the significant of the regional dummies in their study.
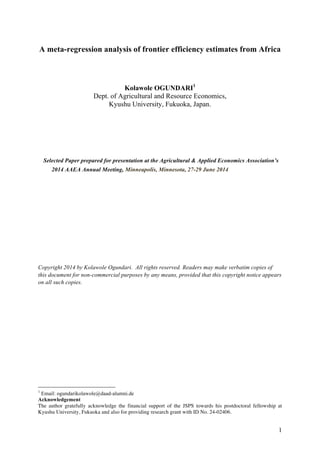
  • 19. 19 To this end, our database shows that out of the 612 farm level mean efficiency estimates from the 442 selected frontier studies, only 439 estimates sought to explain the sources of variation in the efficiency level from the primary study. Thus, the database shows that variable postulated to affect the efficiency levels of the respondents in the primary study varies from region to region and this includes age, years of experience, educational level, health, occupation (farming as a major occupation), and gender (male) of the farmers in the primary study. Others include credit, extension activity, crop diversification, distant of the farm to market, membership of cooperative society, farm size, land tenure, age of the farm, crop rotation, and among others. However, Figure 3 shows the distribution of the socio- demographic variables of the respondents (farmers) from the primary study identify from the primary studies as the key drivers of African Agricultural efficiency over the years. Because of few significant observations recorded in many of the identified variables, couple with the fact that in many of the selected case studies, some of these variables were not jointly considered by the primary researchers, the figure contains variables with highest percentage of occurrence for both the positive and negative significant effect on the efficiency estimates reported in the primary studies.16 Since, our interest is to identify the drivers of efficiency level of African agriculture and food production as retrieved from the primary studies, subsequent discussions are based on the variables with positive and statistical effect in Figure 3. In this regards, the result shows that 41% of the 439 estimates identify education as a major driver of efficiency level of African agriculture over the years. This was followed by year of farming experience (28%); contact with extension agents (23%), age of the farmer (22%), credit (15%), household size (15%), gender-male (12%), membership of cooperative society (9%), and farm size (8%). Other analysis shows that 16%, 13%, and 11% of the 439 estimates recognized joint significance influence of education and experience, education and extension, and education and age on the efficiency level of African agriculture and food production over the years. However, these factors can be broadly characterized to what Fugile and Wang’s (2012) termed the enabling environment essential to enhance agricultural productivity in terms of dissemination of new technologies and practices to the farmers. 16 The statistics presented in Figure 2 should be view as a multiple-choice response. In this regard, the percentage short fall of each of the variable presented in the figure from 100% mark cannot be interpreted as indicator of studies that did not identify the variable in explaining efficiency levels in the primary studies.
  • 20. 20 Therefore, the highest ranking of education is a further confirmation of Philips’s (1994) argument that “there is a general consensus that education has a positive effect on agricultural productivity and efficiency”. Also, the ranking of experience after education lends support to Huffman’s (2001) suggestion that in some agricultural environments, experience and education are likely to be the most important form of human capital for enhancing the efficiency level of a producing unit in either a static or dynamic environment. Also, closely related, the ranking of age as fourth most important driver of efficiency levels of agriculture and food production in Africa can be attributed to the fact that age is considered in many studies as a proxy for farming experience in the economic literature. According to Ogundari et al., (2012), one possible reason why a number of studies identified age as a key determinants could be as a result of the perceived correlation between experience and age of the primary respondents in the selected studies. Furthermore, identification of extension service (a proxy for agricultural education) as third most important factor driving efficiency levels of African agriculture, underscores the relevance of extension as inevitable vehicle for disseminating breakthrough technologies and innovation to farmers that should be intensify vigorously in Africa. Thus, we believe the findings have a number of policy implications, in particular policy relevance of education in increasing agricultural production and productivity in Africa. Also, the results attest to the crucial role of other human capital indicators such as farming experience and extension, which are mainly related to training in new agricultural technologies to increase agricultural productivity in the region. While Pudasain (1983) argued that education contributes to agricultural production and productivity much higher in modernize environment, which highlight the role of investment in technology, Otsuka (2013) suggests that what is needed in SSA is an effective extension system to disseminate the potentially productive technology in the region. The author argues further that the vision of the appropriate technologies and their dissemination strategies are still missing or at best weak in SSA. While we acknowledge that the findings from the present study has been established in the literature on the efficiency of developing agriculture (see; Weir and Knight, 2000; Asadullah and Rahman, 2005; Ogundari and Brümmer, 2001; Ogundari et al., 2012), the present review should be seen as a confirmation of the need to effectively foster agricultural policies that embraces human capital development in the region and sub Saharan Africa (SSA) in particular.
  • 21. 21 Given the evidence from this study that gains in African agricultural efficiency are associated closely with farmers’ education over the years, the crucial question is, what exact role does education play to increase agricultural productivity in Africa? Pudasaini (1983) and Reimers and Klasen (2011) highlighted a number of roles, which education play in increasing agricultural production. First, education helps farmers become better managers of limited resources by enhancing their decision-making skills. Second, education enhances farmers access to information on low-cost and sustainable alternatives, that could potentially help them pay and receive better prices for inputs used and outputs sold, thus making education a remedy to prevailing information asymmetries in the market. Third, education helps farmers adapt new technologies faster to have a first mover advantage. Fourth, education helps farmers to prefer riskier production technologies since they are able to evaluate adequately the implied opportunities. 6.0 Conclusions The paper attempts to shed light on whether efficiency estimates of African agriculture improve or decline and what drives the efficiency levels from three decades (1984-2013) of research on productivity of African agriculture. We employ meta-regression analysis (MRA) on a total of 442 studies resulting in 612 farm level efficiency estimates for the analysis, given that some studies reported more than one estimates. The studies cut across all the regions in the continent with 30 countries represented. Taken together, the overall mean farm level efficiency estimates of about 0.68 was obtained from the case studies, which indicates that there is scope to improve efficiency level of African agriculture as about 32% cost saving could be achieved if agricultural production is on the frontier level in the region. The results of MRA show that mean efficiency estimates of African agriculture from the primary studies decrease significantly as year of survey in increases. Apparently, this implies that over the years, negative efficiency change characterized development of African agriculture and food production. Also, the results of other study attributes considered in MRA other than the survey years, show that studies published in journal, with parametric method and with panel data significantly report higher mean efficiency estimates, while studies with a focus on grain crops and with higher degree of freedom significantly yield lower efficiency estimates. The variation in reported efficiency estimates is significantly lower among countries from the Eastern and Central Africa regions, compared to studies from Western Africa region taken as reference.
  • 22. 22 Other results identify key drivers of efficiency levels of African agriculture and food production over the years to be education, years of experience, extension, credit, farm size and membership of cooperative society. These findings have policy implications for strengthening food security through increase in efficiency of African agriculture and food production. Besides, the results could be very useful for researchers and academicians to enable them identify study-specific attributes, essential for modeling farm level efficiency and to evaluate the sensitivity of their results to the choice of model specification and method in the region and elsewhere around the world. Given these findings, the potential role of agriculture in reducing poverty and enhancing food security will not materialize without concerted and purposeful policy action that is align with the identified drivers of efficiency of African agriculture obtained in the present study. However, this points to the needs for programmes and policies that will boost agricultural efficiency levels and thus, productivity in the region. In this case, we suggest policies that focus on improvement in extension services, introduction of incentives that will encourage young, able and educated individuals with basic education to go into farming, and introduction of robust training program for farmers on modern technology through activities of extension. These policies should be seen as critical components of program that will enable smallholder farms to be more efficient in the region. Reference Alston, J. M., M. C. Marra, P.G. Pardey and T. J. Wyatt (2000). Research Returns Redux: A Meta-Analysis of the Returns to Agricultural R & D. The Australian Journal of Agricultural and Resource Economics, Vol.44 (2): 185-215. Alene, A. D. (2010). Productivity Growth and the effects of R&D in African Agriculture. Agricultural Economics, Vol. 41: 223-238. Asadullah, M. N, S. Rahman (2005). Farm productivity and Efficiency in Rural Bangladesh: The role of Education Revisited. Working paper CSAE WPS/2005-10, Center for the study of African Economies, University of Oxford. Battese, G. E. (1992). Frontier production functions and technical efficiency: a survey of empirical applications in agricultural economics. Agricultural economics, Vol.7: 185- 208. Bravo-Ureta, B. E., D. Solis, V.H. Moreira Lopez, J. F. Maripani, A. Thiam and T. Rivas (2007). Technical Efficiency in Farming: A Meta-Regression analysis. Journal of Productivity Analysis, Vol. 27: 57-72.
  • 23. 23 Bravo-Ureta, B. E., and Pinheiro, A. E. (1993), ‘Efficiency analysis of developing country agriculture: a review of the frontier function literature’, Agricultural Resources Economics Review, Vol 22, pp 88–101. Brümmer, B (2006). Food Policy to alleviate rural poverty: the potential contribution of productivity growth in Agriculture and agricultural trade linearization, Quarterly Journal of international Agriculture, Vol. 45(1): 1-6. Chen, P-C., S-T. Chen and C-C. Chen (2012). Energy consumption and economic growth- New evidence from meta-analysis, Energy policy, Vol. 44: 245-255. Coelli, T. J., Rao, D. S. P., O’Donnell, C. J., and Battese, G. E. (2005), An Introduction to Efficiency and Productivity Analysis, 2nd edition, Springer, New York. Cox, C. (1996). Nonlinear quasi-likelihood models applications to continuous proportions. Computational Statistics & Data Analysis 21: 449-461. Darku, A. B., S. Malla and K. C. Tran (2013). Historical review of Agricultural Efficiency Studies. CAIRN Research Network. de Dominicis, L., R. J. G. M. Florax and H. L. F. de Groot (2008). A meta-analysis on the relationship between income inequality and Economic Growth. Scottish Journal of Political Economy Vol. 55(5): 654-682. Espey, M., J. A. and W. Shaw (1997). Price elasticity of residential demand for water: a meta- analysis. Water Resource, Vol. 33(6): 1369-1374. Florax, R. J. G. M, C.M. Travisi and P. Nijkamp (2005). A meta-analysis of the willingness to pay for reductions in pesticide risk exposure, European Review of Agricultural Economics, Vol. 32(4): 441-467. Fugile, K and S. L. Wang (2012). Productivity Growth in Global Agriculture shifting to developing countries. Choices 4th Quarter, Vol. 27(4). Fried, H. O (2008). Efficiency and production. In Fried, H. O., C.A.K. Lovell and S.S. Schmidt (eds.), measurement of productive efficiency and productivity growth, Oxford University Press, New York. Gallet, C (2010a). Meat Meets Meta: A quantitative Review of the Price Elasticity of meat. American Journal of Agricultural Economics, 92(1): 258-272. Gallet. C.A (2010b). The income elasticity of meat: a meta-analysis. The Australian Journal of agricultural and Resources Economics, 54:477-490. Gallet, C. A. (2007). The Demand for Alcohol: A Meta-Analysis of Elasticities. Australian Journal of Agricultural and Resource Economics 51(2): 121–35.
  • 24. 24 Gallet, C. A., and J. A. List. (2003). Cigarette Demand: A Meta-Analysis of Elasticities. Health Economics 12(10): 821–35. Gallup, J., S. Radielet, and A. Warmer (1997). Economic growth and income of the poor. CAER Discussion paper No.36, Harvard Institute for International Development, Cambridge MA USA. Hoff, A (2007). Second stage DEA: comparison of approaches for modeling the DEA score. European Journal of Operational Research, Vol. 181: 425-435. Huffman, W. E (2001). Human capital: Education and Agriculture. In B.L. Gardner and G. C. Rausser (eds). Handbooks of Agricultural Economics, Vol. 1A, Elsevier, Amsterdam. Josheski, D and D. Lazarov (2012). Exchange rate volatility and trade: a meta-regression analysis, GRP International Journal of Business and Economics, Vol. 1(2): 24-49. Kieschnick, R and B. D. McCullough (2003). Regression analysis of variates observed on (0,1): percentages, proportions and fractions. Statistical Modeling 3: 193-213. Kumbhakar, S. C., F. Asche and R. Tveteras (2013). Estimation and decomposition of inefficiency when producers maximize return to outlay: an application to Norwegian fishing trawlers. Journal of Productivity Analysis. DOI 10.1007/s11123-012-0336-5. Kumbhakar, S. C., and Lovell, C. A. K. (2000), Stochastic Frontier Analysis, Cambridge University Press, Cambridge. Longhi, S., Nijkamp, P. and Poot, J. (2005) A Meta-Analytic Assessment of the Effect of Immigration on Wages. Journal of Economic Surveys 19(3): 451-477. Martin, W (2013). Productivity Growth, Trade and Poverty. Paper presented at the IARTC meeting Seville, 3rd June 2013. Marshall, A (1920). Principles of Economics, 8th edition. London: Macmillan & Co Ltd. Mekasha, T. J and F. Tarp (2013). Aid and Growth: What meta-analysis reveals. The Journal of Development Studies, 49 (4): 564-583. McDonald, J (2009). Using least squares and Tobit in second stage DEA efficiency analysis, European Journal of Operational Research, Vol.197: 792-798. Mugera, A and A. Ojede (2013). Technical efficiency in African Agriculture: Is it catching up or lagging behind? Journal of International Development. Do1:10.1002/jid.2907. Moore, W and C. Thomas (2010). A meta-analysis of the relationship between debt and growth, International Journal of Development Issues, Vol. 9(3): 214-225. Nelson, J.P. and P. E. Kennedy (2009). The use and abuse of meta-analysis in environmental and natural resource economics: An assessment. Environmental and Resource Economics, Vol. 42(3): 345-377.
  • 25. 25 Nishimizu, M and J. Page (1982). Total factor productivity growth, technological progress, and technical efficiency change: dimensions of productivity change in Yugoslavia, 1965-1978, Economic Journal, 92: 920-936. Oberhofer, H and M. Pfaffermayr (2009). Fractional response models-A replication exercise of Papke and Wooldridge (1996). A working paper in Econometrics and Statistics, University of Innsbruck No.2009-02. O’Donnell, D. J (2010). Measuring and decomposing agricultural productivity and profitability change, Australian Journal Agricultural Resource Economics, Vol. 54: 527-560. Ogundari, K (2013). The Paradigm of African Agricultural Efficiency, 1967-2012: What does meta-analysis reveal? Paper presented at 7th International conferences organized by the Meta Analysis of Economic Research Network (MAER-Net) at University of Greenwich, 5-7 Sept. http://www2.gre.ac.uk/about/schools/business/services/events/current/maer- net/conference-themes. Ogundari, K. and A. Abdulai (2013). Examining the Heterogeneity in Calorie-Income Elasticities: A meta-analysis. Food Policy: Vol. 40: 119-128. Ogundari, K., T. T. Amos and V.O. Okoruwa (2012). A review of Nigerian agricultural production efficiency literature, 1999-2011: What does one learn from frontier studies? African Development Review, Vol. 24(1): 93-106. Ogundari, K and B. Brümmer (2011). Technical efficiency of Nigerian Agriculture: A meta- regression analysis. Outlook on Agriculture, Vol. 40 (2): 171-180. Otsuka, K (2013). Food security, Income, Inequality and the Changing comparative Advantage in World Agriculture. Agricultural Economics, Vol. 44: 1-12. Papke, L. S and J. M. Wooldridge (1996). Econometric methods for fractional response variables with an application to 401(K) plan participation rates. Journal of Applied Econometrics, Vol.11: 619-632. Philips, J.M (1994). Farmer Education and farmer efficiency: a meta-analysis, Economic Development and Cultural Change, Vol. 4391): 149-165. POSTnote (2006). Food security in developing countries, Published by Parliamentary office of Science and Technology, UK, Issues No. 274. Pudasaini, S. P (1983). The effects of education in Agriculture: Evidence from Nepal. American Journal of Agricultural Economics, Vol. 65(3): 509-515.
  • 26. 26 Reimers, M and S. Klasen (2011). Revisiting the role of education for Agricultural productivity, Courant Research Center, Discussion paper No. 90, Georg-August University of Goettingen, Germany. Romalho, E. A., J.J.S. Ramalho and P. D. Henriques (2010). Fractional regression models for second stage DEA efficiency analyses, Journal of Productivity Analysis, Vol. 34: 239-255. Stanley, T. D and H. Doucouliagos (2013). Neither fixed nor random: Weighted Least Squares Meta-analysis. School Working paper (SWP) 2013/1, Faculty of Business and Law, School of Accounting, Economics and Finance, Deakin University Australia. Stanley, T. D and R. S. Rosenberger (2009). Are recreation values systematically under estimated? Reducing publication selection bias for benefit transfer. A paper presented at the 2009 MAER-Net Colloquium, Corvallis Oregon USA. Stanley, T.D (2008). Meta-regression methods for detecting and estimating empirical effects in the presence of publication selection. Oxford Bulletin of Economics and Statistics Vol. 70: 103-127. Sterne, J. A. C. (2009), Meta-Analysis in Stata: An Updated Collection from the Stata Journal, Stata Press, College Station, TX. Thiam, A., Bravo-Ureta, B. E., and Rivas, T. (2001), ‘Technical efficiency in developing country agriculture: a meta-analysis’, Agricultural Economics, Vol 25, pp 235–243. Weir, S. and J. Knight (2000). Education Externalities in Rural Ethiopia: Evidence from Average and Stochastic Frontier Production Functions. Working Paper CSAE WPS/2000.4, Centre for the Study of African Economies, University of Oxford. Yu, B and A. Nin-Pratt (2011). Agricultural Productivity and Policies in sub Saharan Africa. IFPRI Discussion paper No. 01150 Washington DC.
  • 27. Table&1:&Summary&statistics&of&variables&used&in&meta7regression&analysis&(MRA)& Category)) Description) Variable) Mean) SD) Efficiency&Score& Mean&efficiency&score&reported&(Dependent(variable)& EFF_EST& 0.6822& 0.1749& Data& Average&year&of&the&data&that&a&primary&study&used& Articles&with&panel&data& Articles&with&cross7sectional&data& Degree&of&Freedom& DATAYEAR& D_PANELDATA& D_CROSSDATA& DF& 2005.5& 0.0507& 0.9493& 261.28& 5.5349& 0.2195&&&&&&&&&&&&&&&&&&&&&&&&&&&&&&&&&&&&&&&&&&&&&&&&&&&&&&&&&&&&&&&&&&&&& 0.2195& 749.57& Output&measure& Articles&with&single&output&measure/&un7aggregated&output& D_OUTPUT& 0.7941& 0.4047& Publication& Journal&Articles& Articles&in&top&ranking&journal&& D_JOURNAL& D_IMPACTFACTOR& 0.8839& 0.1258& 0.3205& 0.3319& Specification& Articles&with&Cobb7Douglas&functional&form& Articles&with&Translog&functional&form& Articles&with&other&Functional&forms&and&with&no&functional&form& D_COBBDOUGLAS& D_TRANSLOG& D_NOFUNCTION& 0.7075& 0.2239& 0.1046& 0.4553& 0.4172& 0.3062& Methodology& Articles&with&parametric&method& Articles&with&non7parametric&method& D_PARAMETRIC& D_NONPARAMETRIC& 0.8922& 0.1078& 0.3104& 0.3104& Technology& Articles&with&Primal&Technology&representation& Articles&with&Dual&Technology&representation& D_PRIMAL& D_DUAL& 0.8791& 0.0964& 0.2954& 0.2954& Product& Articles&with&focus&on&Grain&crop&production& Articles&with&focus&on&Food&crop&production& Articles&with&focus&on&Cash&crop&production& Articles&with&focus&on&non7crop&production&(livestock,&fish&etc.)& D_GRAIN& D_FOODCROP& D_CASHCROP& D_NONCROP& 0.2942& 0.7467& 0.1160& 0.1519& 0.4560& 0.4352& 0.3205& 0.3593& Region& Articles&carried&out&in&East&Africa& Articles&carried&out&in&Central&Africa& Articles&carried&out&in&Southern&Africa& Articles&carried&out&in&North&Africa& Articles&carried&out&in&West&Africa& D_EAST& D_CENTRAL& D_SOUTHERN& D_NORTH& D_WEST& 0.1863& 0.0212& 0.0686& 0.0408& 0.6846& 0.3896& 0.1443& 0.2530& 0.1981& 0.4650&
  • 28. 28 Table&2A:&Meta7regression&results&without&weight& EXPLANATORY& VARIABLES& & ALL&AFRICA:&& Without&Regional&Effects& ALL&AFRICA:&& With&Regional&Effects& SSA&REGION&& ONLY& PERIOD&OF&PUBLICATION& 198472003& PERIOD&OF&PUBLICATION& 200472013& Model&1& Model&2& Model&3& Model&4& Model&5& Coefficient( Std.(Error( Coefficient( Std.(Error( Coefficient( Std.(Error( Coefficient( Std.(Error( Coefficient( Std.(Error( DATAYEAR& 50.0198***) 0.0061) 50.0205***) 0.0059) 50.0266***) 0.0059) 50.0356***) 0.0075) 50.0215**) 0.0087) D_PANELDATA& &0.4884& 0.2006& &0.1028& 0.1304& &0.0115& 0.1389& 70.4445& 0.7045& &0.1371& 0.1279& DF& 70.0001*& 0.0000& 70.0001*& 0.0000& 70.0001*& 0.0000& 70.0005& 0.0003& 70.0001**& 0.0000& D_JOURNAL& &0.3426**& 0.0962& &0.1988**& 0.1020& &0.1716*& 0.1044& &0.6260& 0.4043& &0.2062**& 0.1042& D_IMPACTFACTOR& 70.1784*& 0.0963& 70.0746& 0.1003& 70.1039& 0.1024& 70.9398***& 0.1911& &0.0198& 0.1146& D_COBBDOUGLAS& 70.2313& 0.1652& 70.3641**& 0.1681& 70.3442**& 0.1708& &2.0351**& 0.9054& 70.4452***& 0.1732& D_TRANSLOG& 70.2637*& 0.1535& 70.3538**& 0.1545& 70.3644**& 0.1573& &1.0570& 0.8882& 70.3784**& 0.1593& D_PARAMETRIC& &0.4884**& 0.2006& &0.5549***& 0.1995& &0.6357***& 0.2065& 70.7140& 0.8586& &0.5275***& 0.2154& D_PRIMAL& &0.2094**& 0.1059& &0.2504**& 0.1029& &0.2293**& 0.1031& 70.1815& 0.4280& &0.2945***& 0.1057& D_OUTPUT& &0.2288**& 0.0966& &0.2609***& 0.0953& &0.2961***& 0.0969& 70.3187*& 0.1852& &0.2588***& 0.0994& D_GRAIN& 70.0781& 0.0817& 70.0993& 0.0809& 70.1156& 0.0829& &1.0739***& 0.3601& 70.0788& 0.0833& D_FOODCROP& 70.0667& 0.1157& 70.0376& 0.1150& 70.0323& 0.1157& 71.1033& 0.7389& 70.0019& 0.1149& D_CASHCROP& 70.1113& 0.1417& 70.0914& 0.1422& 70.0199& 0.1484& 70.2861& 0.7869& 70.0319& 0.1429& D_EAST& 7& 7& 70.3135***& 0.0854& 70.3122***& 0.0860& 70.0865& 0.2213& 70.3504***& 0.0891& D_CENTRAL& 7& 7& 70.7127***& 0.2139& 70.7109***& 0.2011& No&case&study& 70.7904***& 0.2187& D_SOUTHERN& 7& 7& 70.1923& 0.1243& 70.1884& 0.1249& 70.8310***& 0.3564& &0.0693& 0.451& D_NORTH& 7& 7& 70.2351& 0.1567& Not&part&of&SSA& No&case&study& 70.2855*& 0.1519& CONSTANT& 39.783***& 12.121& 41.295***& 12.029& 53.468***& 11.757& 72.408***& 14.894& &43.257***& 17.480& LOG_PSLIKELIHOOD& 7268.82& 7267.45& 7255.99& 716.48& 7249.11& DEVIANCE& 85.00& 82.25& 79.08& 1.85& 76.71& PEARSON& 80.80& 78.69& 75.49& 1.86& 73.46& (1/DF)&DEVIANCE& 0.1421& 0.1385& 0.1387& 0.0638& 0.1392& (1/DF)&PEARSON& 0.1351& 0.1325& 0.1325& 0.0641& 0.1333& AIC& 0.9243& 0.9328& 0.9301& 1.4178& 0.9388& BIC& 73752.20& 73729.29& 73554.68& 7107.22& 73418.77& #&OBSERVATION& 612& 612& 587& 043& 569& Note:(***,(**,(*(implies(that(the(estimated(parameters(are(significantly(different(from(zero(at(1%,(5%,(and(10%(significance(level,(respectively.(Standard(errors(reported(are(robust(standard(errors.
  • 29. 29 Table&2B:&Meta7regression&results&with&weight& EXPLANATORY& VARIABLES& & ALL&AFRICA:&& Without&Regional&Effects& ALL&AFRICA:&& With&Regional&Effects& SSA&REGION&& ONLY& PERIOD&OF&PUBLICATION& 198472003& PERIOD&OF&PUBLICATION& 200472013& Model&1& Model&2& Model&3& Model&4& Model&5& Coefficient( Std.(Error( Coefficient( Std.(Error( Coefficient( Std.(Error( Coefficient( Std.(Error( Coefficient( Std.(Error( DATAYEAR& 50.0339***) 0.0096) 50.0342***) 0.0095) 50.0393***) 0.0099) 50.0368***) 0.0077) 50.0416***) 0.0141) D_PANELDATA& &0.2881& 0.1829& &0.2815*& 0.1649& &0.2579& 0.1684& 70.4544& 0.5653& &0.3255**& 0.1649& DF& 70.0001& 0.0000*& 70.0001**& 0.0000& 70.0001**& 0.0000& 70.0003& 0.0004& 70.0001**& 0.0000& D_JOURNAL& &0.3577***& 0.1303& &0.2666**& 0.1269& &0.2521**& 0.1275& &0.8957***& 0.2680& &0.2844***& 0.1265& D_IMPACTFACTOR& 70.1591& 0.2225& 70.1087& 0.2165& 70.1309& 0.2197& 70.8619***& 0.1679& 70.0606& 0.2329& D_COBBDOUGLAS& 70.1139& 0.2132& 70.2819& 0.2239& 70.2741& 0.2278& &2.2007**& 0.8827& 70.4137*& 0.2168& D_TRANSLOG& 70.0233& 0.1683& 70.1507& 0.1769& 70.1618& 0.1807& &1.3875& 0.8686& 70.2869*& 0.1647& D_PARAMETRIC& &0.9377***& 0.3315& &1.1102***& 0.3354& &1.1663***& 0.3392& 70.7710& 0.8578& &1.2862***& 0.3658& D_PRIMAL& 70.1886& 0.1946& 70.1322& 0.1829& 70.1304& 0.1795& 70.2226& 0.3305& 70.1267& 0.1817& D_OUTPUT& &0.3322**& 0.1501& &0.3383**& 0.1518& &0.3667**& 0.1536& 70.3442**& 0.1073& &0.3641**& 0.1560& D_GRAIN& 70.3927***& 0.1249& 70.3979***& 0.1258& 70.4192***& 0.1525& &0.8650***& 0.3413& 70.3995***& 0.1289& D_FOODCROP& 70.0376& 0.1414& 70.0257& 0.1478& 70.0209& 0.1492& 70.4193& 0.5049& &0.0022& 0.1514& D_CASHCROP& 70.2737& 0.1916& 70.2896& 0.2069& 70.2420& 0.2176& &0.4695& 0.5728& 70.2909& 0.2151& D_EAST& 7& 7& 70.3367***& 0.1368& 70.3369***& 0.1366& 70.1269& 0.1650& 70.3575***& 0.1440& D_CENTRAL& 7& 7& 70.5456***& 0.1993& 70.5634***& 0.1965& No&case&study& 70.5884***& 0.2101& D_SOUTHERN& 7& 7& 70.1064& 0.2343& 70.1078& 0.2300& 70.5809**& 0.2698& 70.1142& 0.2529& D_NORTH& 7& 7& 70.0363& 0.2214& Not&part&of&SSA& No&case&study& 70.0675& 0.2355& CONSTANT& 67.749***& 19.100& 69.212***& 19.284& 78.488***& 19.697& 73.546***& 15.324& &84.506***& 28.409& LOG_PSLIKELIHOOD& 7275.18& 7273.75& 7262.15& 717.40& 7254.97& DEVIANCE& 72.16& 69.31& 65.85& 1.04& 65.46& PEARSON& 67.64& 65.55& 62.30& 0.97& 62.14& 1/DF&DEVIANCE& 0.1207& 0.1167& 0.1155& 0.0360& 0.1188& 1/DF&PEARSON& 0.1131& 0.1104& 0.1093& 0.0335& 0.1128& AIC& 0.9450& 0.9534& 0.9511& 1.4607& 0.9595& BIC& 73765.05& 73742.22& 73567.91& 7108.03& 73430.02& #&OBSERVATION& 612& 612& 587& 043& 569& Note:(***,(**,(*(implies(that(the(estimated(parameters(are(significantly(different(from(zero(at(1%,(5%,(and(10%(significance(level,(respectively.(Standard(errors(reported(are(robust(standard(errors.(Weight(is(the(size( of(observation(in(the(primary(study.
  • 30. 30 Fig.1: Distribution of mean efficiency estimates from the selected case studies for the whole sample & also across the regions in Africa 0204060 Frequency 0 .2 .4 .6 .8 1 EFF_EST 02460246 0 .5 1 0 .5 1 0 .5 1 West_Africa East_Africa Central_Africa Southern_Africa North_Africa Density EFF_EST Graphs by region
  • 31. 31 Fig. 2: Scatter plot of the univariate relationship between the mean efficiency estimates and year of survey for the whole sample and the regions in Africa 0.2.4.6.81 1970 1980 1990 2000 2010 Data_Year EFF_EST Fitted values 0.510.51 1960 1980 2000 2020 1960 1980 2000 20201960 1980 2000 2020 West_Africa East_Africa Central_Africa Southern_Africa North_Africa EFF_EST Fitted values Data_Year Graphs by region