Recommended

Recommended
More Related Content
Viewers also liked
Recently uploaded
Recently uploaded (20)
Jarvis etal poster_aifrb_2010_29_sep2010
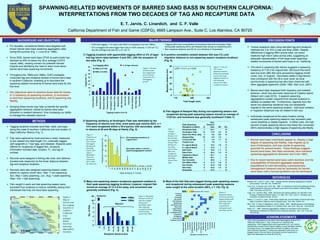
- 1. SPAWNING-RELATED MOVEMENTS OF BARRED SAND BASS IN SOUTHERN CALIFORNIA: INTERPRETATIONS FROM TWO DECADES OF TAG AND RECAPTURE DATA E. T. Jarvis, C. Linardich, and C. F. Valle L.G. Allen California Department of Fish and Game (CDFG), 4665 Lampson Ave., Suite C, Los Alamitos, CA 90720 BACKGROUND AND OBJECTIVES MAJOR FINDINGS DISCUSSION POINTS • 8,634 fish tagged; 11% return rate (82% of recaptures from the 1960s) • Tagging effort was concentrated at Horseshoe Kelp and Huntington Flats For decades, recreational fishers have targeted well- during peak spawning (42%) and Newport Bay during non-spawning (9%) Typical recapture rates using standard tag and recapture • 91% of tagged fish were bigger than size at 100% maturity (> 270 mm TL), known barred sand bass spawning aggregation sites and the average size was 321 ± 51 mm TL • Max recapture distance was 92 km (Los Alamitos to Oceanside) methods are 3 to 10% (Lowe and Bray 2006). Despite during the summer (Fig. 1; Love et al. 1996). differences in tagging effort across sites, we report 1) Tagging locations with appreciable tagging effort (≥ 3% of tags) 4) A positive correlation existed between fish size (TL) and relatively high return rates across sites, suggesting an Since 2000, barred sand bass CPUE by party boats has had tag return rates between 3 and 35%, with the exception of migration distance to non-spawning season recapture locations adequate representation of the large-scale spawning- declined by 65% to below the 30-yr average (CDFG two sites (Fig. 2). (Fig. 5). related movements of barred sand bass in so. California. unpub. data), causing concern for potential harvest % of tagging effort % of tags returned impacts and identifying the need to learn more about 40 50 Figure 5. Fish size The trend in spawning site returns suggests a spawning 1960s (n=4,725) Figure 2. Percent rs(57) = 0.31, p = 0.02 barred sand bass spawning movements. (TL) versus residency of 7-35 d for migrant fish. We found this trend Migration distance (km) 35 of barred sand 1990s (n=3,944) 40 migration distance 30 bass tagged and from peak spawning was true even after fish were grouped by tagging month Throughout the 1960s and 1990s, CDFG biologists Tagged fish (%) percent of tags returned by site season (Jun-Aug) (June, July, or August). Secondary peaks in tag returns conducted tag and recapture studies of barred sand bass 25 30 tagging locations to may correspond with the 28-d lunar cycle, as lunar and tagging in southern California, enabling us to document the 20 non-spawning period. season (Nov-Mar) synchronicity in spawning has also been observed with spawning-related movements of barred sand bass for the 15 20 recapture locations. other aggregate spawners (Zeller 1998, Starr et al. 2007). first time. 10 10 Barred sand bass displayed both migratory and resident 5 Our objectives were to examine these data for trends behavior, which has also been observed at Catalina Island in 1) residency at spawning locations, 2) movement 0 0 (Mason and Lowe 2010). It appears spawning San Onofre Oceanside San Clemente Huntington Flats Huntington Flats Newport Bay San Diego Bay Venice Beach South Carlsbad El Segundo Redondo Beach Horseshoe Kelp Tijuana Kelp Manhattan Reef to and from spawning locations, and 3) spawning site 175 350 525 aggregations contain migrants from several locations in fidelity. Total length (mm) addition to resident fish. Furthermore, migrants from the same non-spawning residence may not necessarily Studying these trends may help us identify the specific migrate to the same spawning location. Individual variation aggregation behavior utilized by barred sand bass in migration distances may be related to fish size. (transient or resident behavior), thus increasing our ability Tagging location (N to S) 5) Fish tagged at Newport Bay during non-spawning season and to manage this valuable resource. recaptured during peak spawning season moved an average of 17±5 km, and movement was generally southward (Table 1). Individuals recaptured at the same location during subsequent peak spawning seasons may represent year- METHODS 2) Spawning residency at Huntington Flats was estimated by the Avg. round residents or repeat migrants. In either case, the high frequency of returns over time; most same-year returns (82%, n = Peak Spawning Distance percent of peak spawning returns that these fish comprised Tagging locations included sand flats, reefs, and bays 141) were recaptured within a 35-d period, with secondary peaks Recapture Location N (km) SD Dir. (80%) demonstrates a high degree of spawning site fidelity. along the coast of southern California and one location in in returns at 28 and 56 days at liberty (Fig. 3). Table. 1. Horseshoe Kelp 1 24.1 -- N Average Baja California, Mexico (Fig. 1). Huntington Flats 13 17.6 2.2 N Figure 3. 30 recapture distances of Santa Ana River Jetty 3 8.0 0.0 N CONCLUSIONS Frequency of 35-d spawning residency of Newport Bay 19 0.5 1.5 -- Fish were captured by hook-and-line or trawl, measured barred sand Frequency of tag returns (%) tag returns 25 migrant fish? bass tagged in Corona Del Mar 2 2.4 1.1 S Barred sand bass individuals appear to display a high to the nearest mm total length (TL), externally tagged over time for Crystal Cove 1 1.6 -- S Newport Bay degree of spawning site fidelity, may migrate up to with spaghetti or T-bar tags, and released. Rewards were fish tagged during non- N. Laguna Beach 3 10.2 1.9 S during peak 20 tens of kilometers, and may reside at spawning offered for recaptures of tagged fish; recapture spawning S. Laguna Beach 1 12.9 -- S spawning Secondary peaks in returns . . . season (Nov- grounds for several weeks. These findings suggest information included date, location, TL, and tag ID season (Jun- 15 spawning aggregation pulses? Salt Creek 2 18.5 1.1 S Mar) and barred sand bass, like other serranids, form transient number. Aug) at recaptured Dana Point 6 20.4 1.3 S Huntington Capistrano Beach 1 24.1 -- S spawning aggregations (Domeier and Colin 1997). 10 during peak Flats and Middle Kelp 1 24.1 -- S Records were assigned a fishing site code, and distance recaptured spawning season (Jun- San Clemente 1 29.0 -- S Due to recent barred sand bass catch declines and the traveled was measured as the linear distance between there within 5 the same year. Aug). San Mateo Point 4 31.4 1.6 S susceptibility of transient aggregate spawning tag and recapture locations. San Onofre 5 32.8 0.9 S 0 populations to over-harvesting, a precautionary Barn Kelp 8 42.8 1.5 S management measure may be necessary for barred 105 112 119 21 35 42 56 70 84 91 14 28 49 63 77 98 7 Records were also assigned spawning season codes Oceanside 1 51.5 -- S sand bass until a harvest guideline can be developed. based on capture month (Nov.–Mar. = non-spawning, Days at liberty (7 d bins) Apr.–May = early spawning, Jun.–Aug. = peak spawning, Sept.–Oct. = late spawning). REFERENCES 3) Many non-spawning season recaptures appeared resident to 6) Most of the fish that were tagged during peak spawning season Domeier, M.L., and P.L. Colin. 1997. Tropical reef fish spawning aggregations: defined Fish caught in early and late spawning season were and reviewed. Bull. Mar. Sci., 60:698-726. their peak spawning tagging locations; however, migrant fish and recaptured during subsequent peak spawning seasons Love, M.S., A. Brooks, and J.R.R. Ally. 1996. An analysis of commercial passenger fishing excluded from analyses to reduce variability arising from moved an average of 13 ± 8 km away, and movement was were caught at the same location (80%, n = 132; Fig. 6). vessel fisheries for kelp bass and barred sand bass in the southern California Bight. individuals that may not have been spawning. generally northward (Fig. 4). Calif. Fish Game, 82:105-121. Figure 6. Lowe, C.G., and R.N. Bray. 2006. Movement and activity patterns. Pp. 524-553 in The Recapture matrix Ecology of California Marine Fishes (L.G. Allen, M.H. Horn, and D.J. Pondella, eds.), 40 Residents? Figure 4. Recapture Figure 1. 1960s distances of barred of barred sand bass University of California Press, 670 pp Map of tagged during peak Mason, T.J. and C.G. Lowe. Home range, habitat use, and site fidelity of barred sand bass 30 1990s sand bass tagged spawning season within a southern California marine protected area. Fish. Res, 106:93-101. barred sand 5 during peak (Jun-Aug) and Migrants? Starr, R.M., E. Sala, E. Ballesteros, and M. Zabala. 2007. Spatial dynamics of the Nassau bass tagging spawning season recaptured in No. of fish grouper, Epinephelus striatus, in a Caribbean atoll. Mar. Ecol. Prog. Ser., 343:239-249. locations in 4 (Jun-Aug) and subsequent peak recaptured during Zeller, D.C. 1998. Spawning aggregations: patterns of movement of the coral trout southern non-spawning spawning seasons. Plectropomus leopardus as determined by ultrasonic telemetry. Mar. Ecol. Prog. Ser., California. 3 162:253-263. season (Nov-Mar). Grey polygons 2 ACKNOWLEDGEMENTS 1 CDFG lead investigators for the barred sand bass tagging studies in the denote 1960s and 1990s were P. “Bud” Young and J.R. Raymond Ally, historical respectively. CDFG tagging efforts were augmented by R. Izor (Izorline 0 spawning International), Orange County Marine Institute, County Sanitation Districts 1-5 21-25 26-30 31-35 0 11-15 6-10 16-20 of Orange County, Los Angeles Rod and Reel Foundation, and many aggregation other individual volunteers. Funding was supported in part by the Los locations. Angeles County Fish and Game Commission and the Federal Aid in Recapture distance (km) Sport Fish Restoration Act Grant #F-50-R-20).