SlideShare uma empresa Scribd logo
1 de 39
REMOVAL OF PHENOL FROM
WASTEWATER USING
AGRICULTURAL WASTE
(CASHEWNUT SHELLS)
A GraduateProject Report submitted to ManipalUniversity in partialfulfilment
of the requirement for the award of the degree of
BACHELOR OF TECHNOLOGY
in
Chemical Engineering
Submitted by
Varsha Sudheer (110903248)
Kartik Kulkarni (110903014)
Under the guidance of
C.R.Girish
Assistant Professor – Senior Scale
Department of Chemical Engg.
MIT, Manipal
DEPARTMENT OF CHEMICAL ENGINEERING
MANIPAL INSTITUTE OF TECHNOLOGY
(A Constituent College of Manipal University)
MANIPAL – 576104, KARNATAKA, INDIA
May/July 2015
DEPARTMENT OF CHEMICAL ENGINEERING
MANIPAL INSTITUTE OF TECHNOLOGY
(A Constituent College of Manipal University)
MANIPAL – 576 104 (KARNATAKA), INDIA
Manipal
< 19.05.2015>
CERTIFICATE
This is to certify that the project titled REMOVAL OF PHENOL FROM
WASTEWATER USING AGRICULTURAL WASTE (CASHEWNUT SHELLS) is a
record of the bonafide work done by KARTIK KULKARNI & VARSHA SUDHEER
(110903014, 110903248 resp.) submitted in partial fulfilment of the requirements for the
award of the Degree of Bachelor of Technology (BTech.) in CHEMICAL
ENGINEERING of Manipal Institute of Technology Manipal, Karnataka, (A Constituent
College of Manipal University), during the academic year 2015-2016.
Mr C.R.Girish
Assistant Professor – Senior Scale
Prof. Dr. Harish Kumar
HOD, Chemical
M.I.T, MANIPAL
ACKNOWLEDGMENTS
It is said that what you have said is past and what you have done is history but
what you write lasts till the end. Hence I would like to take this opportunity to
thank some of the important people who made my project a fruitful experience
and express my sincere gratitude to all those who have been associated with my
project.
I express my special thanks to Mr C.R Girish (Project Supervisor) for providing
me with endless support and encouragement in all my endeavours at every
moment during my project. Without his excellent guidance, practical insights and
valuable materials this project wouldn’t have been possible or successful.
I also want to thank Mr Vinod Thomas (Director of MIT) and Dr Harish Kumar
(HOD of Chemical Department) for allowing us to conduct our project in MIT,
Manipal.
I would like to extend my gratitude to Mr Janardhan, Mr Adiga and Mr Sadanand
(Lab assistants) for their constant guidance and support. A special mention for
the HOD of Mechanical department for allowing us to conduct our experiments
in the mechanical laboratory.
ABSTRACT
Adsorption is the adhesion of molecules to a solid surface. This operation exploits the ability
of certain solids preferentially to concentrate specific substances from solution onto their
surfaces. Our project revolves around the use of agricultural waste for the removal of phenol
from wastewater using adsorption. Due to ease of availability and access, cashew nut shells in
particular was chosen as our adsorbent. Phenol is the priority pollutant since it is toxic and
harmful to organisms even at low concentrations. Surface and ground water are contaminated
by phenolics as a result of the continuous release of these compounds from petrochemical, coal
conversion and phenol producing industries. Therefore, the wastewaters containing phenolic
compounds must be treated before their discharging into the water streams. The aim of the
present work is to investigate the capability of industrial waste cashew nut shells to be used to
as an adsorbent for removal of phenol from wastewater and to study the effects of initial phenol
concentration, adsorbent dosage, contact time and experimental temperature on the adsorption
process and eventually to find the optimum condition.
The analysis was carried out in various tests being, preparation of the adsorbent from the raw
oily cashewnut shells to a dried powdered form, characterization of the sample in order to
understand the various properties of the adsorbent material, optimization of conditions – to
recognize the best conditions for maximum adsorption and to increase yield and efficiency and
lastly, kinetic and equilibrium studies at optimised conditions to obtain equilibrium data with
the help of various isotherms such as Langmuir, Freundlich and Temkin. The various kinetic
models studied included first order, second order and intra-particle diffusion.
Before conducting the experiments, the parameters were optimised to obtain highest yield and
efficiency. The experiments were then conducted at these optimised conditions and it was
found that the experimental percentage phenol removal from wastewater of 57.18% was close
to that of the predicted value of 61.006%. From the kinetic studies, it was established that first
order kinetic model had the highest regression value being close to one. After a detailed study
of the three isotherms, the adsorption data was found to fit Langmuir, Freundlich and Temkin
isotherms, although Langmuir and Freundlich had the closest fit.
From this project it was concluded that the regression values of Langmuir and Freundlich
isotherms being the highest and the closest, offered to be the best fit for the resulting adsorption
data. First order kinetic model having the highest regression value close to one, also resulted
in being the best fit of the three kinetic study models. The experimental percentage removal of
phenol from wastewater of 57.18% was close to that of the predicted value of 61.006% that
was developed by the software along with the optimised conditions, hence proving that
cashewnut shells activated with sulphuric acid is a potential and active adsorbent for the
removal of phenol from wastewater.
LIST OF TABLES
Table No Table Title Page No
4.2 Moisture content, volatile matter, ash content and fixed carbon of
the samples.
4.4 Absorbance of the various sample solutions.
4.5.1 Set experiments to be performed.
4.5.2 Regression values with insignificant terms.
4.5.3 Regression values without insignificant terms.
4.5.4 Optimised conditions, predicted and actual percentage removal.
4.5.5 Predicted vs. Actual values
4.6.1 Time vs. Average qe values
LIST OF FIGURES
Figure No Figure Title Page No
3.1.1 Raw cashewnut shells
3.1.2 Shells post roasting
3.1.3 Powdered cashewnut shells
4.3 Infrared spectrum for the activated sample
4.4 Absorbance vs. Concentration
4.5.1 Phenol removal w.r.t Temperature and Concentration
4.5.2 Phenol removal w.r.t. Temperature and Dosage
4.5.3 Phenol removal w.r.t Dosage and Concentration
4.5.4 Predicted vs. Actual Readings
4.6.1 log(qe – qt) vs. Time
4.6.2 t/qt vs. Time
4.6.3 qe vs. t0.5
4.7.1 Log qe vs. Log Ce
4.7.2 1/Qe vs. 1/Ce
4.7.3 Qe vs. Log Ce
Contents
Page No
Acknowledgement i
Abstract ii
List Of Figures iii
List Of Tables vi
Chapter 1 INTRODUCTION
1.1 Introduction
1.2 Motivation
1.3 Organization of Report
Chapter 2 BACKGROUND THEORY and/or LITERATURE REVIEW
2.1 Background Theory
2.1.1 Langmuir Isotherm
2.1.2 Freundlich Isotherm
2.1.3 Temkin Isotherm
2.2 Literature Survey and Review
Chapter 3 METHODOLOGY
3.1 Preparation of the adsorbent
3.2 Characterization of the adosrbent
3.3 FTIR Analysis
3.4 Preparation of stock solution and sample solution
3.5 Calibration of the sample solution
3.6 Optimization of conditions
3.7 Kinetic studies
3.8 Isotherm studies
Chapter 4 RESULT ANALYSIS
4.1 Introduction
4.2 Proximate Analysis
4.3 FTIR Analysis
4.4 Calibration of sample solution
4.5 Optimization of Parameters
4.6 Kinetic Studies
4.6.1 First Order
4.6.2 Second Order
4.6.3 Third Order
4.7 Isotherm Studies
4.7.1 Freundlich Isotherm
4.7.2 Langmuir Isotherm
4.7.3 Temkin Isotherm
Chapter 5 CONCLUSION AND FUTURE SCOPE
5.1 Work Conclusion
5.2 Future Scope of Work
REFERENCES
ANNEXURES (OPTIONAL)
PROJECT DETAILS
CHAPTER 1
INTRODUCTION
1.1 Introduction
Our project revolves around the use of agricultural waste for the removal of phenol from
wastewater using adsorption. Due to ease of availability and access, cashew nut shells in
particular was chosen as our adsorbent.
Conventional methods for the removal of phenolic pollutants in aqueous solutions can be
divided into three main categories: physical, chemical and biological treatments. Among
them, physical adsorption method is generally considered to be the best, effective, low cost
and most frequently used method for the removal of phenolic pollutions. Therefore the
search for low cost and easily available adsorbents has led many researchers to search more
economic and efficient techniques of using the natural and synthetic materials as
adsorbents.
The aim of the present work is to investigate the capability of industrial waste cashew nut
shells to be used to as an adsorbent for removal of phenol from wastewater and to study the
effects of initial phenol concentration, adsorbent dosage, contact time and experimental
temperature on the adsorption process and eventually to find the optimum condition.
The expected outcome from these experiments will help give a better understanding
regarding cashew nut shells as a suitable adsorbent for the removal of phenolic pollutants
from wastewater.
1.2 Motivation
Phenol is the priority pollutant since it is toxic and harmful to organisms even at low
concentrations. Beside the toxic effects; phenolic compounds create an oxygen demand in
receiving waters, and impart taste and odour to water with minute concentrations of their
chlorinated compounds. Surface and ground water are contaminated by phenolics as a result
of the continuous release of these compounds from petrochemical, coal conversion and
phenol producing industries. Therefore, the wastewaters containing phenolic compounds
must be treated before their discharging into the water streams.
Being final year chemical engineering students and having studied wastewater treatment,
pollution control and safety, the extremity of the dangers of the presence of phenol in
untreated wastewater is a factor that cannot be neglected. Having to take up further studies
after our B.Tech, it was crucial for us to have chosen a project that was closely related to
what we had learnt all through our college years and also contribute into helping the society.
Our university being located in Manipal, is very close to multiple chemical and petroleum
industrial regions. Knowing that phenolic compounds have a large contribution to the
effluents from these industries, was another motivational factor to doing this project.
Sri Devi Cashew Nut industry being located in Karkala, made the attainability of our
adsorbent an easy task. The easy access and availability helped narrow down our ideas to
this particular experiment.
1.3 Organization of Report:
January 15 - February 15: Literature Survey and attainment of the raw material.
February 15 – March 15: Preparation of the adsorbent and tests and characterization of the
adsorbent.
March 15 – April 30: Optimization of parameters, Kinetic and Equilibrium studies.
April 30 – May 15: Tabulation of results, discussion and preparation of the final report.
CHAPTER 2
BACKGROUND THEORY
2.1 Background Theory
Adsorption is the adhesion of molecules to a solid surface. This process creates a film of
adsorbate on the surface of the adsorbent. Adsorption differs from absorption in which a
fluid permeates or is dissolved by a liquid or solid. Adsorption is a surface based process
while absorption involves the whole volume of the material. It is a surface phenomenon.
Similar to surface tension, adsorption is a consequence of surface energy. The exact nature
of bonding depends on the details of the species involved, but the adsorption process is
generally classified as physisorption or chemisorption. It may also occur due to electrostatic
attraction.
Adsorption is usually described through isotherms, that is, the amount of adsorbate on the
adsorbent as a function of its pressure (if gas) or concentration (if liquid) at constant
temperature. The quantity adsorbed is nearly always normalized by the mass of the
adsorbent to allow comparison of different materials. The isotherms taken into consideration
in our project includes, Langmuir, Freundlich and Temkin.
2.1.1 Langmuir Isotherm
Irving Langmuir was the first to derive a scientifically based adsorption isotherm in 1918.
The model applies to gases adsorbed on solid surfaces. It is a semi-empirical isotherm with
a kinetic basis and was derived based on statistical thermodynamics. It is the most common
isotherm equation to use due to its simplicity and its ability to fit a variety of adsorption
data. The Langmuir isotherm is based on four assumptions:
1. All of the adsorption sites are equivalent and each site can only accommodate on
molecule.
2. The surface is energetically homogenous and adsorbed molecules do not interact.
3. There are no phase transitions.
4. At the maximum adsorption, only a monolayer is formed. Adsorption only occurs
on localized sites on the surface, not with other adsorbates.
2.1.2 Freundlich Isotherm
Freundlich and Kuster in 1894 published the first mathematical fit to an isotherm, and is a
purely empirical formula for gaseous adsorbates.
𝒙
𝒎
= 𝒌𝑷 𝟏/𝒏
where x is the quantity of adsorbate adsorbed in moles, m is the mall of the adsorbent, P is
the pressure of the adsorbate (which can be changed to concentration if a solution is being
investigated rather than a gas) and k and n are empirical constants for each adsorbent-
adsorbate pair at a given temperature. The function is not adequate at very high pressures
because in reality x/m has an asymptotic maximum as pressure increases without bound. As
the temperature increases, the constants k and n change to reflect the empirical observation
that the quantity adsorbed rises more slowly and higher pressures are required to saturate
the surface.
2.1.3 Temkin Isotherm
Temkin isotherm contains a factor that explicitly takes into the account of adsorbent-
adsorbate interactions. By ignoring the extremely low and large value of concentrations, the
model assumes that heat of adsorption (function of temperature) of all molecules in the layer
would decrease linearly rather than logarithmic. The model equation after simplification is
given by:
𝒒 𝒆 = 𝑩𝒍𝒏𝑨 𝒓 + 𝑩𝒍𝒏𝑪 𝒆
where qe is the quantity adsorbed, B is the constant related to the heat of adsorption (J/mol)
and AT is the Temkin isotherm equilibrium binding constant (L/g).
Phenol removal through adsorption: The process of adsorption has an edge due to its sludge
free clean operation and complete removal of phenol from aqueous solutions having dilute
or moderate concentrations. Activated carbon (CNS) in granular or powdered form is the
most widely used adsorbent. Out of the two major types of adsorption, chemisorption will
be applied to our studies and analysis. Chemisorption involves a chemical reaction between
the surface and the adsorbate. New chemical bonds are generated at the adsorbent surface.
The strong interaction between the adsorbate and the substrate surface creates new types of
electronic bonds.
2.2 Literature Survey and Review
Several papers were available regarding the removal of phenol from wastewater using
different materials and sources for adsorbent, two of which are mentioned below.
“Removal of phenol from industrial wastewater using saw dust” by Ihsan Habib Dakhil
from Al-Muthamma University, Iraq. The adsorbent used for his experiment was saw dust
and the various parameters considered included, initial phenol concentration, adsorbent
dose and contact time. In addition to these parameters, we are taking temperature into
account. Temperature plays a very important role in determining the chemical activity and
highest possible yields, i.e removal of phenol. In this study we concluded that the
percentage removal of phenol was considerably affected by initial phenol concentration,
amount of adsorbent dose, pH value and mixing contact time. The results also indicated
that the percentage of removal increased with increasing amount of adsorbent dosage and
the uptake of phenol took place at natural pH value and equilibrium occurred at 120
minutes.
“Removal of phenol from aqueous solutions by rice husk ash and activated carbon” by M.
Kermani and B.Bina. The adsorbent used for their analysis includes rice husk ash which
was prepared at three different temperatures, being 300, 400 and 500 degrees, and
activated carbon. The parameters taken into consideration were same as those of paper 1
with the addition of the adsorption isotherms. The results obtained showed that the
optimum conditions were contact time of 5 hours, pH of 5, high dosage of rice husk ash,
initial concentration of phenol between 10 -300 mg/l. Fruendlich and Langmuir models
were used to describe the relationship between the amount of phenol adsorbed and its
equilibrium concentrations.
“Removal of phenol pollutants from aqueous solutions using various adsorbents” by D K
Singh and Bhavana Srivastava. This paper stands out from the rest due to the use of various
adsorbents rather than just one. Some of them include ion exchange resins, zinc silicate,
activated carbon from straw and used rubber tyres etc. The various parameters taken into
consideration include: Effect of adsorbate concentration, adsorbate dose, contact time and
pH. Temperature again is the added parameter taken into consideration in our experiments
with the exclusion of pH. A comparison between non-conventional adsorbents and
conventional adsorbents were made and it was concluded that non-conventional
adsorbents hold promise for effluent treatment. Non-conventional adsorbents can adsorb
phenol to the extent of 438.4 mg/g when contacted for a period of 2-48 hours in a pH range
of 4 to 6.
CHAPTER 3
METHODOLOGY
3.1 Preparation of the adsorbent
Sri Devi Cashew but Industry located in Karkala, was our primary source for the cashew
nut shells that were to be used as an adsorbent. Being located an hour away from the college
campus, the ease of availability and accessibility added to our advantage. Approximately 4
kilograms of cashew nut shells post oil extraction (African grade) were collected from the
industry. These shells were initially sun-dried for two complete days, after which they were
oven dried in the MT/MO laboratory at 100°C for a time span of 3 hours. The oven dried
shells were taken to the mechanical lab and incinerated in batches at 400°C for a time period
of 30 minutes per batch.
The shells obtained after incineration were roasted and hence made brittle for ease of
crushing. At first, the shells were crushed by hand with the use of a mortar-pestle. However,
the shells weren’t in the powdered form following the mortar-pestle and hence had to be put
in the mixer in order to attain very fine powdered adsorbent, which helps increase the
efficiency.
Figure 3.1.1: Raw cashewnut shells
Figure 3.1.2: Shells post roasting
Figure 3.1.3: Powdered cashewnut shells
3.2 Characterization of the adsorbent
Characterization of the sample simply means finding out the different properties of the
sample in order to determine the usefulness of the cashew nut shell powder as an adsorbent.
Chemical treatment of any material is done in order to increase the carbon content in it. This
is done so to eventually reduce the amounts of volatile matter in the sample. Therefore,
before any tests were conducted an activated sample was prepared using sulphuric acid. 3
molal sulphuric acid was added to the sample such that it is in 1:1 ratio. The following was
kept in the oven present in the mas transfer laboratory for 6 hours at 70°C, after which it
was taken out and small amounts of water was added. The sample was kept back in the oven
for another 6 hours at the same temperature. The activated sample was then acquired which
was to be used for all proximate analysis of the adsorbent in order to evaluate the moisture
content, the volatile matter and the ash content.
(i) Moisture content in an adsorbent is nothing but the quantity of water contained
in the material. The higher the moisture content, the higher other qualities such
as pore volume and surface area of the particle would be.
(ii) Volatile matter is products given off by a material as a gas or vapour. In short,
it is substance that vaporises. A substance’s volatility is measure by its vapour
pressure; the point at which a substance turns from a solid to gas or vice-versa.
Volatile matter analysis is important in order to determine the overall usefulness
of the adsorbent.
(iii) Ash content, by definition includes all non-aqueous residues that remain after
a sample is burned. It includes the non-combustible matter.
The results for the proximate analysis are tabulated in Chapter 4, table 4.4.1.
3.3 FTIR analysis
Fourier transform infrared spectroscopy (FTIR) is a technique which is used to obtain an
infrared spectrum of absorption, emission, photoconductivity etc. of solid, liquid or a gas
sample. An FTIR spectrometer simultaneously collects high spectral resolution data over a
wide spectral range. This confers a significant advantage over an ordinary spectrometer
which measures intensity over a narrow range of wavelengths at a time.
The sample was handed over for FTIR analysis in the Department of Chemistry. The
resulting spectrum obtained displayed a series of peaks which are detailed in Chapter 4
under sub topic 4.3. This test often helps us determine the kinds of bonds present in the
sample, with the aid of the evident peaks in the various ranges of the wavelength.
3.4 Preparation of the stock solution and the sample solutions
Stock solution is generally defined as a concentrated solution that is later diluted to lower
concentrations for actual use. Our concentrated solution being phenol, was a hard mixture
that required to be heated for about 45 minutes in order to melt it enough to liquid form. A
measured quantity of 1 ml of the melted phenol solution was added to 1 litre of distilled
water in a standard flask to create the stock solution. The solution as well agitated. Such
stock solutions are prepared to save preparation time, conserve materials, reduce storage
space and also to improve the accuracy with which working lower concentration solutions
are prepared.
Various proportions of the stock solution and distilled water was mixed to obtain six
different sample solution of 50 ppm, 100 ppm, 150 ppm, 200 ppm, 250 ppm and 300 ppm
respectively.
3.5 Calibration of sample solution
After the sample solutions of different concentrations were prepared, they were placed in a
UV spectrometer in the post graduate research lab to determine the absorbance of each of
those solutions of increasing concentrations. It was observed that the absorbance increases
with an increase in the concentration of the sample solution. By having more molecules
confined in the same volume, there is more material for a given frequency of light to be
absorbed in. The light is absorbed at a specific wavelength and this is because the electrons
in the chemical bonds only absorb certain wavelengths of light. Therefore, higher
concentration results in the presence of more bonds and hence, more electrons to absorb the
light. The results of the absorbance versus the concentration are tabulated in Chapter 4, table
4.4 and displayed in figure 4.4.
3.6 Optimization of conditions
The software Design-Expert was used to find the experiments which needed to be done for
the various range of conditions. The concentration of the solutions were taken as 100, 200
and 300 ppm respectively. The temperatures were taken to be 30, 40 and 50 degree Celsius
respectively. The adsorbent weights were 0.5, 1 and 1.5 grams respectively. In total there
were 20 experiments which needed to be conducted with the help of the software. The
percentage removal was calculated and was then cross referenced with the predicted values
from the software. The significant terms were shown by the software and the 3-D plots of
these terms were plotted. The graph of the predicted vs. actual values were also plotted. A
quadratic equation was derived by the software which can be used to find the percentage
removal at any of the parameters. Finally at the optimized conditions the experiment was
performed again and the error was calculated with respect to experimental and actual value.
All the plots, tables and graphs will related to optimization of conditions and are shown in
Chapter 4.
3.7 Kinetic Studies
After optimizing the conditions, kinetic studies was carried out at those conditions. The
absorbance was calculated for every 10 minutes for the initial hour and after that for every
15 minutes for the next three hours. This experiment was performed three times and the
average values were taken. Q(mg/g) was calculated by (Co-Ct)*V/m. The respective
formulas and graphs were used to perform kinetic studies of 1st and 2nd order. The error bar
was plotted by finding the average of the three trials and the error implied was the standard
deviation in the positive and the negative ranges. R2 value were calculated from the graph
as well as the governing equations were established. The resulting plots, charts and
equations are tabulated and displayed in chapter 4.
3.8 Isotherm Studies
Isotherm studies were calculated at the optimized temperature and dosage values. However,
the concentration values were taken to be 100, 150, 200, 250 and 300 ppm respectively.
The experiments were carried out for 4 hours and finally, the absorbance was measured.
The experiments were performed 3 times and the average values were taken into
consideration for calculation purposes and for the plotting of the resulting graphs. The
isotherms that were taken into consideration include Langmuir, Freundlich and Temkin
isotherms. Appropriate equations and graphs were used to carry out these studies and
analysis was conducted after obtaining the results. The results are tabulated in chapter 4.
CHAPTER 4
RESULT ANALYSIS
4.1 Introduction
This chapter will include the tabulated results for each of the tests and experiments
performed over our project period. The various test results include: proximate analysis,
average particle size of the adsorbent, FTIR analysis, calibration of the sample solution,
optimization of the various parameters, kinetic and isotherm studies.
4.2 Proximate analysis
Table 4.2: Moisture content, volatile matter, ash content and fixed carbon percentages of
the samples
Sl. No. Tests Raw Sample Activated Sample
(i) Moisture Content (%) 10.9 14.3
(ii) Volatile Matter (%) 43.76 41.35
(iii) Ash Content (%) 15.16 13.23
(iv) Fixed Carbon (%) 30.18 31.12
The weights of the sample after heating for the specified time duration at respective
temperatures were noted down after subtracting the weight of the empty crucibles which
were found to be 10.317g (activated sample) and 10.535g (raw sample).
The moisture content of the activated sample was calculated to be greater than that of the
raw sample, which thus improves other qualities such as pore volume and surface area.
The volatile matter in the raw sample is greater than that of the activated sample which
proves the existence of small quantities of oil in the crushed cashew nut shells.
Ash content is the non-aqueous residues that is left behind after the sample is burned.
Theoretically the ash content of the activated sample should be less than that of the raw
sample which is justified by our obtained result. This confirms a reduced amount of non-
combustible matter in the activated sample.
4.3 FTIR analysis
FTIR is an acronym for Fourier Transform Infrared spectroscopy. This is a useful technique
that helps obtain infrared spectrum of absorption. It is an important tool to identify the
characteristic functional groups on the adsorbent surface. The prominent peaks obtained
from the activated sample are displayed in figure 4.3.
Figure 4.3: Infrared spectrum for the activated sample
The FTIR spectrum of the activated sample before adsorption shows a broad adsorption
peak at 3463.92 cm-1 corresponding to overlapping of –OH and –NH peaks. A peak at
2923.88 cm-1 represents the C-H group. The peak at 3606.64 cm-1 represents O-H stretch
(free hydroxyl) with functional groups of alcohols and phenols. The peaks at 1180.35 cm-1
and 1326.93 cm-1 represents C-H group with alkyl halides functional group and C-O stretch
with functional groups alcohols, carboxylic acids respectively.
4.4 Calibration of sample solution
Using the UV spectrometer, the absorbance of the various prepared sample solutions were
found. Table 4.4 displays how the absorbance varies with the concentrations and figure 4.4
displays the graph for the tabulated values.
Table 4.4: Absorbance of the various sample solutions
Concentration Absorbance
0 0
50 0.31
100 0.61
150 0.852
200 0.907
300 1
Figure 4.4: Absorbance vs. Concentration (ppm)
4.5 Optimization of Parameters
After using the design expert software, a list of experiments that had to be performed were
obtained, in order to optimise the conditions. The tabulated results are shown below in
Table 4.5.1.
0
0.2
0.4
0.6
0.8
1
1.2
0 50 100 150 200 250 300 350
Absorbance
Concentration (ppm)
Absorbance vs. Concentration
Table 4.5.1: Set experiments to be performed
Std Run Concentration
(ppm)
Dosage
(g)
Temperature
(°C)
Percentage removal
(%)
1 9 100 0.5 30 10
2 13 300 0.5 30 25
3 18 100 1.5 30 57
4 19 300 1.5 30 55
5 3 100 0.5 50 20
6 17 300 0.5 50 29.33
7 1 100 1.5 50 61
8 2 300 1.5 50 56.67
9 6 31.8 1 40 13.5
10 5 368.179 1 40 28.7
11 8 200 0.159 40 8.78
12 15 200 1.841 40 61.25
13 10 200 1 23.18 36.25
14 20 200 1 56.82 50
15 12 200 1 40 46
16 14 200 1 40 46.25
17 7 200 1 40 46.25
18 16 200 1 40 46
19 11 200 1 40 46
20 4 200 1 40 46
The variation in the percentage removal of phenol from wastewater with respect to various
parameters are displayed in figures 4.5.1, 4.5.2 and 4.5.3.
Figure 4.5.1: Percentage removal of phenol w.r.t Temperature and Concentration
Figure 4.5.2: Percentage removal of phenol w.r.t Temperature and Dosage
30
35
40
45
50
100
150
200
250
300
0
10
20
30
40
50
60
70
%removal
A: Concentration (mg/l)C: Temperature (C)
30
35
40
45
50
0.5
0.7
0.9
1.1
1.3
1.5
0
10
20
30
40
50
60
70
%removal
B: Dosage (g)C: Temperature (C)
Figure 4.5.3: Percentage removal of phenol w.r.t Dosage and Concentration
Table 4.5.2: Regression values with insignificant terms
Std. Dev 6.13 R-Squared 0.8944
Mean 39.75 Adj R-Squared 0.8746
C.V. % 15.43 Pred R-squared 0.7992
PRESS 1144.95 Adeq Precision 21.510
Table 4.5.3: Regression values without insignificant terms
Std. Dev 5.34 R-Squared 0.9499
Mean 39.75 Adj R-Squared 0.9049
C.V. % 13.44 Pred R-Squared 0.8183
PRESS 2176.58 Adeq Precision 16.309
0.5
0.7
0.9
1.1
1.3
1.5
100
150
200
250
300
0
10
20
30
40
50
60
70
%removal
A: Concentration (mg/l)B: Dosage (g)
The terms B, AB and A2 are the significant terms since percentage removal of phenol is greatly
dependent on them. The model equation for percentage removal of phenol from the software
was
𝟒𝟒. 𝟓𝟔 + 𝟏𝟕. 𝟓𝟒𝑩 − 𝟒. 𝟓𝟖𝑨𝑩 − 𝟕. 𝟎𝟓𝑨 𝟐
The optimised parameters provided by the software are displayed below with the predicted
percentage removal value and the experimental percentage removal value that was obtained
after performing the experiments at the displayed optimised conditions.
Table 4.5.4: Optimised conditions, predicted and actual percentage removal
Optimised Conditions
Concentration (mg/l) 176
Dosage (g) 1.499
Temperature (°C) 39.02
Predicted percentage removal (%) 61.006
Experimental percentage removal (%) 57.18
The percentage error was calculated by the following equation:
(
𝑷𝒓𝒆𝒅𝒊𝒄𝒕𝒆𝒅 − 𝑬𝒙𝒑𝒆𝒓𝒊𝒎𝒆𝒏𝒕𝒂𝒍
𝑷𝒓𝒆𝒅𝒊𝒄𝒕𝒆𝒅
)× 𝟏𝟎𝟎
Using the above formula, the percentage error was found to be 6.27%.
The software developed a set number of experiments that were to be performed and were
displayed in table 4.5.1. The predicted values developed by the software and the actual
experimental values are tabulated below, in table 4.5.5.
Table 4.5.5: Predicted vs. Actual values
Run order Actual value Predicted value Residual value
1 61.00 57.43 3.57
2 56.67 53.27 3.40
3 20.00 16.85 3.15
4 46 45.83 0.17
5 28.7 30.08 -1.38
6 13.5 20.83 -7.33
7 46.25 45.83 0.42
8 8.78 9.86 -1.08
9 10.00 7.25 2.75
10 36.25 42.91 -6.66
11 46 45.83 0.17
12 46 45.83 0.17
13 25.00 22.41 2.59
14 46.25 45.83 0.42
15 61.25 68.87 -7.62
16 46.00 45.83 0.17
17 29.33 31.01 -1.68
18 63.00 55.16 7.84
19 55.00 52.00 3.00
20 50.00 52.05 -2.05
The graph displaying the values of the predicted vs. the actual readings are displayed in
figure 4.5.4.
Figure 4.5.4: Predicted vs. Actual Readings
4.6 Kinetic Studies
Kinetic studies involves the study of first order, second order and intra-particle diffusion.
It includes calculation of regression values for each and an analysis of the best fit for our
experiment is conducted.
4.6.1 First Order:
First order kinetics is described by the following equation:
𝑳𝒐𝒈( 𝒒 𝒆 − 𝒒 𝒕) = 𝒍𝒐𝒈𝒒 𝒆 −
𝑲 𝟏
𝟐. 𝟑𝟎𝟑
× 𝒕
The adsorption process is a pseudo-first-order process. The first order rate constants (K1)
and qe are determined from the model. It was observed that the pseudo-first-order model
did fit well.
𝑸 = ( 𝑪 𝟎 − 𝑪𝒕) ×
𝑽
𝑴
Actual
Predicted
Predicted vs. Actual
0
10
20
30
40
50
60
70
0 10 20 30 40 50 60 70
Where C0 is the initial concentration, Ct is the instantaneous concentration at any particular
time, V is the volume of the solution and M depicts the mass of the adsorbent.
Table 4.6.1: Time vs. Average qe values
Time (mins) Average qe (mg/g)
10 0.444741
20 1.067378
20 1.200801
40 2.579497
50 3.424505
60 4.447409
75 5.64821
90 7.160329
105 8.272181
120 9.517456
135 10.76273
150 11.46942
165 12.05248
180 12.85301
195 13.0954
210 13.24216
225 13.3956
240 13.46142
For first order reaction, a plot of log (qe-qt) vs. time is plotted in order to find out the value
of the first order rate constant, which is established from the slope.
Figure 4.6.1: log(qe – qt) vs. Time
X axis of the above graph depicts time in minutes whereas the y axis depicts log(qe-qt).
The first order rate constant ‘k’, was calculated to be 0.021341 ± 0.000133 min-1.
From the graph, R2 value is found to be 0.8919.
4.6.2 Second order:
Second order kinetic studies is represented by the following equation:
𝒕
𝒒 𝒕
=
𝟏
𝒉
+
𝟏
𝒒 𝒆
× 𝒕
A plot of t/qt vs t is plotted and displayed in figure 4.6.2, to find the values of h and k. The
constant ‘h’ represents the inverse of the intercept and ‘k’ is the second order rate constant
(g/mgmin).
y = -0.0095x + 1.4828
R² = 0.8919
-2
-1.5
-1
-0.5
0
0.5
1
1.5
2
0 50 100 150 200 250
log(qe - qt) vs. Time
Error Bar
Linear (Error Bar)
Linear (Error Bar)
Figure 4.6.2: t/qt vs. Time
The x axis of the above graph represents time in minutes whereas the y axis represents t/qt.
The R2 value is established from the graph and is found to be 0.6263.
The h values is found to be 16.54767 mg/gmin and that of k is 0.000485 g/mgmin.
4.6.3 Intra-particle diffusion:
In order to gain insight into the mechanisms and rate controlling steps affecting the kinetics of
adsorption, the kinetic experimental results were fitted to intra-particle diffusion model. The
kinetic results were analysed by the intra-particle diffusion model to elucidate the diffusion
mechanisms, which is expressed by:
𝒒 𝒕 = 𝒌𝒊𝒅 × 𝒕 𝟏/𝟐
+ 𝑪
where C is the intercept and kid is the intra-particle diffusion rate constant (mg/gmin1/2), which
can be evaluated from the slope of the linear plot of qt vs. t1/2. The intercept of the plot reflects
the boundary layer effect. The larger the intercept, the greater the contribution of the surface
sorption in the rate controlling step. If the regression of qt vs. t1/2 is linear and passes through
R² = 0.6263
y = -0.0536x + 18.841
0
5
10
15
20
25
30
0 20 40 60 80 100 120 140 160
t/qt vs. Time
Error Bar 2nd order
Linear (Error Bar 2nd order)
the origin, then intra-particle diffusion is the sole rate-limiting step. However, with respect to
our project, this wasn’t the case and therefore it can be concluded that intra-particle diffusion
is not the only rate-limiting step.
Figure 4.6.3: qe vs. t0.5
4.7 Isotherm Studies
There are several models that have been reported in literature to show equilibrium
relationships between the adsorbent and the adsorbate. The Freundlich and Langmuir
models are the most frequently employed models. In this work, both these models with the
addition of Temkin models were used to describe the relationship between the amount of
phenol and its equilibrium concentrations.
4.7.1 Freundlich Isotherm
The linear form of the Freundlich isotherm is given by the relation:
𝑳𝒐𝒈𝒒 𝒆 = 𝑳𝒐𝒈(𝒌)+
𝟏
𝒏
𝑳𝒐𝒈(𝑪 𝒆)
y = 1.2289x - 4.3977
R² = 0.9804
-2
0
2
4
6
8
10
12
14
16
0 2 4 6 8 10 12 14 16 18
Qe(mg/g)
Time, t^0.5 (mins)
Qe vs. T^0.5
Where qe is the amount adsorbed at equilibrium (mg g-1), Ce is the equilibrium concentration
of the adsorbate (mg l-1), k and 1/n are the Freundlich constants related to adsorption capacity
and adsorption intensity respectively of the adsorbent. Freundlich isotherm constants were
determined from the plot of log qe vs. log Ce displayed in figure 4.7.1.
Figure 4.7.1: Log qe vs. Log Ce
From the obtained graph, the values for the Freundlich isotherm constants k and 1/n were
established to be 0.498 and 0.7 respectively.
The R2 value was determined from the graph above and is 0.976.
4.7.2 Langmuir Isotherm
The linear form of the Langmuir isotherm can be represented by the relation:
𝟏
𝑸 𝒆
= (
𝟏
𝑸 𝒎
) +
𝟏
( 𝑸 𝒎 × 𝑲 𝒂 × 𝑪 𝒆)
Where, Qe is the amount adsorbed at equilibrium (mg g-1), Qm (mg g-1) and Ka (L mg-1) are the
Languir constants related to the maximum adsorption and energy of adsorption respectively.
y = 0.7005x - 0.3027
R² = 0.976
0
0.2
0.4
0.6
0.8
1
1.2
1.4
0 0.5 1 1.5 2 2.5
Logqe
Log Ce
Freundlich Isotherm (Logqe Vs LogCe)
Langmuir isotherm constants were determined from plots of 1/Qe vs. 1/Ce as displayed in figure
4.7.2.
Figure 4.7.2: 1/Qe vs. 1/Ce
From the obtained graph, the values for the Langmuir isotherm constants Qm and Ka were
established to be 35.08772 mg g-1 and 0.0057 L mg-1 respectively.
The R2 value was determined from the graph above and is 0.9763.
4.7.3 Temkin Isotherm
Temkin isotherm contains a factor that explicitly takes into the account of adsorbent-adsorbate
interactions. Temkin isotherm can be represented by the relation:
𝑸 𝒆 = 𝑩𝒍𝒐𝒈( 𝑨) + 𝑩𝒍𝒐𝒈(𝑪 𝒆)
Where A is the Temkin isotherm equilibrium binding constant (L/g) and B is the constant
related to the heat of adsorption (J/mol).
Temkin isotherm constants were determined from the slope and the intercept of the plots of Qe
vs. logCe as displayed in figure 4.7.3.
y = 4.9997x + 0.0285
R² = 0.9763
0
0.02
0.04
0.06
0.08
0.1
0.12
0.14
0.16
0 0.005 0.01 0.015 0.02 0.025
1/Qe
1/Ce
Langmuir's Isotherm ( 1/Qe Vs 1/Ce)
Figure 4.7.3: Qe vs. Log Ce
From the obtained graph, the values for the Temkin isotherm constants ‘A’ and ‘B’ were found
to be 0.0493 L/g and 18.965 J/mol respectively.
The R2 value was determined from the graph and is 0.9379.
y = 18.965x - 24.791
R² = 0.9379
0
2
4
6
8
10
12
14
16
18
20
0 0.5 1 1.5 2 2.5
Qe
Log Ce
Temkin Isotherm ( Qe Vs Log(Ce) )
CHAPTER 5
CONCLUSION AND FUTURE SCOPE OF WORK
5.1 Conclusion
This work revolved around the usage of agricultural waste (cashewnut shells) to remove
phenol from wastewater. In order to obtain high efficiency and yield, it was necessary to
optimise the various parameters that were taken into consideration. There parameters
included concentration, dosage and temperature.
In this project, investigation of the equilibrium adsorption was carried out at the optimised
conditions developed by the software. The conditions included, concentration of 176 mg/l,
dosage of 1.499g and temperature of 39.02°C. At the optimised conditions, the predicted
percentage removal was 61.006% and the experimental percentage removal of phenol from
wastewater was 57.18%. Although the percentage removal value was close to the predicted
value, the variations are due to experimental errors.
Kinetic studies of first order, second order and intra-particle diffusion experiments were
conducted and it was found that the regression value of first order kinetic studies was the
closest to 1 and hence the best fit. In the case of intra-particle diffusion, theoretically, if the
regression line is linear and passes through the origin, then intra-particle diffusion is the
sole rate-limiting step. However, this wasn’t the case with the obtained graph from our
experiments and hence it can be concluded that intra-particle diffusion was not the only
rate-limiting step.
Alongside with kinetic studies, three isotherms were also studied, being Langmuir,
Freundlich and Temkin. From the result analysis, it was observed that the adsorption data
fitted into Langmuir, Freundlich and Temkin isotherms out of which Langmuir and
Freundlich adsorption models were found to have the highest regression values and hence
the best fit.
It can be concluded that cashewnut shells activated with sulphuric acid is a potential and
active adsorbent for the removal of phenol from wastewater.
5.2 Scope of Work
Cashewnut shells would make a decent adsorbent for the removal of phenol from
wastewater as it has assured 57.18% percentage phenol removal in this project. It will be
economical and also a contribution to recycling since the waste cashewnut shells which is
otherwise worthless, can now be grounded, dried and used as an adsorbent. The ease of
availability adds to its advantage. If not in large scale industries, for small scale industries,
recycling of water is possible to a large extent with the use of cashewnut shells.
REFERENCES
Journal / Conference Papers
[1] Ihsan Habib Dakhil, “Removal of Phenol from Industrial Wastewater using Sawdust”,
Research Inventy: International Journal of Engineering and Science, volume 3, 2013,
pgs 25-28.
[2] M. Kermani and B. Bina, “Removal of Phenol from Aqueous solutions using Rice Husk
Ash and Activated Carbon, Pakistan Journal of Biological Sciences, 2006, pgs 1905-
1909.
[3] Mambo Moyo and Fidelis Chigondo, “Removal of Phenol from Aqueaous solution by
Adsorption on Yeast, Saccharomyces Cerevisiae”, Ijrras, volume 11, 2012, pgs 487-493.
[4] D K Singh and Bhavana Srivastava, “Removal of Phenol Pollutants from Aqueous
Solutions using various Adsorbents”, Journal of Scientific and Industrial Research,
volume 61, 2002, pgs 208-218.
[5] Patterson J W, cited in “Wastewater treatment technology” (Ann Arbor Science Ann
Arbor, Mic), Chapter 18, 1988, pg 205.
[6] Singh D K and Mishra A, “Removal of Phenolic compounds from water by iron loaded
marble”, Sep Sci Technol, 1993 (1923).
[7] Singh D K and Mishra A, “Removal of Phenolic coumpund from water using
chemically treated saw dust”, Indian J Environ Hlth, 32(1990) 345.
[8] Singh D K and Srivastava B, “Removal of some phenols by activate carbon developed
from used tea leaves”, J Ind Poll Cont, 16 (2000a) 19.
[9] Deshmukh S W and Pangarkar V G, “Recovery of organic chemicals from effluents by
adsorption over polymeric adsorbents”, Indian Chem Eng, 26 (1984) 35.
PROJECT DETAILS
Student Details
Student Name Kartik Kulkarni
Register Number 110903014 Section / Roll
No
8
Email Address kartikkulkarni2717@gmail.com Phone No (M) 9008769565
Student Name Varsha Sudheer
Register Number 110903248 Section / Roll
No
81
Email Address varshasudheer92@gmail.com Phone No (M) 9008744804
Project Details
Project Title REMOVAL OF PHENOL FROM WASTEWATER USING
AGRICULTURAL WASTE (CASHEWNUT SHELLS)
Project Duration Jan 2015 – May 2015 Date of
reporting
19.05.2015
Organization Details
Organization
Name
Full postal address
with pin code
Website address
Supervisor Details
Supervisor Name
Designation
Full contact address
with pin code
Email address Phone No (M)
Internal Guide Details
Faculty Name Mr C.R.Girish
Full contact address
with pin code
Department of Chemical Engineering,
Manipal Institute of Technology, Manipal – 576 104
(Karnataka State), INDIA
Email address cr.girish@manipal.edu
Final Report

Mais conteúdo relacionado

Mais procurados

Treatment of Effluent from Granite Cutting Plant by Using Natural Adsorbents ...
Treatment of Effluent from Granite Cutting Plant by Using Natural Adsorbents ...Treatment of Effluent from Granite Cutting Plant by Using Natural Adsorbents ...
Treatment of Effluent from Granite Cutting Plant by Using Natural Adsorbents ...IJERD Editor
 
Adsorption of Methylene blue and Malachite Green in Aqueous Solution using Ja...
Adsorption of Methylene blue and Malachite Green in Aqueous Solution using Ja...Adsorption of Methylene blue and Malachite Green in Aqueous Solution using Ja...
Adsorption of Methylene blue and Malachite Green in Aqueous Solution using Ja...IJEAB
 
77201935
7720193577201935
77201935IJRAT
 
Removal of fluoride from drinking water by adsorption onto Activated Alumina ...
Removal of fluoride from drinking water by adsorption onto Activated Alumina ...Removal of fluoride from drinking water by adsorption onto Activated Alumina ...
Removal of fluoride from drinking water by adsorption onto Activated Alumina ...IJERA Editor
 
Air pollution mitigation of poison gas co with crude chlorophyll of papaya (c...
Air pollution mitigation of poison gas co with crude chlorophyll of papaya (c...Air pollution mitigation of poison gas co with crude chlorophyll of papaya (c...
Air pollution mitigation of poison gas co with crude chlorophyll of papaya (c...Alexander Decker
 
Optimum Conditions for the Removal of Cadmium from Aqueous Solution with Bamb...
Optimum Conditions for the Removal of Cadmium from Aqueous Solution with Bamb...Optimum Conditions for the Removal of Cadmium from Aqueous Solution with Bamb...
Optimum Conditions for the Removal of Cadmium from Aqueous Solution with Bamb...theijes
 
Chemical Examination Of Sandbox (Hura Crepitans) Seed: Proximate, Elemental A...
Chemical Examination Of Sandbox (Hura Crepitans) Seed: Proximate, Elemental A...Chemical Examination Of Sandbox (Hura Crepitans) Seed: Proximate, Elemental A...
Chemical Examination Of Sandbox (Hura Crepitans) Seed: Proximate, Elemental A...IOSRJAC
 
F041014356
F041014356F041014356
F041014356IOSR-JEN
 
IRJET- Improvement of Sludge Reduction Efficiency of Ozonation by Microbubble...
IRJET- Improvement of Sludge Reduction Efficiency of Ozonation by Microbubble...IRJET- Improvement of Sludge Reduction Efficiency of Ozonation by Microbubble...
IRJET- Improvement of Sludge Reduction Efficiency of Ozonation by Microbubble...IRJET Journal
 
Oily wastewater treatment using polyamide thin film composite membrane
Oily wastewater treatment using polyamide thin film composite membraneOily wastewater treatment using polyamide thin film composite membrane
Oily wastewater treatment using polyamide thin film composite membraneMedhat Elzahar
 

Mais procurados (19)

Spent Coffee Grounds as Adsorbents for Pesticide Paraquat
Spent Coffee Grounds as Adsorbents for Pesticide ParaquatSpent Coffee Grounds as Adsorbents for Pesticide Paraquat
Spent Coffee Grounds as Adsorbents for Pesticide Paraquat
 
Jeas 0915 2655 (2)
Jeas 0915 2655 (2)Jeas 0915 2655 (2)
Jeas 0915 2655 (2)
 
Treatment of Effluent from Granite Cutting Plant by Using Natural Adsorbents ...
Treatment of Effluent from Granite Cutting Plant by Using Natural Adsorbents ...Treatment of Effluent from Granite Cutting Plant by Using Natural Adsorbents ...
Treatment of Effluent from Granite Cutting Plant by Using Natural Adsorbents ...
 
Adsorption of Methylene blue and Malachite Green in Aqueous Solution using Ja...
Adsorption of Methylene blue and Malachite Green in Aqueous Solution using Ja...Adsorption of Methylene blue and Malachite Green in Aqueous Solution using Ja...
Adsorption of Methylene blue and Malachite Green in Aqueous Solution using Ja...
 
Gjesm150181451593800
Gjesm150181451593800Gjesm150181451593800
Gjesm150181451593800
 
77201935
7720193577201935
77201935
 
Removal of fluoride from drinking water by adsorption onto Activated Alumina ...
Removal of fluoride from drinking water by adsorption onto Activated Alumina ...Removal of fluoride from drinking water by adsorption onto Activated Alumina ...
Removal of fluoride from drinking water by adsorption onto Activated Alumina ...
 
I0444751
I0444751I0444751
I0444751
 
5.pdf
5.pdf5.pdf
5.pdf
 
Air pollution mitigation of poison gas co with crude chlorophyll of papaya (c...
Air pollution mitigation of poison gas co with crude chlorophyll of papaya (c...Air pollution mitigation of poison gas co with crude chlorophyll of papaya (c...
Air pollution mitigation of poison gas co with crude chlorophyll of papaya (c...
 
Optimum Conditions for the Removal of Cadmium from Aqueous Solution with Bamb...
Optimum Conditions for the Removal of Cadmium from Aqueous Solution with Bamb...Optimum Conditions for the Removal of Cadmium from Aqueous Solution with Bamb...
Optimum Conditions for the Removal of Cadmium from Aqueous Solution with Bamb...
 
Chemical Examination Of Sandbox (Hura Crepitans) Seed: Proximate, Elemental A...
Chemical Examination Of Sandbox (Hura Crepitans) Seed: Proximate, Elemental A...Chemical Examination Of Sandbox (Hura Crepitans) Seed: Proximate, Elemental A...
Chemical Examination Of Sandbox (Hura Crepitans) Seed: Proximate, Elemental A...
 
[Ahn]
[Ahn][Ahn]
[Ahn]
 
F041014356
F041014356F041014356
F041014356
 
IRJET- Improvement of Sludge Reduction Efficiency of Ozonation by Microbubble...
IRJET- Improvement of Sludge Reduction Efficiency of Ozonation by Microbubble...IRJET- Improvement of Sludge Reduction Efficiency of Ozonation by Microbubble...
IRJET- Improvement of Sludge Reduction Efficiency of Ozonation by Microbubble...
 
6.pdf
6.pdf6.pdf
6.pdf
 
G04813741
G04813741G04813741
G04813741
 
Oily wastewater treatment using polyamide thin film composite membrane
Oily wastewater treatment using polyamide thin film composite membraneOily wastewater treatment using polyamide thin film composite membrane
Oily wastewater treatment using polyamide thin film composite membrane
 
Effect of activated
Effect of activatedEffect of activated
Effect of activated
 

Semelhante a Final Report

DEFLUORIDATION BY BIOADSORBENTS
DEFLUORIDATION BY BIOADSORBENTSDEFLUORIDATION BY BIOADSORBENTS
DEFLUORIDATION BY BIOADSORBENTSNayana 54321
 
Modified magnetite nanoparticles with cetyltrimethylammonium bromide as super...
Modified magnetite nanoparticles with cetyltrimethylammonium bromide as super...Modified magnetite nanoparticles with cetyltrimethylammonium bromide as super...
Modified magnetite nanoparticles with cetyltrimethylammonium bromide as super...Iranian Chemical Society
 
Defluoridization Using a Natural Adsorbent, Strychnos Potatorum
Defluoridization Using a Natural Adsorbent, Strychnos PotatorumDefluoridization Using a Natural Adsorbent, Strychnos Potatorum
Defluoridization Using a Natural Adsorbent, Strychnos PotatorumIJERA Editor
 
Mass Transfer, Kinetic, Equilibrium, and Thermodynamic Study on Removal of Di...
Mass Transfer, Kinetic, Equilibrium, and Thermodynamic Study on Removal of Di...Mass Transfer, Kinetic, Equilibrium, and Thermodynamic Study on Removal of Di...
Mass Transfer, Kinetic, Equilibrium, and Thermodynamic Study on Removal of Di...Ratnakaram Venkata Nadh
 
Degradation of phenol using sequential batch reactor
Degradation of phenol using sequential batch reactorDegradation of phenol using sequential batch reactor
Degradation of phenol using sequential batch reactoreSAT Journals
 
Evaluation of the adsorption kinetics and equilibrium for the
Evaluation of the adsorption kinetics and equilibrium for theEvaluation of the adsorption kinetics and equilibrium for the
Evaluation of the adsorption kinetics and equilibrium for theAlexander Decker
 
Adsorption of dye from aqueous solutions by orange peel with Chitosan nanocom...
Adsorption of dye from aqueous solutions by orange peel with Chitosan nanocom...Adsorption of dye from aqueous solutions by orange peel with Chitosan nanocom...
Adsorption of dye from aqueous solutions by orange peel with Chitosan nanocom...Open Access Research Paper
 
PowerPoint Conference
PowerPoint ConferencePowerPoint Conference
PowerPoint ConferenceEmily Daniels
 
IRJET- Design of Leachate Bioreactor for Dilkap College
IRJET-  	  Design of Leachate Bioreactor for Dilkap CollegeIRJET-  	  Design of Leachate Bioreactor for Dilkap College
IRJET- Design of Leachate Bioreactor for Dilkap CollegeIRJET Journal
 
Potential of corn husk leaves for the co removal of phenol and cyanide from w...
Potential of corn husk leaves for the co removal of phenol and cyanide from w...Potential of corn husk leaves for the co removal of phenol and cyanide from w...
Potential of corn husk leaves for the co removal of phenol and cyanide from w...eSAT Journals
 
Applications of Algal Technology for a Martian Colony *Fixed*
Applications of Algal Technology for a Martian Colony *Fixed*Applications of Algal Technology for a Martian Colony *Fixed*
Applications of Algal Technology for a Martian Colony *Fixed*EricStephens26
 
Applications of Algal Technology on a Martian Colony
Applications of Algal Technology on a Martian ColonyApplications of Algal Technology on a Martian Colony
Applications of Algal Technology on a Martian ColonyEricStephens26
 

Semelhante a Final Report (20)

DEFLUORIDATION BY BIOADSORBENTS
DEFLUORIDATION BY BIOADSORBENTSDEFLUORIDATION BY BIOADSORBENTS
DEFLUORIDATION BY BIOADSORBENTS
 
Modified magnetite nanoparticles with cetyltrimethylammonium bromide as super...
Modified magnetite nanoparticles with cetyltrimethylammonium bromide as super...Modified magnetite nanoparticles with cetyltrimethylammonium bromide as super...
Modified magnetite nanoparticles with cetyltrimethylammonium bromide as super...
 
Defluoridization Using a Natural Adsorbent, Strychnos Potatorum
Defluoridization Using a Natural Adsorbent, Strychnos PotatorumDefluoridization Using a Natural Adsorbent, Strychnos Potatorum
Defluoridization Using a Natural Adsorbent, Strychnos Potatorum
 
Mass Transfer, Kinetic, Equilibrium, and Thermodynamic Study on Removal of Di...
Mass Transfer, Kinetic, Equilibrium, and Thermodynamic Study on Removal of Di...Mass Transfer, Kinetic, Equilibrium, and Thermodynamic Study on Removal of Di...
Mass Transfer, Kinetic, Equilibrium, and Thermodynamic Study on Removal of Di...
 
Degradation of phenol using sequential batch reactor
Degradation of phenol using sequential batch reactorDegradation of phenol using sequential batch reactor
Degradation of phenol using sequential batch reactor
 
cel-report
cel-reportcel-report
cel-report
 
Evaluation of the adsorption kinetics and equilibrium for the
Evaluation of the adsorption kinetics and equilibrium for theEvaluation of the adsorption kinetics and equilibrium for the
Evaluation of the adsorption kinetics and equilibrium for the
 
Adsorption of mb onto xmcm
Adsorption of mb onto xmcmAdsorption of mb onto xmcm
Adsorption of mb onto xmcm
 
Adsorption of dye from aqueous solutions by orange peel with Chitosan nanocom...
Adsorption of dye from aqueous solutions by orange peel with Chitosan nanocom...Adsorption of dye from aqueous solutions by orange peel with Chitosan nanocom...
Adsorption of dye from aqueous solutions by orange peel with Chitosan nanocom...
 
Ijetr011948
Ijetr011948Ijetr011948
Ijetr011948
 
PowerPoint Conference
PowerPoint ConferencePowerPoint Conference
PowerPoint Conference
 
IRJET- Design of Leachate Bioreactor for Dilkap College
IRJET-  	  Design of Leachate Bioreactor for Dilkap CollegeIRJET-  	  Design of Leachate Bioreactor for Dilkap College
IRJET- Design of Leachate Bioreactor for Dilkap College
 
Potential of corn husk leaves for the co removal of phenol and cyanide from w...
Potential of corn husk leaves for the co removal of phenol and cyanide from w...Potential of corn husk leaves for the co removal of phenol and cyanide from w...
Potential of corn husk leaves for the co removal of phenol and cyanide from w...
 
ART201673
ART201673ART201673
ART201673
 
B05430815
B05430815B05430815
B05430815
 
Applications of Algal Technology for a Martian Colony *Fixed*
Applications of Algal Technology for a Martian Colony *Fixed*Applications of Algal Technology for a Martian Colony *Fixed*
Applications of Algal Technology for a Martian Colony *Fixed*
 
Applications of Algal Technology on a Martian Colony
Applications of Algal Technology on a Martian ColonyApplications of Algal Technology on a Martian Colony
Applications of Algal Technology on a Martian Colony
 
Ijetr042151
Ijetr042151Ijetr042151
Ijetr042151
 
Project PDF
Project PDFProject PDF
Project PDF
 
imidoclopid jmes
imidoclopid jmesimidoclopid jmes
imidoclopid jmes
 

Final Report

  • 1. REMOVAL OF PHENOL FROM WASTEWATER USING AGRICULTURAL WASTE (CASHEWNUT SHELLS) A GraduateProject Report submitted to ManipalUniversity in partialfulfilment of the requirement for the award of the degree of BACHELOR OF TECHNOLOGY in Chemical Engineering Submitted by Varsha Sudheer (110903248) Kartik Kulkarni (110903014) Under the guidance of C.R.Girish Assistant Professor – Senior Scale Department of Chemical Engg. MIT, Manipal DEPARTMENT OF CHEMICAL ENGINEERING MANIPAL INSTITUTE OF TECHNOLOGY (A Constituent College of Manipal University) MANIPAL – 576104, KARNATAKA, INDIA May/July 2015
  • 2. DEPARTMENT OF CHEMICAL ENGINEERING MANIPAL INSTITUTE OF TECHNOLOGY (A Constituent College of Manipal University) MANIPAL – 576 104 (KARNATAKA), INDIA Manipal < 19.05.2015> CERTIFICATE This is to certify that the project titled REMOVAL OF PHENOL FROM WASTEWATER USING AGRICULTURAL WASTE (CASHEWNUT SHELLS) is a record of the bonafide work done by KARTIK KULKARNI & VARSHA SUDHEER (110903014, 110903248 resp.) submitted in partial fulfilment of the requirements for the award of the Degree of Bachelor of Technology (BTech.) in CHEMICAL ENGINEERING of Manipal Institute of Technology Manipal, Karnataka, (A Constituent College of Manipal University), during the academic year 2015-2016. Mr C.R.Girish Assistant Professor – Senior Scale Prof. Dr. Harish Kumar HOD, Chemical M.I.T, MANIPAL
  • 3. ACKNOWLEDGMENTS It is said that what you have said is past and what you have done is history but what you write lasts till the end. Hence I would like to take this opportunity to thank some of the important people who made my project a fruitful experience and express my sincere gratitude to all those who have been associated with my project. I express my special thanks to Mr C.R Girish (Project Supervisor) for providing me with endless support and encouragement in all my endeavours at every moment during my project. Without his excellent guidance, practical insights and valuable materials this project wouldn’t have been possible or successful. I also want to thank Mr Vinod Thomas (Director of MIT) and Dr Harish Kumar (HOD of Chemical Department) for allowing us to conduct our project in MIT, Manipal. I would like to extend my gratitude to Mr Janardhan, Mr Adiga and Mr Sadanand (Lab assistants) for their constant guidance and support. A special mention for the HOD of Mechanical department for allowing us to conduct our experiments in the mechanical laboratory.
  • 4. ABSTRACT Adsorption is the adhesion of molecules to a solid surface. This operation exploits the ability of certain solids preferentially to concentrate specific substances from solution onto their surfaces. Our project revolves around the use of agricultural waste for the removal of phenol from wastewater using adsorption. Due to ease of availability and access, cashew nut shells in particular was chosen as our adsorbent. Phenol is the priority pollutant since it is toxic and harmful to organisms even at low concentrations. Surface and ground water are contaminated by phenolics as a result of the continuous release of these compounds from petrochemical, coal conversion and phenol producing industries. Therefore, the wastewaters containing phenolic compounds must be treated before their discharging into the water streams. The aim of the present work is to investigate the capability of industrial waste cashew nut shells to be used to as an adsorbent for removal of phenol from wastewater and to study the effects of initial phenol concentration, adsorbent dosage, contact time and experimental temperature on the adsorption process and eventually to find the optimum condition. The analysis was carried out in various tests being, preparation of the adsorbent from the raw oily cashewnut shells to a dried powdered form, characterization of the sample in order to understand the various properties of the adsorbent material, optimization of conditions – to recognize the best conditions for maximum adsorption and to increase yield and efficiency and lastly, kinetic and equilibrium studies at optimised conditions to obtain equilibrium data with the help of various isotherms such as Langmuir, Freundlich and Temkin. The various kinetic models studied included first order, second order and intra-particle diffusion. Before conducting the experiments, the parameters were optimised to obtain highest yield and efficiency. The experiments were then conducted at these optimised conditions and it was found that the experimental percentage phenol removal from wastewater of 57.18% was close to that of the predicted value of 61.006%. From the kinetic studies, it was established that first order kinetic model had the highest regression value being close to one. After a detailed study of the three isotherms, the adsorption data was found to fit Langmuir, Freundlich and Temkin isotherms, although Langmuir and Freundlich had the closest fit. From this project it was concluded that the regression values of Langmuir and Freundlich isotherms being the highest and the closest, offered to be the best fit for the resulting adsorption data. First order kinetic model having the highest regression value close to one, also resulted in being the best fit of the three kinetic study models. The experimental percentage removal of phenol from wastewater of 57.18% was close to that of the predicted value of 61.006% that was developed by the software along with the optimised conditions, hence proving that cashewnut shells activated with sulphuric acid is a potential and active adsorbent for the removal of phenol from wastewater.
  • 5. LIST OF TABLES Table No Table Title Page No 4.2 Moisture content, volatile matter, ash content and fixed carbon of the samples. 4.4 Absorbance of the various sample solutions. 4.5.1 Set experiments to be performed. 4.5.2 Regression values with insignificant terms. 4.5.3 Regression values without insignificant terms. 4.5.4 Optimised conditions, predicted and actual percentage removal. 4.5.5 Predicted vs. Actual values 4.6.1 Time vs. Average qe values
  • 6. LIST OF FIGURES Figure No Figure Title Page No 3.1.1 Raw cashewnut shells 3.1.2 Shells post roasting 3.1.3 Powdered cashewnut shells 4.3 Infrared spectrum for the activated sample 4.4 Absorbance vs. Concentration 4.5.1 Phenol removal w.r.t Temperature and Concentration 4.5.2 Phenol removal w.r.t. Temperature and Dosage 4.5.3 Phenol removal w.r.t Dosage and Concentration 4.5.4 Predicted vs. Actual Readings 4.6.1 log(qe – qt) vs. Time 4.6.2 t/qt vs. Time 4.6.3 qe vs. t0.5 4.7.1 Log qe vs. Log Ce 4.7.2 1/Qe vs. 1/Ce 4.7.3 Qe vs. Log Ce
  • 7. Contents Page No Acknowledgement i Abstract ii List Of Figures iii List Of Tables vi Chapter 1 INTRODUCTION 1.1 Introduction 1.2 Motivation 1.3 Organization of Report Chapter 2 BACKGROUND THEORY and/or LITERATURE REVIEW 2.1 Background Theory 2.1.1 Langmuir Isotherm 2.1.2 Freundlich Isotherm 2.1.3 Temkin Isotherm 2.2 Literature Survey and Review Chapter 3 METHODOLOGY 3.1 Preparation of the adsorbent 3.2 Characterization of the adosrbent 3.3 FTIR Analysis 3.4 Preparation of stock solution and sample solution 3.5 Calibration of the sample solution 3.6 Optimization of conditions 3.7 Kinetic studies 3.8 Isotherm studies Chapter 4 RESULT ANALYSIS 4.1 Introduction 4.2 Proximate Analysis 4.3 FTIR Analysis 4.4 Calibration of sample solution 4.5 Optimization of Parameters 4.6 Kinetic Studies 4.6.1 First Order 4.6.2 Second Order 4.6.3 Third Order
  • 8. 4.7 Isotherm Studies 4.7.1 Freundlich Isotherm 4.7.2 Langmuir Isotherm 4.7.3 Temkin Isotherm Chapter 5 CONCLUSION AND FUTURE SCOPE 5.1 Work Conclusion 5.2 Future Scope of Work REFERENCES ANNEXURES (OPTIONAL) PROJECT DETAILS
  • 9. CHAPTER 1 INTRODUCTION 1.1 Introduction Our project revolves around the use of agricultural waste for the removal of phenol from wastewater using adsorption. Due to ease of availability and access, cashew nut shells in particular was chosen as our adsorbent. Conventional methods for the removal of phenolic pollutants in aqueous solutions can be divided into three main categories: physical, chemical and biological treatments. Among them, physical adsorption method is generally considered to be the best, effective, low cost and most frequently used method for the removal of phenolic pollutions. Therefore the search for low cost and easily available adsorbents has led many researchers to search more economic and efficient techniques of using the natural and synthetic materials as adsorbents. The aim of the present work is to investigate the capability of industrial waste cashew nut shells to be used to as an adsorbent for removal of phenol from wastewater and to study the effects of initial phenol concentration, adsorbent dosage, contact time and experimental temperature on the adsorption process and eventually to find the optimum condition. The expected outcome from these experiments will help give a better understanding regarding cashew nut shells as a suitable adsorbent for the removal of phenolic pollutants from wastewater. 1.2 Motivation Phenol is the priority pollutant since it is toxic and harmful to organisms even at low concentrations. Beside the toxic effects; phenolic compounds create an oxygen demand in receiving waters, and impart taste and odour to water with minute concentrations of their chlorinated compounds. Surface and ground water are contaminated by phenolics as a result of the continuous release of these compounds from petrochemical, coal conversion and phenol producing industries. Therefore, the wastewaters containing phenolic compounds must be treated before their discharging into the water streams. Being final year chemical engineering students and having studied wastewater treatment, pollution control and safety, the extremity of the dangers of the presence of phenol in untreated wastewater is a factor that cannot be neglected. Having to take up further studies after our B.Tech, it was crucial for us to have chosen a project that was closely related to what we had learnt all through our college years and also contribute into helping the society. Our university being located in Manipal, is very close to multiple chemical and petroleum
  • 10. industrial regions. Knowing that phenolic compounds have a large contribution to the effluents from these industries, was another motivational factor to doing this project. Sri Devi Cashew Nut industry being located in Karkala, made the attainability of our adsorbent an easy task. The easy access and availability helped narrow down our ideas to this particular experiment. 1.3 Organization of Report: January 15 - February 15: Literature Survey and attainment of the raw material. February 15 – March 15: Preparation of the adsorbent and tests and characterization of the adsorbent. March 15 – April 30: Optimization of parameters, Kinetic and Equilibrium studies. April 30 – May 15: Tabulation of results, discussion and preparation of the final report.
  • 11. CHAPTER 2 BACKGROUND THEORY 2.1 Background Theory Adsorption is the adhesion of molecules to a solid surface. This process creates a film of adsorbate on the surface of the adsorbent. Adsorption differs from absorption in which a fluid permeates or is dissolved by a liquid or solid. Adsorption is a surface based process while absorption involves the whole volume of the material. It is a surface phenomenon. Similar to surface tension, adsorption is a consequence of surface energy. The exact nature of bonding depends on the details of the species involved, but the adsorption process is generally classified as physisorption or chemisorption. It may also occur due to electrostatic attraction. Adsorption is usually described through isotherms, that is, the amount of adsorbate on the adsorbent as a function of its pressure (if gas) or concentration (if liquid) at constant temperature. The quantity adsorbed is nearly always normalized by the mass of the adsorbent to allow comparison of different materials. The isotherms taken into consideration in our project includes, Langmuir, Freundlich and Temkin. 2.1.1 Langmuir Isotherm Irving Langmuir was the first to derive a scientifically based adsorption isotherm in 1918. The model applies to gases adsorbed on solid surfaces. It is a semi-empirical isotherm with a kinetic basis and was derived based on statistical thermodynamics. It is the most common isotherm equation to use due to its simplicity and its ability to fit a variety of adsorption data. The Langmuir isotherm is based on four assumptions: 1. All of the adsorption sites are equivalent and each site can only accommodate on molecule. 2. The surface is energetically homogenous and adsorbed molecules do not interact. 3. There are no phase transitions. 4. At the maximum adsorption, only a monolayer is formed. Adsorption only occurs on localized sites on the surface, not with other adsorbates. 2.1.2 Freundlich Isotherm Freundlich and Kuster in 1894 published the first mathematical fit to an isotherm, and is a purely empirical formula for gaseous adsorbates. 𝒙 𝒎 = 𝒌𝑷 𝟏/𝒏
  • 12. where x is the quantity of adsorbate adsorbed in moles, m is the mall of the adsorbent, P is the pressure of the adsorbate (which can be changed to concentration if a solution is being investigated rather than a gas) and k and n are empirical constants for each adsorbent- adsorbate pair at a given temperature. The function is not adequate at very high pressures because in reality x/m has an asymptotic maximum as pressure increases without bound. As the temperature increases, the constants k and n change to reflect the empirical observation that the quantity adsorbed rises more slowly and higher pressures are required to saturate the surface. 2.1.3 Temkin Isotherm Temkin isotherm contains a factor that explicitly takes into the account of adsorbent- adsorbate interactions. By ignoring the extremely low and large value of concentrations, the model assumes that heat of adsorption (function of temperature) of all molecules in the layer would decrease linearly rather than logarithmic. The model equation after simplification is given by: 𝒒 𝒆 = 𝑩𝒍𝒏𝑨 𝒓 + 𝑩𝒍𝒏𝑪 𝒆 where qe is the quantity adsorbed, B is the constant related to the heat of adsorption (J/mol) and AT is the Temkin isotherm equilibrium binding constant (L/g). Phenol removal through adsorption: The process of adsorption has an edge due to its sludge free clean operation and complete removal of phenol from aqueous solutions having dilute or moderate concentrations. Activated carbon (CNS) in granular or powdered form is the most widely used adsorbent. Out of the two major types of adsorption, chemisorption will be applied to our studies and analysis. Chemisorption involves a chemical reaction between the surface and the adsorbate. New chemical bonds are generated at the adsorbent surface. The strong interaction between the adsorbate and the substrate surface creates new types of electronic bonds. 2.2 Literature Survey and Review Several papers were available regarding the removal of phenol from wastewater using different materials and sources for adsorbent, two of which are mentioned below. “Removal of phenol from industrial wastewater using saw dust” by Ihsan Habib Dakhil from Al-Muthamma University, Iraq. The adsorbent used for his experiment was saw dust and the various parameters considered included, initial phenol concentration, adsorbent dose and contact time. In addition to these parameters, we are taking temperature into account. Temperature plays a very important role in determining the chemical activity and highest possible yields, i.e removal of phenol. In this study we concluded that the
  • 13. percentage removal of phenol was considerably affected by initial phenol concentration, amount of adsorbent dose, pH value and mixing contact time. The results also indicated that the percentage of removal increased with increasing amount of adsorbent dosage and the uptake of phenol took place at natural pH value and equilibrium occurred at 120 minutes. “Removal of phenol from aqueous solutions by rice husk ash and activated carbon” by M. Kermani and B.Bina. The adsorbent used for their analysis includes rice husk ash which was prepared at three different temperatures, being 300, 400 and 500 degrees, and activated carbon. The parameters taken into consideration were same as those of paper 1 with the addition of the adsorption isotherms. The results obtained showed that the optimum conditions were contact time of 5 hours, pH of 5, high dosage of rice husk ash, initial concentration of phenol between 10 -300 mg/l. Fruendlich and Langmuir models were used to describe the relationship between the amount of phenol adsorbed and its equilibrium concentrations. “Removal of phenol pollutants from aqueous solutions using various adsorbents” by D K Singh and Bhavana Srivastava. This paper stands out from the rest due to the use of various adsorbents rather than just one. Some of them include ion exchange resins, zinc silicate, activated carbon from straw and used rubber tyres etc. The various parameters taken into consideration include: Effect of adsorbate concentration, adsorbate dose, contact time and pH. Temperature again is the added parameter taken into consideration in our experiments with the exclusion of pH. A comparison between non-conventional adsorbents and conventional adsorbents were made and it was concluded that non-conventional adsorbents hold promise for effluent treatment. Non-conventional adsorbents can adsorb phenol to the extent of 438.4 mg/g when contacted for a period of 2-48 hours in a pH range of 4 to 6.
  • 14. CHAPTER 3 METHODOLOGY 3.1 Preparation of the adsorbent Sri Devi Cashew but Industry located in Karkala, was our primary source for the cashew nut shells that were to be used as an adsorbent. Being located an hour away from the college campus, the ease of availability and accessibility added to our advantage. Approximately 4 kilograms of cashew nut shells post oil extraction (African grade) were collected from the industry. These shells were initially sun-dried for two complete days, after which they were oven dried in the MT/MO laboratory at 100°C for a time span of 3 hours. The oven dried shells were taken to the mechanical lab and incinerated in batches at 400°C for a time period of 30 minutes per batch. The shells obtained after incineration were roasted and hence made brittle for ease of crushing. At first, the shells were crushed by hand with the use of a mortar-pestle. However, the shells weren’t in the powdered form following the mortar-pestle and hence had to be put in the mixer in order to attain very fine powdered adsorbent, which helps increase the efficiency. Figure 3.1.1: Raw cashewnut shells
  • 15. Figure 3.1.2: Shells post roasting Figure 3.1.3: Powdered cashewnut shells
  • 16. 3.2 Characterization of the adsorbent Characterization of the sample simply means finding out the different properties of the sample in order to determine the usefulness of the cashew nut shell powder as an adsorbent. Chemical treatment of any material is done in order to increase the carbon content in it. This is done so to eventually reduce the amounts of volatile matter in the sample. Therefore, before any tests were conducted an activated sample was prepared using sulphuric acid. 3 molal sulphuric acid was added to the sample such that it is in 1:1 ratio. The following was kept in the oven present in the mas transfer laboratory for 6 hours at 70°C, after which it was taken out and small amounts of water was added. The sample was kept back in the oven for another 6 hours at the same temperature. The activated sample was then acquired which was to be used for all proximate analysis of the adsorbent in order to evaluate the moisture content, the volatile matter and the ash content. (i) Moisture content in an adsorbent is nothing but the quantity of water contained in the material. The higher the moisture content, the higher other qualities such as pore volume and surface area of the particle would be. (ii) Volatile matter is products given off by a material as a gas or vapour. In short, it is substance that vaporises. A substance’s volatility is measure by its vapour pressure; the point at which a substance turns from a solid to gas or vice-versa. Volatile matter analysis is important in order to determine the overall usefulness of the adsorbent. (iii) Ash content, by definition includes all non-aqueous residues that remain after a sample is burned. It includes the non-combustible matter. The results for the proximate analysis are tabulated in Chapter 4, table 4.4.1. 3.3 FTIR analysis Fourier transform infrared spectroscopy (FTIR) is a technique which is used to obtain an infrared spectrum of absorption, emission, photoconductivity etc. of solid, liquid or a gas sample. An FTIR spectrometer simultaneously collects high spectral resolution data over a wide spectral range. This confers a significant advantage over an ordinary spectrometer which measures intensity over a narrow range of wavelengths at a time. The sample was handed over for FTIR analysis in the Department of Chemistry. The resulting spectrum obtained displayed a series of peaks which are detailed in Chapter 4 under sub topic 4.3. This test often helps us determine the kinds of bonds present in the sample, with the aid of the evident peaks in the various ranges of the wavelength.
  • 17. 3.4 Preparation of the stock solution and the sample solutions Stock solution is generally defined as a concentrated solution that is later diluted to lower concentrations for actual use. Our concentrated solution being phenol, was a hard mixture that required to be heated for about 45 minutes in order to melt it enough to liquid form. A measured quantity of 1 ml of the melted phenol solution was added to 1 litre of distilled water in a standard flask to create the stock solution. The solution as well agitated. Such stock solutions are prepared to save preparation time, conserve materials, reduce storage space and also to improve the accuracy with which working lower concentration solutions are prepared. Various proportions of the stock solution and distilled water was mixed to obtain six different sample solution of 50 ppm, 100 ppm, 150 ppm, 200 ppm, 250 ppm and 300 ppm respectively. 3.5 Calibration of sample solution After the sample solutions of different concentrations were prepared, they were placed in a UV spectrometer in the post graduate research lab to determine the absorbance of each of those solutions of increasing concentrations. It was observed that the absorbance increases with an increase in the concentration of the sample solution. By having more molecules confined in the same volume, there is more material for a given frequency of light to be absorbed in. The light is absorbed at a specific wavelength and this is because the electrons in the chemical bonds only absorb certain wavelengths of light. Therefore, higher concentration results in the presence of more bonds and hence, more electrons to absorb the light. The results of the absorbance versus the concentration are tabulated in Chapter 4, table 4.4 and displayed in figure 4.4. 3.6 Optimization of conditions The software Design-Expert was used to find the experiments which needed to be done for the various range of conditions. The concentration of the solutions were taken as 100, 200 and 300 ppm respectively. The temperatures were taken to be 30, 40 and 50 degree Celsius respectively. The adsorbent weights were 0.5, 1 and 1.5 grams respectively. In total there were 20 experiments which needed to be conducted with the help of the software. The percentage removal was calculated and was then cross referenced with the predicted values from the software. The significant terms were shown by the software and the 3-D plots of these terms were plotted. The graph of the predicted vs. actual values were also plotted. A quadratic equation was derived by the software which can be used to find the percentage removal at any of the parameters. Finally at the optimized conditions the experiment was performed again and the error was calculated with respect to experimental and actual value. All the plots, tables and graphs will related to optimization of conditions and are shown in Chapter 4.
  • 18. 3.7 Kinetic Studies After optimizing the conditions, kinetic studies was carried out at those conditions. The absorbance was calculated for every 10 minutes for the initial hour and after that for every 15 minutes for the next three hours. This experiment was performed three times and the average values were taken. Q(mg/g) was calculated by (Co-Ct)*V/m. The respective formulas and graphs were used to perform kinetic studies of 1st and 2nd order. The error bar was plotted by finding the average of the three trials and the error implied was the standard deviation in the positive and the negative ranges. R2 value were calculated from the graph as well as the governing equations were established. The resulting plots, charts and equations are tabulated and displayed in chapter 4. 3.8 Isotherm Studies Isotherm studies were calculated at the optimized temperature and dosage values. However, the concentration values were taken to be 100, 150, 200, 250 and 300 ppm respectively. The experiments were carried out for 4 hours and finally, the absorbance was measured. The experiments were performed 3 times and the average values were taken into consideration for calculation purposes and for the plotting of the resulting graphs. The isotherms that were taken into consideration include Langmuir, Freundlich and Temkin isotherms. Appropriate equations and graphs were used to carry out these studies and analysis was conducted after obtaining the results. The results are tabulated in chapter 4.
  • 19. CHAPTER 4 RESULT ANALYSIS 4.1 Introduction This chapter will include the tabulated results for each of the tests and experiments performed over our project period. The various test results include: proximate analysis, average particle size of the adsorbent, FTIR analysis, calibration of the sample solution, optimization of the various parameters, kinetic and isotherm studies. 4.2 Proximate analysis Table 4.2: Moisture content, volatile matter, ash content and fixed carbon percentages of the samples Sl. No. Tests Raw Sample Activated Sample (i) Moisture Content (%) 10.9 14.3 (ii) Volatile Matter (%) 43.76 41.35 (iii) Ash Content (%) 15.16 13.23 (iv) Fixed Carbon (%) 30.18 31.12 The weights of the sample after heating for the specified time duration at respective temperatures were noted down after subtracting the weight of the empty crucibles which were found to be 10.317g (activated sample) and 10.535g (raw sample). The moisture content of the activated sample was calculated to be greater than that of the raw sample, which thus improves other qualities such as pore volume and surface area. The volatile matter in the raw sample is greater than that of the activated sample which proves the existence of small quantities of oil in the crushed cashew nut shells. Ash content is the non-aqueous residues that is left behind after the sample is burned. Theoretically the ash content of the activated sample should be less than that of the raw sample which is justified by our obtained result. This confirms a reduced amount of non- combustible matter in the activated sample. 4.3 FTIR analysis FTIR is an acronym for Fourier Transform Infrared spectroscopy. This is a useful technique that helps obtain infrared spectrum of absorption. It is an important tool to identify the characteristic functional groups on the adsorbent surface. The prominent peaks obtained from the activated sample are displayed in figure 4.3.
  • 20. Figure 4.3: Infrared spectrum for the activated sample The FTIR spectrum of the activated sample before adsorption shows a broad adsorption peak at 3463.92 cm-1 corresponding to overlapping of –OH and –NH peaks. A peak at 2923.88 cm-1 represents the C-H group. The peak at 3606.64 cm-1 represents O-H stretch (free hydroxyl) with functional groups of alcohols and phenols. The peaks at 1180.35 cm-1 and 1326.93 cm-1 represents C-H group with alkyl halides functional group and C-O stretch with functional groups alcohols, carboxylic acids respectively. 4.4 Calibration of sample solution Using the UV spectrometer, the absorbance of the various prepared sample solutions were found. Table 4.4 displays how the absorbance varies with the concentrations and figure 4.4 displays the graph for the tabulated values.
  • 21. Table 4.4: Absorbance of the various sample solutions Concentration Absorbance 0 0 50 0.31 100 0.61 150 0.852 200 0.907 300 1 Figure 4.4: Absorbance vs. Concentration (ppm) 4.5 Optimization of Parameters After using the design expert software, a list of experiments that had to be performed were obtained, in order to optimise the conditions. The tabulated results are shown below in Table 4.5.1. 0 0.2 0.4 0.6 0.8 1 1.2 0 50 100 150 200 250 300 350 Absorbance Concentration (ppm) Absorbance vs. Concentration
  • 22. Table 4.5.1: Set experiments to be performed Std Run Concentration (ppm) Dosage (g) Temperature (°C) Percentage removal (%) 1 9 100 0.5 30 10 2 13 300 0.5 30 25 3 18 100 1.5 30 57 4 19 300 1.5 30 55 5 3 100 0.5 50 20 6 17 300 0.5 50 29.33 7 1 100 1.5 50 61 8 2 300 1.5 50 56.67 9 6 31.8 1 40 13.5 10 5 368.179 1 40 28.7 11 8 200 0.159 40 8.78 12 15 200 1.841 40 61.25 13 10 200 1 23.18 36.25 14 20 200 1 56.82 50 15 12 200 1 40 46 16 14 200 1 40 46.25 17 7 200 1 40 46.25 18 16 200 1 40 46 19 11 200 1 40 46 20 4 200 1 40 46 The variation in the percentage removal of phenol from wastewater with respect to various parameters are displayed in figures 4.5.1, 4.5.2 and 4.5.3.
  • 23. Figure 4.5.1: Percentage removal of phenol w.r.t Temperature and Concentration Figure 4.5.2: Percentage removal of phenol w.r.t Temperature and Dosage 30 35 40 45 50 100 150 200 250 300 0 10 20 30 40 50 60 70 %removal A: Concentration (mg/l)C: Temperature (C) 30 35 40 45 50 0.5 0.7 0.9 1.1 1.3 1.5 0 10 20 30 40 50 60 70 %removal B: Dosage (g)C: Temperature (C)
  • 24. Figure 4.5.3: Percentage removal of phenol w.r.t Dosage and Concentration Table 4.5.2: Regression values with insignificant terms Std. Dev 6.13 R-Squared 0.8944 Mean 39.75 Adj R-Squared 0.8746 C.V. % 15.43 Pred R-squared 0.7992 PRESS 1144.95 Adeq Precision 21.510 Table 4.5.3: Regression values without insignificant terms Std. Dev 5.34 R-Squared 0.9499 Mean 39.75 Adj R-Squared 0.9049 C.V. % 13.44 Pred R-Squared 0.8183 PRESS 2176.58 Adeq Precision 16.309 0.5 0.7 0.9 1.1 1.3 1.5 100 150 200 250 300 0 10 20 30 40 50 60 70 %removal A: Concentration (mg/l)B: Dosage (g)
  • 25. The terms B, AB and A2 are the significant terms since percentage removal of phenol is greatly dependent on them. The model equation for percentage removal of phenol from the software was 𝟒𝟒. 𝟓𝟔 + 𝟏𝟕. 𝟓𝟒𝑩 − 𝟒. 𝟓𝟖𝑨𝑩 − 𝟕. 𝟎𝟓𝑨 𝟐 The optimised parameters provided by the software are displayed below with the predicted percentage removal value and the experimental percentage removal value that was obtained after performing the experiments at the displayed optimised conditions. Table 4.5.4: Optimised conditions, predicted and actual percentage removal Optimised Conditions Concentration (mg/l) 176 Dosage (g) 1.499 Temperature (°C) 39.02 Predicted percentage removal (%) 61.006 Experimental percentage removal (%) 57.18 The percentage error was calculated by the following equation: ( 𝑷𝒓𝒆𝒅𝒊𝒄𝒕𝒆𝒅 − 𝑬𝒙𝒑𝒆𝒓𝒊𝒎𝒆𝒏𝒕𝒂𝒍 𝑷𝒓𝒆𝒅𝒊𝒄𝒕𝒆𝒅 )× 𝟏𝟎𝟎 Using the above formula, the percentage error was found to be 6.27%. The software developed a set number of experiments that were to be performed and were displayed in table 4.5.1. The predicted values developed by the software and the actual experimental values are tabulated below, in table 4.5.5.
  • 26. Table 4.5.5: Predicted vs. Actual values Run order Actual value Predicted value Residual value 1 61.00 57.43 3.57 2 56.67 53.27 3.40 3 20.00 16.85 3.15 4 46 45.83 0.17 5 28.7 30.08 -1.38 6 13.5 20.83 -7.33 7 46.25 45.83 0.42 8 8.78 9.86 -1.08 9 10.00 7.25 2.75 10 36.25 42.91 -6.66 11 46 45.83 0.17 12 46 45.83 0.17 13 25.00 22.41 2.59 14 46.25 45.83 0.42 15 61.25 68.87 -7.62 16 46.00 45.83 0.17 17 29.33 31.01 -1.68 18 63.00 55.16 7.84 19 55.00 52.00 3.00 20 50.00 52.05 -2.05 The graph displaying the values of the predicted vs. the actual readings are displayed in figure 4.5.4.
  • 27. Figure 4.5.4: Predicted vs. Actual Readings 4.6 Kinetic Studies Kinetic studies involves the study of first order, second order and intra-particle diffusion. It includes calculation of regression values for each and an analysis of the best fit for our experiment is conducted. 4.6.1 First Order: First order kinetics is described by the following equation: 𝑳𝒐𝒈( 𝒒 𝒆 − 𝒒 𝒕) = 𝒍𝒐𝒈𝒒 𝒆 − 𝑲 𝟏 𝟐. 𝟑𝟎𝟑 × 𝒕 The adsorption process is a pseudo-first-order process. The first order rate constants (K1) and qe are determined from the model. It was observed that the pseudo-first-order model did fit well. 𝑸 = ( 𝑪 𝟎 − 𝑪𝒕) × 𝑽 𝑴 Actual Predicted Predicted vs. Actual 0 10 20 30 40 50 60 70 0 10 20 30 40 50 60 70
  • 28. Where C0 is the initial concentration, Ct is the instantaneous concentration at any particular time, V is the volume of the solution and M depicts the mass of the adsorbent. Table 4.6.1: Time vs. Average qe values Time (mins) Average qe (mg/g) 10 0.444741 20 1.067378 20 1.200801 40 2.579497 50 3.424505 60 4.447409 75 5.64821 90 7.160329 105 8.272181 120 9.517456 135 10.76273 150 11.46942 165 12.05248 180 12.85301 195 13.0954 210 13.24216 225 13.3956 240 13.46142 For first order reaction, a plot of log (qe-qt) vs. time is plotted in order to find out the value of the first order rate constant, which is established from the slope.
  • 29. Figure 4.6.1: log(qe – qt) vs. Time X axis of the above graph depicts time in minutes whereas the y axis depicts log(qe-qt). The first order rate constant ‘k’, was calculated to be 0.021341 ± 0.000133 min-1. From the graph, R2 value is found to be 0.8919. 4.6.2 Second order: Second order kinetic studies is represented by the following equation: 𝒕 𝒒 𝒕 = 𝟏 𝒉 + 𝟏 𝒒 𝒆 × 𝒕 A plot of t/qt vs t is plotted and displayed in figure 4.6.2, to find the values of h and k. The constant ‘h’ represents the inverse of the intercept and ‘k’ is the second order rate constant (g/mgmin). y = -0.0095x + 1.4828 R² = 0.8919 -2 -1.5 -1 -0.5 0 0.5 1 1.5 2 0 50 100 150 200 250 log(qe - qt) vs. Time Error Bar Linear (Error Bar) Linear (Error Bar)
  • 30. Figure 4.6.2: t/qt vs. Time The x axis of the above graph represents time in minutes whereas the y axis represents t/qt. The R2 value is established from the graph and is found to be 0.6263. The h values is found to be 16.54767 mg/gmin and that of k is 0.000485 g/mgmin. 4.6.3 Intra-particle diffusion: In order to gain insight into the mechanisms and rate controlling steps affecting the kinetics of adsorption, the kinetic experimental results were fitted to intra-particle diffusion model. The kinetic results were analysed by the intra-particle diffusion model to elucidate the diffusion mechanisms, which is expressed by: 𝒒 𝒕 = 𝒌𝒊𝒅 × 𝒕 𝟏/𝟐 + 𝑪 where C is the intercept and kid is the intra-particle diffusion rate constant (mg/gmin1/2), which can be evaluated from the slope of the linear plot of qt vs. t1/2. The intercept of the plot reflects the boundary layer effect. The larger the intercept, the greater the contribution of the surface sorption in the rate controlling step. If the regression of qt vs. t1/2 is linear and passes through R² = 0.6263 y = -0.0536x + 18.841 0 5 10 15 20 25 30 0 20 40 60 80 100 120 140 160 t/qt vs. Time Error Bar 2nd order Linear (Error Bar 2nd order)
  • 31. the origin, then intra-particle diffusion is the sole rate-limiting step. However, with respect to our project, this wasn’t the case and therefore it can be concluded that intra-particle diffusion is not the only rate-limiting step. Figure 4.6.3: qe vs. t0.5 4.7 Isotherm Studies There are several models that have been reported in literature to show equilibrium relationships between the adsorbent and the adsorbate. The Freundlich and Langmuir models are the most frequently employed models. In this work, both these models with the addition of Temkin models were used to describe the relationship between the amount of phenol and its equilibrium concentrations. 4.7.1 Freundlich Isotherm The linear form of the Freundlich isotherm is given by the relation: 𝑳𝒐𝒈𝒒 𝒆 = 𝑳𝒐𝒈(𝒌)+ 𝟏 𝒏 𝑳𝒐𝒈(𝑪 𝒆) y = 1.2289x - 4.3977 R² = 0.9804 -2 0 2 4 6 8 10 12 14 16 0 2 4 6 8 10 12 14 16 18 Qe(mg/g) Time, t^0.5 (mins) Qe vs. T^0.5
  • 32. Where qe is the amount adsorbed at equilibrium (mg g-1), Ce is the equilibrium concentration of the adsorbate (mg l-1), k and 1/n are the Freundlich constants related to adsorption capacity and adsorption intensity respectively of the adsorbent. Freundlich isotherm constants were determined from the plot of log qe vs. log Ce displayed in figure 4.7.1. Figure 4.7.1: Log qe vs. Log Ce From the obtained graph, the values for the Freundlich isotherm constants k and 1/n were established to be 0.498 and 0.7 respectively. The R2 value was determined from the graph above and is 0.976. 4.7.2 Langmuir Isotherm The linear form of the Langmuir isotherm can be represented by the relation: 𝟏 𝑸 𝒆 = ( 𝟏 𝑸 𝒎 ) + 𝟏 ( 𝑸 𝒎 × 𝑲 𝒂 × 𝑪 𝒆) Where, Qe is the amount adsorbed at equilibrium (mg g-1), Qm (mg g-1) and Ka (L mg-1) are the Languir constants related to the maximum adsorption and energy of adsorption respectively. y = 0.7005x - 0.3027 R² = 0.976 0 0.2 0.4 0.6 0.8 1 1.2 1.4 0 0.5 1 1.5 2 2.5 Logqe Log Ce Freundlich Isotherm (Logqe Vs LogCe)
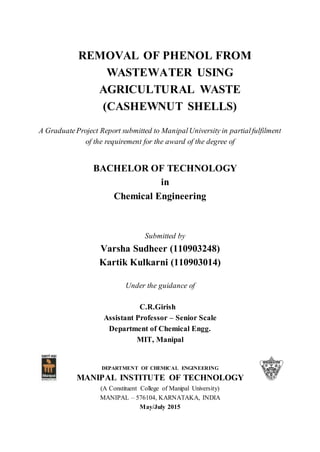
  • 33. Langmuir isotherm constants were determined from plots of 1/Qe vs. 1/Ce as displayed in figure 4.7.2. Figure 4.7.2: 1/Qe vs. 1/Ce From the obtained graph, the values for the Langmuir isotherm constants Qm and Ka were established to be 35.08772 mg g-1 and 0.0057 L mg-1 respectively. The R2 value was determined from the graph above and is 0.9763. 4.7.3 Temkin Isotherm Temkin isotherm contains a factor that explicitly takes into the account of adsorbent-adsorbate interactions. Temkin isotherm can be represented by the relation: 𝑸 𝒆 = 𝑩𝒍𝒐𝒈( 𝑨) + 𝑩𝒍𝒐𝒈(𝑪 𝒆) Where A is the Temkin isotherm equilibrium binding constant (L/g) and B is the constant related to the heat of adsorption (J/mol). Temkin isotherm constants were determined from the slope and the intercept of the plots of Qe vs. logCe as displayed in figure 4.7.3. y = 4.9997x + 0.0285 R² = 0.9763 0 0.02 0.04 0.06 0.08 0.1 0.12 0.14 0.16 0 0.005 0.01 0.015 0.02 0.025 1/Qe 1/Ce Langmuir's Isotherm ( 1/Qe Vs 1/Ce)
  • 34. Figure 4.7.3: Qe vs. Log Ce From the obtained graph, the values for the Temkin isotherm constants ‘A’ and ‘B’ were found to be 0.0493 L/g and 18.965 J/mol respectively. The R2 value was determined from the graph and is 0.9379. y = 18.965x - 24.791 R² = 0.9379 0 2 4 6 8 10 12 14 16 18 20 0 0.5 1 1.5 2 2.5 Qe Log Ce Temkin Isotherm ( Qe Vs Log(Ce) )
  • 35. CHAPTER 5 CONCLUSION AND FUTURE SCOPE OF WORK 5.1 Conclusion This work revolved around the usage of agricultural waste (cashewnut shells) to remove phenol from wastewater. In order to obtain high efficiency and yield, it was necessary to optimise the various parameters that were taken into consideration. There parameters included concentration, dosage and temperature. In this project, investigation of the equilibrium adsorption was carried out at the optimised conditions developed by the software. The conditions included, concentration of 176 mg/l, dosage of 1.499g and temperature of 39.02°C. At the optimised conditions, the predicted percentage removal was 61.006% and the experimental percentage removal of phenol from wastewater was 57.18%. Although the percentage removal value was close to the predicted value, the variations are due to experimental errors. Kinetic studies of first order, second order and intra-particle diffusion experiments were conducted and it was found that the regression value of first order kinetic studies was the closest to 1 and hence the best fit. In the case of intra-particle diffusion, theoretically, if the regression line is linear and passes through the origin, then intra-particle diffusion is the sole rate-limiting step. However, this wasn’t the case with the obtained graph from our experiments and hence it can be concluded that intra-particle diffusion was not the only rate-limiting step. Alongside with kinetic studies, three isotherms were also studied, being Langmuir, Freundlich and Temkin. From the result analysis, it was observed that the adsorption data fitted into Langmuir, Freundlich and Temkin isotherms out of which Langmuir and Freundlich adsorption models were found to have the highest regression values and hence the best fit. It can be concluded that cashewnut shells activated with sulphuric acid is a potential and active adsorbent for the removal of phenol from wastewater. 5.2 Scope of Work Cashewnut shells would make a decent adsorbent for the removal of phenol from wastewater as it has assured 57.18% percentage phenol removal in this project. It will be economical and also a contribution to recycling since the waste cashewnut shells which is otherwise worthless, can now be grounded, dried and used as an adsorbent. The ease of availability adds to its advantage. If not in large scale industries, for small scale industries, recycling of water is possible to a large extent with the use of cashewnut shells.
  • 36.
  • 37. REFERENCES Journal / Conference Papers [1] Ihsan Habib Dakhil, “Removal of Phenol from Industrial Wastewater using Sawdust”, Research Inventy: International Journal of Engineering and Science, volume 3, 2013, pgs 25-28. [2] M. Kermani and B. Bina, “Removal of Phenol from Aqueous solutions using Rice Husk Ash and Activated Carbon, Pakistan Journal of Biological Sciences, 2006, pgs 1905- 1909. [3] Mambo Moyo and Fidelis Chigondo, “Removal of Phenol from Aqueaous solution by Adsorption on Yeast, Saccharomyces Cerevisiae”, Ijrras, volume 11, 2012, pgs 487-493. [4] D K Singh and Bhavana Srivastava, “Removal of Phenol Pollutants from Aqueous Solutions using various Adsorbents”, Journal of Scientific and Industrial Research, volume 61, 2002, pgs 208-218. [5] Patterson J W, cited in “Wastewater treatment technology” (Ann Arbor Science Ann Arbor, Mic), Chapter 18, 1988, pg 205. [6] Singh D K and Mishra A, “Removal of Phenolic compounds from water by iron loaded marble”, Sep Sci Technol, 1993 (1923). [7] Singh D K and Mishra A, “Removal of Phenolic coumpund from water using chemically treated saw dust”, Indian J Environ Hlth, 32(1990) 345. [8] Singh D K and Srivastava B, “Removal of some phenols by activate carbon developed from used tea leaves”, J Ind Poll Cont, 16 (2000a) 19. [9] Deshmukh S W and Pangarkar V G, “Recovery of organic chemicals from effluents by adsorption over polymeric adsorbents”, Indian Chem Eng, 26 (1984) 35.
  • 38. PROJECT DETAILS Student Details Student Name Kartik Kulkarni Register Number 110903014 Section / Roll No 8 Email Address kartikkulkarni2717@gmail.com Phone No (M) 9008769565 Student Name Varsha Sudheer Register Number 110903248 Section / Roll No 81 Email Address varshasudheer92@gmail.com Phone No (M) 9008744804 Project Details Project Title REMOVAL OF PHENOL FROM WASTEWATER USING AGRICULTURAL WASTE (CASHEWNUT SHELLS) Project Duration Jan 2015 – May 2015 Date of reporting 19.05.2015 Organization Details Organization Name Full postal address with pin code Website address Supervisor Details Supervisor Name Designation Full contact address with pin code Email address Phone No (M) Internal Guide Details Faculty Name Mr C.R.Girish Full contact address with pin code Department of Chemical Engineering, Manipal Institute of Technology, Manipal – 576 104 (Karnataka State), INDIA Email address cr.girish@manipal.edu