1. Kuwait Financial Centre “Markaz”
R E S E A R C H
Cheaper Oil
Is it here to stay?
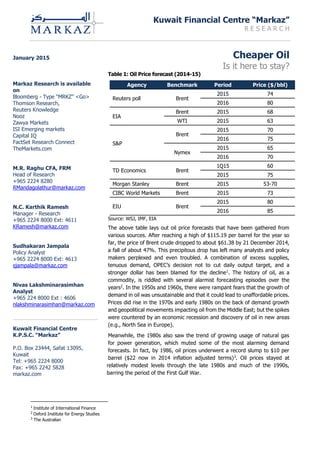
Table 1: Oil Price forecast (2014-15)
Agency Benchmark Period Price ($/bbl)
Reuters poll Brent
2015 74
2016 80
EIA
Brent 2015 68
WTI 2015 63
S&P
Brent
2015 70
2016 75
Nymex
2015 65
2016 70
TD Economics Brent
1Q15 60
2015 75
Morgan Stanley Brent 2015 53-70
CIBC World Markets Brent 2015 73
EIU Brent
2015 80
2016 85
Source: WSJ, IMF, EIA
The above table lays out oil price forecasts that have been gathered from
various sources. After reaching a high of $115.19 per barrel for the year so
far, the price of Brent crude dropped to about $61.38 by 21 December 2014,
a fall of about 47%. This precipitous drop has left many analysts and policy
makers perplexed and even troubled. A combination of excess supplies,
tenuous demand, OPEC’s decision not to cut daily output target, and a
stronger dollar has been blamed for the decline1
. The history of oil, as a
commodity, is riddled with several alarmist forecasting episodes over the
years2
. In the 1950s and 1960s, there were rampant fears that the growth of
demand in oil was unsustainable and that it could lead to unaffordable prices.
Prices did rise in the 1970s and early 1980s on the back of demand growth
and geopolitical movements impacting oil from the Middle East; but the spikes
were countered by an economic recession and discovery of oil in new areas
(e.g., North Sea in Europe).
Meanwhile, the 1980s also saw the trend of growing usage of natural gas
for power generation, which muted some of the most alarming demand
forecasts. In fact, by 1986, oil prices underwent a record slump to $10 per
barrel ($22 now in 2014 inflation adjusted terms)3
. Oil prices stayed at
relatively modest levels through the late 1980s and much of the 1990s,
barring the period of the First Gulf War.
1
Institute of International Finance
2
Oxford Institute for Energy Studies
3
The Australian
January 2015
Markaz Research is available
on
Bloomberg - Type “MRKZ” <Go>
Thomson Research,
Reuters Knowledge
Nooz
Zawya Markets
ISI Emerging markets
Capital IQ
FactSet Research Connect
TheMarkets.com
M.R. Raghu CFA, FRM
Head of Research
+965 2224 8280
RMandagolathur@markaz.com
N.C. Karthik Ramesh
Manager - Research
+965 2224 8000 Ext: 4611
KRamesh@markaz.com
Sudhakaran Jampala
Policy Analyst
+965 2224 8000 Ext: 4613
sjampala@markaz.com
Nivas Lakshminarasimhan
Analyst
+965 224 8000 Ext : 4606
nlakshminarasimhan@markaz.com
Kuwait Financial Centre
K.P.S.C. “Markaz”
P.O. Box 23444, Safat 13095,
Kuwait
Tel: +965 2224 8000
Fax: +965 2242 5828
markaz.com
2. MARKAZ RESEARCH
Cheaper Oil – January 2015
Kuwait Financial Centre “Markaz” 2
But by the end of the 1990s, oil prices experienced significant downward pressures.
This was partly due to OPEC's decision in 1997 to increase oil production quotas for
1998, an announcement that came just before the commencement of the Asian debt
crisis that had a weakening impact on global demand4
. Weaker demand and raised
supply caused a slump for almost 2 years in the oil price levels. A chart displaying the
Brent spot price in the recent past could help in setting the stage leading into the
events of 2014.
Figure 1: Brent and WTI Oil Prices in USD (2013-Present)
Source: Thomson Reuters
The current fall in the price is all the more puzzling due to the fact that despite almost
unprecedented geopolitical developments impacting multiple oil producers (e.g., Iraq,
Libya, Nigeria, etc.), the price of oil has continued to slump; though it should have
been the reverse5
. The price slump is thus considered something that could be a
reflection of deeper structural changes. Many analysts opine that crude oversupply
(e.g., U.S. shale revolution), slowing demand (e.g., China) and the reluctance of key
producers (like the KSA) to intervene to stabilize prices, etc., has led to the current
run of falling price levels6
.
The global oil market appears strongly buffeted by strong influences on both sides of
the supply and demand spectrum. For instance, American crude oil output is up
almost by about 80% since 2008, implying an addition of around 4 million barrels a
day7
. It is notable that the number is higher than crude barrels produced by any of
OPEC’s (Organization of the Petroleum Exporting Countries) members8
, excluding the
KSA9
. Meanwhile, Canadian oil sands have augmented supply by one million barrels
per day over the same period. For members of OPEC, the downward fluctuations in
the oil price can have worrisome results, especially in terms of the breakeven price of
oil. OPEC member countries produce around 40% of the global crude oil10
.
4
Oil&Gas Journal
5
MarketWatch, Inc.
6
Thomson Reuters
7
The Financial Times Ltd
8
The member countries of the OPEC are Algeria, Angola, Ecuador, Iran, Iraq, Kuwait, Libya, Nigeria, Qatar, Saudi Arabia, United Arab
Emirates, and Venezuela
9
Ibid.
10
U.S. Energy Information Administration
50
60
70
80
90
100
110
120
130
2/Jan/13
2/Feb/13
2/Mar/13
2/Apr/13
2/May/13
2/Jun/13
2/Jul/13
2/Aug/13
2/Sep/13
2/Oct/13
2/Nov/13
2/Dec/13
2/Jan/14
2/Feb/14
2/Mar/14
2/Apr/14
2/May/14
2/Jun/14
2/Jul/14
2/Aug/14
2/Sep/14
2/Oct/14
2/Nov/14
2/Dec/14
Brent Crude WTI
The global oil market
appears strongly
buffeted by strong
influences on both
sides of the supply and
demand spectrum.
Weaker demand and
raised supply caused a
slump for almost 2
years in the oil price
levels.
3. MARKAZ RESEARCH
Cheaper Oil – January 2015
Kuwait Financial Centre “Markaz” 3
Figure 2: OPEC Members Oil Break-even Price Points, in US$, 2013
Source: The Institute of International Finance, Inc.; Reuters survey11
(For Nigeria, Ecuador,
Venezuela and Angola)
The strategic changes in policy that the current price drop is creating are clearly
evident. For instance, the KSA’s crude exports dropped in August 2014 for the fourth
month in a sequence to reach their lowest point in three years12
. This is largely seen
as a sign that the KSA is fighting to hold its market share in the wake of weak demand
and abundant supplies from other producers. In fact, a growing refrain is that there
is a shift of power underway in the global oil architecture, with OPEC slowly losing its
hold over the global market in terms of its ability to dominate production and pricing13
.
One of the transformational events that have upended the supply dynamics in the
global energy industry in recent years is the U.S. shale revolution. Not only was the
scale of the U.S. shale revolution not expected, but it has caused the pendulum to
swing from fears of energy scarcity and high prices in the U.S. to abundance and
resurgent talks of energy independence14
. According to the U.S. Energy Information
Administration (EIA), American crude oil production averaged around 8.5 million
barrels per day in July 2014, the highest level since April 1987 (approximately 27
years)15
. The spike in domestic production has resulted in a decline in petroleum
imports into the U.S. In fact, in 2015, the share of imported petroleum in total U.S.
consumption is expected to fall to 22% in 2015, which is a large fall from 33%
recorded in 201316
. The share of imports in 2015 is thus expected to be the lowest
since 1970.
11
Thomson Reuters
12
Ibid.
13
The Wall Street Journal
14
Oxford Institute for Energy Studies
15
Thomson Reuters
16
Ibid.
$128 $124 $122 $120 $117
$111 $109
$94 $93
$68
$54 $52
$0
$20
$40
$60
$80
$100
$120
$140
The strategic changes in
policy that the current price
drop is creating are clearly
evident.
One of the transformational
events that have upended
the supply dynamics in the
global energy industry in
recent years is the U.S. shale
revolution.
4. MARKAZ RESEARCH
Cheaper Oil – January 2015
Kuwait Financial Centre “Markaz” 4
Figure 3: U.S. Imports of Crude Oil (Thousands of Barrels), 1970-2013
Source: U.S. EIA
Given Saudi Arabia’s dominance in the global oil market and in the OPEC grouping, it
would be useful to consider the imports into the U.S. from Saudi Arabia, in terms of
crude.
Figure 4: U.S. Imports from Saudi Arabia of Crude Oil and Petroleum
Products (Thousand Barrels per Day), 2000-2013
Source: U.S. EIA
It is notable from the above chart that from the peak of 1,774 thousand barrels per
day, over a decade ago in 2003, the level came down to 1,329 thousand barrels per
day in 2013, a drop of close to 34%. With the advent of the shale age in the U.S. in
2005, American net oil imports fell every year between 2005 and 2010, from 12.4
million barrels a day in 2005 to 9.4 Mb/d in 201017
. Many analysts point out that the
drop was due a large part to the policy of driving down of oil imports by boosting
domestic production. Another case in point is Nigeria. Up until four years ago, Nigeria,
an OPEC member, ranked among the top-5 oil suppliers to the U.S18
. But in July 2014,
the U.S. did not even import a single barrel of Nigerian crude, prompting media calls
that Nigeria is the first country to have lost the U.S. business completely due to
17
Federation of American Scientists
18
The Financial Times Ltd
0.0
500.0
1,000.0
1,500.0
2,000.0
2,500.0
3,000.0
3,500.0
4,000.0
1970
1972
1974
1976
1978
1980
1982
1984
1986
1988
1990
1992
1994
1996
1998
2000
2002
2004
2006
2008
2010
2012
ThousandsofBarrels
0.0
0.2
0.4
0.6
0.8
1.0
1.2
1.4
1.6
1.8
2.0
Thousands
Given KSA’s dominance in
the global oil market and in
the OPEC grouping, it would
be useful to consider the
imports into the U.S. from
KSA, in terms of crude.
Many analysts point out that
the drop in imports was due
a large part to the policy of
driving down of oil imports
by boosting domestic
production.
5. MARKAZ RESEARCH
Cheaper Oil – January 2015
Kuwait Financial Centre “Markaz” 5
American shale revolution19
. In terms of rate of increase in supply, a comparison
between the U.S. and the Saudi Arabia would be useful, again.
Figure 5: Percentage Increases in Year-on-Year Oil Production, 2005-
2013, the U.S. and the KSA
Source: BP Statistical Review of World Energy, 2014
From the above chart, it is clearly visible that when considered in terms of YoY growth
in production, the U.S. has maintained a steady positive rate since 2009; while the
KSA trended into negative territory in 2013. In this context, it could prove ominous
for OPEC that if the American government removes restrictions on exporting crude
that were put in place after the oil shock of the early 1970s, U.S. producers could get
an additional $5 a barrel, which could boost output by 350,000 to 450,000 barrels a
day20
.
Meanwhile, in October 2014, the International Energy Agency (IEA) cut its 2014
estimate for global oil demand growth by 200,000 barrels per day to 0.7 million barrels
per day, citing strong supply and weak demand21
. In what market circles consider a
rare remark of the IEA on OPEC’s strategy, the former commented that OPEC “…may
no longer be willing or able to adjust production as the market has been transformed
by the U.S. shale oil revolution.”22
The IEA also cut its estimate for demand for OPEC’s
crude by 200,000 barrels per day for 2015 to 29.3 million barrels per day, which was
over 1 million bpd below mid-October (2014) production levels23
. Thus, the current
drop in oil prices may herald a timeframe of transition in which OPEC begins gradually
losing its dominant share in the global oil production.
19
Ibid.
20
Bloomberg L.P.
21
Thomson Reuters
22
Ibid.
23
Ibid.
-15.0%
-10.0%
-5.0%
0.0%
5.0%
10.0%
15.0%
2005 2006 2007 2008 2009 2010 2011 2012 2013
US KSA
The U.S. has maintained a
steady positive rate in
production since 2009; while
the KSA trended into
negative territory in 2013.
The IEA also cut its estimate
for demand for OPEC’s crude
by 200,000 barrels per day
for 2015 to 29.3 million
barrels per day.
6. MARKAZ RESEARCH
Cheaper Oil – January 2015
Kuwait Financial Centre “Markaz” 6
Figure 6: OPEC’s Share in World Oil Production2009-2014(e) in
Comparison with the U.S., %
Source: BP, U.S. EIA
In the oil slumps of the past, OPEC had often cut down on supply to support oil prices24
.
For instance, when the 2008 financial crisis resulted in a collapse in oil demand and
prices precipitously fell, OPEC cut down 4.2 million barrels a day from their overall
production quota in order to stabilize the market25
. Moreover, even as the demand-
supply outlook also is not in favour of OPEC, it is compounded by the fact that key OPEC
member countries are reluctant to slash back on output, despite falling prices, due to
competition for Asian market shares. For instance, in early October 2014, the KSA and
Iran cut back on the pricing offered to Asian buyers, raising fears of a competitive
pricing race between some members of the OPEC, itself26
.
In hindsight, many analysts are now pointing out that prices of over $100 per barrel
for oil was unsustainable in terms of an extremely long run due to the issue that it
incentivizes the quest for new supply (e.g., spawning of more and more private shale
producers) and creates conditions for demand destruction by making oil an almost
unaffordable commodity for many struggling nations27
. Some analyst estimates
classify about a third of American shale production as uneconomical if oil prices were
to stay at about $80 a barrel28
. Lower oil prices tend to generate disincentives for
investments in new projects, particularly those involving large startup costs, like deep-
water and Arctic explorations, thereby impacting long-term crude supply29
.
There are several who ascribe geopolitical rivalries to the current drop in oil prices,
too, as it impacts players such as Russia and Iran, whose budgets require oil prices
over $100 for break-even30
. It is notable that countries such as the KSA can weather
lower prices for a sustained time frame due to the flush fiscal reserves that were
constructed strategically over the years. The following table displays the impact on
varying levels of government assets against the backdrop of a scenario of a sustained
oil price of $83 per barrel.
24
Ibid.
25
Ibid.
26
The Wall Street Journal
27
Arab News
28
Bernstein Research
29
Al Jazeera America, LLC.
30
Ibid.
41.8% 42.1% 42.7%
43.4%
42.4%
39.0%
8.9%
9.1%
9.4%
10.3%
11.5%
15.1%
0.0%
5.0%
10.0%
15.0%
20.0%
25.0%
30.0%
35.0%
40.0%
45.0%
50.0%
2009 2010 2011 2012 2013 2014
OPEC U.S.
In the oil slumps of the past,
OPEC had often cut down on
supply to support oil prices.
In hindsight, many analysts
are now pointing out that
prices of over $100 per
barrel for oil was
unsustainable in terms of an
extremely long run.
7. MARKAZ RESEARCH
Cheaper Oil – January 2015
Kuwait Financial Centre “Markaz” 7
Table 2: Level of Government assets and the Ability to Absorb Oil Price Shocks
Country Government Assets Budget deficit at $83bbl
USD bns % GDP USD bns
Years of
assets
Nigeria 4.1 2.4 16.4 0.3
Russia 173.0 8.5 45.4 3.8
KSA 446.9 58.1 56.8 7.9
Source: Deutsche Bank, October 2014
The current oil oversupply has coincided, also, with a slowing down effect in key
economies such as China and Germany31
. The German economy shrank by 0.2% in
the second quarter of 2014 and is expected to see a contraction in the third quarter,
as well32
. Meanwhile, China is expected to register a slower pace of growth (in terms
of China’s recent growth standards) of 7% in 2014, which when compared with 10%
in 2010, appears like a slowing down of the economy. Even as the complex forces of
demand and supply in an interconnected and globalized world fluctuate to create
uncertainties in oil prices, it is notable that the current market situation can act as a
catalyst for undertaking comprehensive economic reforms for many GCC nations33
.
According to the International Monetary Fund (IMF), a sustained oil price fall of $25,
effectively, has the potential to reduce the revenue of multiple GCC countries by about
8% of their respective GDPs. Thus, low oil prices can be a harbinger of prolonged
fiscal deficits.
In the unfolding regime of dropping oil prices, many analysts and planners are
watching the actions of Saudi Arabia, closely. As a pattern, Saudi Arabia has stepped
in over the past decades to slow down production when oil prices threatened to fall
steeply. Spread across decades, the Saudi strategy of tactical production cutbacks to
stabilize prices is evident. The cases in point are cutbacks in 1985-86, 1998-99, 2001-
02 and in 2008-0934
. This time, even as the oil prices were sliding from the middle of
2014, Saudi Arabia offered price reductions, in early October 2014, to some of its
largest customers, principally in Asia. Saudi Arabia, however, defended the move as
aimed at boosting margins for Asian refiners who were finding it difficult to process
the crude with profitable margins35
. This prompted Iran to cut its official November
2014 oil selling prices to customers in Asia, the largest discount in nearly six years36
.
For many analysts, the reticence of Saudi Arabia to relive its traditional swing producer
in terms of stabilizing prices, and the offering of further price discounts, hinted at a
strategy of preserving market share through aggressive pricing37
.
31
The Economist Newspaper Limited
32
Ibid.
33
Thomson Reuters
34
Ibid.
35
Bloomberg L.P.
36
Ibid.
37
Ibid.
The current oil oversupply
has coincided, also, with a
slowing down effect in key
economies such as China and
Germany.
In the unfolding regime of
dropping oil prices, many
analysts and planners are
watching the actions of Saudi
Arabia, closely.
8. MARKAZ RESEARCH
Cheaper Oil – January 2015
Kuwait Financial Centre “Markaz” 8
Analysts are also quick to point out that the Saudi decision to not cut back on
production could possibly be aimed at driving away marginal and potential producers
in the global oil industry38
. From slowing down investments by shale producers in the
U.S. to making it difficult for Russia, which is already facing West-led sanctions, to
exploit its vast shale deposits, the potential pay-off can be promising for those who
benefit from the current global oil order39
. A strategy of allowing oil prices’ slide to
prevail could, according to some industry observers, slow down the movement of the
U.S. shale industry down the production cost curve, which might force an industry
shakeout in America, thus resulting in cutbacks in global supplies40
. The expectation
may be of allowing an uptick in oil prices once relatively new and potential entrants
are forced out of the world market due to reduced pay backs on their investments. It
is notable that towards the end of October 2014, the U.S. Federal Reserve’s cheerier
outlook for the U.S. economy caused the U.S. dollar to rise in value that, consequently,
had a dampening impact on the Brent oil price41
. A stronger U.S. dollar makes dollar-
priced commodities, like oil, more expensive for many buyers around the world42
. This
indicates that oil is a highly strategic commodity, which is interlinked in a myriad
number of ways with many levers of the global economic architecture.
From the oil exporters’ perspective, the fall in oil prices can have the consequence of
rearranging the commercial order in terms of transferring more power into the hands
of clients. Resources will get shifted to consumers from producers, which will, albeit,
have an overall positive impact on the global GDP43
. According to the IMF, a 10%
reduction in the price of oil is connected with about a 0.2% rise in world GDP44
. This
could have an impact on the pace of growth of non-hydrocarbon sectors in the oil-
exporting gulf countries.
Figure 7: Brent oil vs. TASI & Kuwait price index (Rebased), 2003-Present
Source: Reuters
38
The Wall Street Journal
39
The Financial Times Ltd
40
Thomson Reuters
41
Ibid.
42
Ibid.
43
The Economist Newspaper Limited
44
Ibid.
0
100
200
300
400
500
600
Oil Saudi Kuwait Price
R1 R2F1
F2
Analysts are also quick to
point out that the Saudi
decision to not cut back on
production could possibly be
aimed at driving away
marginal and potential
producers in the global oil
industry.
The pressures on both sides
of the oil demand-supply
equation appear convoluted
and many ‘black swans’ dot
the landscape.
9. MARKAZ RESEARCH
Cheaper Oil – January 2015
Kuwait Financial Centre “Markaz” 9
In the above graph we have rebased the index values of Saudi’s TASI index, Kuwait’s
Price index, and the Brent crude values from 2003 till present. Looking at the
movement of the prices, it can be seen that prior to 2008, the index values
approximately followed the movement in oil prices. The rise in oil price from 2006 to
June 2008 (R1, 132%) is mimicked by the Kuwait price index (54%), and to a certain
extent by the TASI index (18%). Increase in gasoline consumption by close to 2%,
strengthening US dollar, and geopolitical tensions in Turkey, Iraq, Iran, Lebanon and
Nigeria are cited as reasons for the increase in oil price. A few Gulf markets, on the
other hand, were recovering from the 2006 crash, in which the Saudi index lost 65%
of its market capitalization. Kuwait stock market was far less speculative and volatile
compared to its Saudi counterpart, and was spared from the crash. Saudi’s CMA
opened up the stock market to GCC nationals in 2007 and reduced speculative capital
inflows, which improved market participation, governance and liquidity. Rise in
consumption of oil and geopolitical tensions affecting other oil exporters also, caused
Saudi and Kuwait to increase oil production, which provided the economic recovery
in the form of oil surpluses.
The dramatic fall in oil price (F1, -68%) during Jul and Dec 2008 led to the fall in
index values of both Saudi Arabia (-49%) and Kuwait (-50%). The fall in oil price was
due to easing of tensions between US and Iran, and US lifting ban on offshore drilling.
Buoyant economic activity, rising consumer and investor confidence, and abundant
liquidity during the oil boom spurred excessive credit growth, inflation, and asset price
increases. The GCC economies were affected by both corporate and sovereign
leverage, which were directly affected by the fall in oil prices. All this led to tightening
of liquidity in the markets, which was amplified by the onset of the global financial
crisis. The effect of the subprime crisis was also felt both in the oil and equity markets
markets, as brent crude price declined by USD 100 per barrel during the period to
USD 46 per barrel.
After 2008, the relationship changes slightly. The gradual increase in oil price (R2,
168%) seen from early 2009 till Apr 2011, had little or nil effect on the index values
of both these oil exporting countries (Saudi 40%, Kuwait -16%). Supply concerns,
due to geopolitical issues, and rise in demand, with the emergence of major
conusmers in China and India, were the main reasons for the increase in oil price.
Political turmoil in Egypt, Libya, Yemen, and Bahrain drove up oil prices in February
2011. The crisis soon spread across the MENA region, driving up oil prices to record
highs. The Arab spring uprising affected investor confidence in the region, and also
increased volatility in the stock markets. Saudi improved its infrastructure to assist in
growth of non-hydrocarbon sectors.
Finally, the sharp fall in prices in the second half of 2014 (F2, -39%), affected both
the indices after a lag (Saudi -11%, Kuwait -3%). The reasons for the fall in oil prices
have been addressed in previous sections, while the markets are wary of medium to
long term effect of lower oil prices in government spending.
The change in relationship, between oil price movements and Saudi and Kuwait index
movements, after 2008 could be attributed to the respective governments’ increasing
efforts to diversify their economies away from the hydrocarbon sector. With the
increase in number of companies in the non-oil sectors corporate profits determined
the movement of the markets. Higher oil prices, while giving the government the
necessary cushion for increasing investments, had little effect on corporate profits. In
the case of Saudi and other GCC countries, oil surpluses were accumulated and
Rise in consumption of oil
and geopolitical tensions
affecting other oil exporters
also, caused Saudi and
Kuwait to increase oil
production, which provided
the economic recovery in the
form of oil surpluses.
The change in relationship,
between oil price movements
and Saudi and Kuwait index
movements, after 2008 could
be attributed to the
respective governments’
increasing efforts to diversify
their economies away from
the hydrocarbon sector.
10. MARKAZ RESEARCH
Cheaper Oil – January 2015
Kuwait Financial Centre “Markaz” 10
invested, mostly in foreign markets, in the form of Sovereign Wealth Funds. Hence,
there was little to no effect of oil prices climbing up on index values.
But lower oil prices affect investor sentiments, as fears of government curtailing
spending, impact the markets. While countries such as Saudi Arabia and Kuwait have
surpluses to fall back on in case of sustained low oil prices, over the longer term they
would have a negative effect on the markets due to slowing down of economic
expansion. This would affect corporate profits, which in turn impacts the stock
markets. The lag effect on index values due to drop in oil prices (F2), is because of
nil production cuts announced by Saudi Arabia, which would have medium term effect
on oil prices.
Conclusion
The pressures on both sides of the oil demand-supply equation appear convoluted
and many ‘black swans’45
(e.g., emergent and unexpected geopolitical developments)
dot the landscape. Stagnant recoveries in Japan and Europe are expected to keep
demand for oil soft; while the massive supply shock, largely from North America, is
expected to bolster supply over the short-term, at least. IMF recently reduced its
forecast for global growth next year to 3.38 percent in 2014, and 3.8 per cent in
2015, from a July prediction of 3.4 percent in 2014 and 4.0 percent in 2015, supported
by a host of weak indicators from Europe and China, which is expected to lead to a
tepid global demand, and in turn affect the earnings of corporations worldwide. Oil
prices, on a four year low, have already prompted many importers (for eg. China) to
hoard the commodity, which would affect future demand when prices recover.
According to the most recent projections by EIA, Brent prices in 2015 will average
USD 68 per barrel, and WTI will average USD 63 per barrel. Other forecasts for 2015
Brent crude were provided by international organizations, such as Reuters, S&P, EIU
and top investment banks such as Morgan Stanley, that ranged from USD 60 per
barrel to USD 80 per barrel. In general, price forecasts for oil have projected a modest
recovery over the next year, which may well be revised down if oil continues down
the present slope.
For Gulf economies, even those with the accumulated oil surplus cushions, if oil prices
persist at current or lower levels over a long term, deficit situations may ensue. For
countries such as Saudi Arabia and the UAE, there will be pressure on their
governments to slow down the rate of investment expenditure, and governments may
need to balance their budgets, and curtail spending, which could dampen economic
growth. Although the oil-exporting Gulf countries can easily finance a deficit, they
may prefer to avoid debt financing, or at the very least minimize it as much as
possible. OPEC countries are already forecasted to lose around billions of dollars,
affecting both their ability to support their expanded budgets post Arab-spring.
The best course of action for the GCC would be to intensify its economic diversification
efforts so as to not be impacted negatively by grievous oil industry shocks over the
long-term future. As alluded to earlier, oil is a highly strategic commodity whose price
undulations are underpinned by a complex network of economic movements raising
from various parts of the world.
45
The black swan theory was developed by Nassim Nicholas Taleb and covers events that are a surprise (to the observer), have a
major impact, but that once they have happened are rationalised as having been foreseeable. [Sourced verbatim from the Australian
government’s Public Sector Innovation Toolkit]
Lower oil prices affect
investor sentiments, as fears
of government curtailing
spending, impact the
markets.
For Gulf economies, even
those with the accumulated
oil surplus cushions, if oil
prices persist at current or
lower levels over a long
term, deficit situations may
ensue.
11. MARKAZ RESEARCH
Cheaper Oil – January 2015
Kuwait Financial Centre “Markaz” 11
In closing, it can be said that a price rise could very well on the way if the low prices
push out marginal suppliers and hamper new investments looking for better profits.
However, as in the past, oil prices still retain the knack to surprise!
Table 3: Key Oil Metrics
Key Oil Metrics
Oil Price (21 Dec'14)
Brent 61.38
WTI 57.75
World Oil Demand (mb/d)
2013 90.14
2014f 91.13
2015f 92.26
World Oil Supply (mb/d)
OPEC
2013 31.599
2014f 30.808
Non-OPEC
2013 54.23
2014f 55.95
2015f 57.31
Total world crude oil reserves (mb) 1,489,865
OPEC reserves (mb) 1,206,170
OPEC reserves (%) 81%
Source: OPEC, IEA
12. MARKAZ RESEARCH
Cheaper Oil – January 2015
Kuwait Financial Centre “Markaz” 12
Disclaimer
This report has been prepared and issued by Kuwait Financial Centre K.P.S.C (Markaz), which is regulated by the Capital Markets Authority
and the Central Bank of Kuwait. The report is owned by Markaz and is privileged and proprietary and is subject to copyrights. Sale of any
copies of this report is strictly prohibited. This report cannot be quoted without the prior written consent of Markaz. . Any user after
obtaining Markaz permission to use this report must clearly mention the source as “Markaz “. The report is intended to be circulated for
general information only and should not to be construed as an offer to buy or sell or a solicitation of an offer to buy or sell any financial
instruments or to participate in any particular trading strategy in any jurisdiction.
The information and statistical data herein have been obtained from sources we believe to be reliable but no representation or warranty,
expressed or implied, is made that such information and data is accurate or complete, and therefore should not be relied upon as such.
Opinions, estimates and projections in this report constitute the current judgment of the author as of the date of this report. They do not
necessarily reflect the opinion of Markaz and are subject to change without notice. Markaz has no obligation to update, modify or amend
this report or to otherwise notify a reader thereof in the event that any matter stated herein, or any opinion, projection, forecast or
estimate set forth herein, changes or subsequently becomes inaccurate, or if research on the subject company is withdrawn.
This report may not consider the specific investment objectives, financial situation and the particular needs of any specific person who
may receive this report. Investors are urged to seek financial advice regarding the appropriateness of investing in any securities or
investment strategies discussed or recommended in this report and to understand that statements regarding future prospects may not
be realized. Investors should note that income from such securities, if any, may fluctuate and that each security’s price or value may rise
or fall. Investors should be able and willing to accept a total or partial loss of their investment. Accordingly, investors may receive back
less than originally invested. Past performance is not necessarily indicative of future performance.
Kuwait Financial Centre K.P.S.C (Markaz) may seek to do business, including investment banking deals, with companies covered in its
research reports. As a result, investors should be aware that the firm may have a conflict of interest that could affect the objectivity of
this report. This report may provide the addresses of, or contain hyperlinks to, websites. Except to the extent to which the report refers
to website material of Markaz, Markaz has not reviewed the linked site and takes no responsibility for the content contained therein. Such
address or hyperlink (including addresses or hyperlinks to Markaz’s own website material) is provided solely for your convenience and
information and the content of the linked site does not in any way form part of this document. Accessing such website or following such
link through this report or Markaz’s website shall be at your own risk.
For further information, please contact ‘Markaz’ at P.O. Box 23444, Safat 13095, Kuwait; Email: research@markaz.com ; Tel: 00965
1804800; Fax: 00965 22450647.
13. Research Library (Complimentary Research)
Capital Markets
Researches
Daily Morning Brief
Kuwait Daily
Fixed Income Update (Daily)
Monthly MENA Markets Review
International Market Update (Monthly)
GCC Equity Risk Premium (Quarterly)
GCC Corporate Earnings (Half Yearly)
GCC Markets Outlook (Half Yearly)
Global Markets Outlook (Annual)
Saudi Arabian Markets Set to Open (2014)
MENA Asset Management Policy Perspectives
(2013)
IncludingGCC in the MSCI EM Index (2012)
Alpha Abound: A Study to explore Alpha
generation in GCC (2012)
Kuwait Investment Sector (2012)
GCC Defensive Bellwether Stocks (2012)
GCC SWFs: The Golden Portfolio (2010)
Persistence in performance: The GCC Experience
(2010)
This Too Shall Pass: What can we expect in 2009
for GCC Markets? (2009)
Mr. GCC Market-Manic Depressive (2008)
To Yield or Not To Yield: Examiningthe Potential
of Yield Stocks in GCC (2008)
Derivatives Market in GCC (2007)
Regulatory
Researches
GCC Regulatory Digest (Quarterly)
Kuwait's BOT law (2014)
LandReforms in Kuwait (2014)
Kuwait’s PPP Law (2013)
Bankruptcy Law in the GCC (2013)
Got a CMA (Kuwait): What Next? (2012)
The New Regulationsfor Kuwait Investment
Sector (2010)
Wanted: A Kuwait Capital Market Authority
(2010)
To Leap or To Lag: Choicesbefore GCC
Regulators (2007)
Policy
Researches
Oil & Gas Markets and the Emergence of New
Resources (2014)
GCC Countries & Asia: Bolstering Energy Ties
(2014)
GCC Energy Strategies: The Way Forward (2014)
Blueprint for Public Sector Good Governance in
Kuwait (2013)
Kuwait - Private LaborMarket (2013)
Kuwait - Alternatives for Power Generation
(2013)
Kuwait - Sustainable Power Strategy (2012)
Tools to Strengthen & Support Kuwait's Private
Sector (2012)
Daily
Morning Brief Fixed Income Update
Kuwait Daily
Monthly
MENA Markets Review
International Market Update
Quarterly
Equity Risk Premium
GCC Regulatory Digest
Halfyearly
GCC Markets Outlook
GCC Corporate Earnings
Annual
Global Markets Outlook
Periodic
Reports
Cheaper Oil (2015)
Rising Fuel Prices in Kuwait (2015)
CloudComputing (2014)
GCC Free Trade Zones (2014)
Disruptive Technology: Bitcoins (2014)
The Internet of Things ! Big Data (2014)
Kuwait Credit Growth (2014)
Kuwait SME’s (2014)
Multiple directorships in KSA (2013)
GCC Demographic Shift (2012)
How is GCC preparing for a “AA+” World?
(2011)
Kuwait Development Plan (2011)
Political Risk moving to the forefront in MENA:
Impact Analysis (2011)
Diworsification- The GCC Oil Stranglehold
(2009)
The Vicious“Square”: Monetary Policy Options
for Kuwait (2008)
Economic
Researches
A subsidiary
www.e-marmore.com
14. Research Library (Paid Research)
A subsidiary
Infrastructure
Researches*
Power
GCC MENA (Ex- GCC)
Egypt KSA
Kuwait UAE
Qatar
Ports
GCC KSA
Kuwait UAE
Qatar Oman
Aviation
GCC
GCC Full Service
Carriers
GCC Low Cost Carriers Kuwait
KSA UAE
Water
GCC Qatar
KSA Kuwait
ICT
GCC KSA
UAE Kuwait
Qatar
RoadsandRailways
GCC KSA
Qatar
RealEstate
GCC Office RE GCC Affordable Housing
GCC Residential RE
Sector
Researches*
Healthcare
GCC, KSA
Education
GCC, KSA
Family Business
GCC
WealthManagement
GCC
Banking
GCC, Kuwait
Hospitality
GCC
Retail
GCC, Luxury - GCC, Online – GCC
Asset Management
MENA, KSA, UAE, Egypt
IslamicFinance
GCC
Investment Banking
GCC
Insurance
GCC, KSA
Media
GCC - Print, TV, Digital
SocialMedia
GCC
Petrochemicals
GCC, Kuwait, KSA
Contracting
GCC
Metals& Mining
GCC
Research- KnowledgeGap
GCC
FIFAWorldCup2022
Qatar
WomenInvestors
GCC
Corporate
Profiles*
Abu Dhabi National Hotels Co (UAE)
Air Arabia (UAE)
EMAAR Properties (UAE)
Kuwait Food Co (Kuwait)
Qatar InsuranceCo (Qatar)
Qatar NationalBank (Qatar)
SABIC (KSA)
Saudi Electricity Co (KSA)
Saudi Telecom (KSA)
Savola Group (KSA)
The National Shipping Co. of Saudi Arabia -
BAHRI (KSA)
*Paid reports ranging from
US$250-$500
Access Our
Reports
Bloomberg - “MRKZ” <Go>
Thomson Research,
Reuters Knowledge
Nooz
Zawya Investor
ISI Emerging markets
Capital IQ
FactSet Research Connect
TheMarkets.com
www.e-marmore.com
15. Subscription Options
A subsidiary
Selective Access
www.e-marmore.com
Download up to 5 paid reports in a year
• Select and download 5 reports from our database of paid research reports. Subscription is
valid for a year.
• New reports are constantly being added to our database, providing an option to download
latest reports within the subscription period.
Wide Access
Download up to 10 paid reports in a year
• Select and download 10 reports from our database of paid research reports. Subscription is
valid for a year.
• New reports are constantly being added to our database, providing an option to download
latest reports within the subscription period.
USD 2,000 / Yr.
USD 1,000 / Yr.
Unrestricted Access
Access and download all our paid reports for a year
• Select and download any report from our database of paid research reports. Subscription is
valid for a year.
• New reports are constantly being added to our database, providing an option to download
latest reports within the subscription period.
Best
Value USD 3,000 / Yr.
Note:
• The above pricing is to obtain a single user license to use the PDF report file for one user only. If you
wish to subscribe for more than one user, please send us an enquiry at info@e-marmore.com
• Select reports priced US$1,000 and more are excluded from the Subscription Packages.
• For reports that are available for download on “On Request”, the subscriber will be required to send the
request.
16. Marmore MENA Intelligence
A ‘Markaz’ Subsidiary
About Marmore
Marmore MENA Intelligence Ltd. (Marmore) caters to the growing research and information needs of
organizations in the Middle East and North Africa (MENA) region. We offer full-fledged research services
covering economies, capital markets, sectors and companies - focused on the MENA region.
We also provide research services to assist our clients in investment decision-making, scanning markets to
identify investment opportunities, conducting ad-hoc researches to understand niche market segments, and
other need-based, bespoke researches.
To know more about us, please visit our website at www.e-marmore.com or write to us on
info@e-Marmore.com or call us at +965-2224 8280.
A subsidiary
www.e-marmore.com
Research On Demand
We conduct customized researches based on specific
requirements of our clients
Understand client’s
requirements
Develop
scope of
work
Identify
required
deliverables
Plan research
activities
Develop estimated
effort for research
work
Gather
research
data
Analyze
data
Prepare report
and presentation
Research
Process
Client’s
requirements
Client’s
briefing
to Marmore
Marmore
conducts the
research
Report
presentation
to client
Meeting specific
requirements
Overcoming
research
challenges
Cost
effectiveness
Focus on quality
Access to large
database
End-to-end
solutions
Government
bodies
Policy makers
Asset
Management
companies
Investment
Banks
Stock brokers
Consultants &
Audit firms
Corporate and
SMEs
Challenges
Cost
Times
Scope
Data
Resources
Management
Outcomes
Information on
client’s
specific
requirements
Greater
confidence
Customized
solutions
Comprehensive
research
scope
Research Methodology
Research
Rationale
Key
Beneficiaries
Research on Demand