SlideShare uma empresa Scribd logo
1 de 29
Baixar para ler offline
SCHOOL OF ARCHITECTURE, BUILDING AND DESIGN
BACHELOR OF QUANTITY SURVEYING (HONOURS)
QSB60303 DEVELOPMENT ECONOMICS
AUGUST 2018 SEMESTER
GROUP ASSIGNMENT
GROUP MEMBERS:
NO. NAME STUDENT ID
1. PANG KAI YUN 0319802
2. EVON WEE YEE JING 0325091
3. LEE ZHI XIN 0324563
4. LIM KAR YAN 0325602
5. SAM WEI YIN 0320364
6. SANDRABROOKE GOH 0329884
7. TERENCE TAN PENG ONG 0320275
8. WONG DE-VIN 0319814
LECTURER : ​MS TAY SHIR MEN
PUAN NURULHUDA HASHIM
SUBMISSION DATE : ​28 NOVEMBER 2018
TABLE OF CONTENTS
CONTENT PAGE NUMBER
1.0 Number of Unit 2
2.0 Financial Appraisal 4
3.0 Cash Flow based on ‘Sell-then-Build’ concept
3.1 Monthly Cash Inflow
3.2 Monthly Cash Outflow
3.3 Quarter-Yearly Cash Flow
8
8
12
16
4.0 NPV
4.1 Comment on the viability of the project
20
21
5.0 Cash Flow based on a ‘Build-then-Sell’ concept 22
Reference 24
Appendix 25
1
1.0 Number of Unit
A Land Size
10 acres 10 x 43,560.00 sq. ft = 435,600.00 sq. ft
1 rood 1 x 10,890.00 sq. ft = 10,890.00 sq. ft
10 pole 10 x 272.25 sq. ft = 2,722.50 sq. ft
449,212.50 sq. ft
B Double Storey Shop/Office (26' x 80')
15% of total unit 15% x 164 unit = 24 unit
Number of unit
Allow an additional 13' x 80' for corner unit; 4' x 80' for end unit
Intermediate unit (26' x 80') 2,080 x 18 unit = 37,440 sq. ft
Corner unit (39' x 80') 3,120 x 3 unit = 9,360 sq. ft
End unit (30' x 80') 2,400 x 3 unit = 7,200 sq. ft
24 unit 54,000 sq. ft
Maximum 15 units / block
Number of block 24 / 10 unit = 2.4 block
or say = 3 block
C Double Storey Terrace (22' x 75')
Number of unit
Allow an additional 11' x 75' for corner unit; 4' x 75' for end unit
Intermediate unit (22' x 75') 1,650 x 63 unit = 103,950 sq. ft
Corner unit (33' x 75') 2,475 x 7 unit = 17,325 sq. ft
End unit (26' x 75') 1,950 x 7 unit = 13,650 sq. ft
77 unit 134,925 sq. ft
Maximum 15 units / block
Number of block 77 / 12 unit = 6.4 block
or say = 7 block
D Double Storey Low Cost (20' x 60')
30% of development 30% x 269,527.50 sq. ft = 80,858.25 sq. ft
Number of unit
Allow an additional 10' x 60' for corner unit; 4' x 60' for end unit
Intermediate unit (20' x 60') 1,200 x 53 unit = 63,600 sq. ft
Corner unit (30' x 60') 1,800 x 5 unit = 9,000 sq. ft
End unit (24' x 60') 1,440 x 5 unit = 7,200 sq. ft
63 unit 79,800 sq. ft
Maximum 15 units / block
Number of block 63 / 15 unit = 4.2 block
or say = 5 block
1.0 Number of Unit
E Development area
60% of Land Area 60% x 449,212.50 sq. ft = 269,527.50 sq. ft
Double Storey Shop/Office = 54,000.00 sq. ft
Double Storey Terrace = 134,925.00 sq. ft
Double Storey Low Cost = 79,800.00 sq. ft
268,725.00 sq. ft
*Not exceeding 60% of land area
2.0 Financial Appraisal
A Gross Development Value (GDV) RM RM
Double Storey Shop/Office
Intermediate unit RM 850,000.00 x 18 = 15,300,000.00
Corner unit RM 1,600,000.00 x 3 = 4,800,000.00
End unit RM 1,000,000.00 x 3 = 3,000,000.00
23,100,000.00
Double Storey Terrace
Intermediate unit RM 400,000.00 x 63 = 25,200,000.00
Corner unit RM 650,000.00 x 7 = 4,550,000.00
End unit RM 500,000.00 x 7 = 3,500,000.00
33,250,000.00
Double Storey Low Cost
Intermediate unit RM 45,000.00 x 53 = 2,385,000.00
Corner unit RM 45,000.00 x 5 = 225,000.00
End unit RM 45,000.00 x 5 = 225,000.00
2,835,000.00
59,185,000.00
Less: 7% bumiputra discount from 30% reservation (1,242,885.00)
Total Gross Development Value 57,942,115.00
2.0 Financial Appraisal
B Cost of Developement
B.1 Land Cost
Land Purchased @ RM15.00/fs 449,212.50 x 15.00 = 6,738,187.50
B.2 Building Cost
i. Double Storey Shop/Office
Intermediate Lot 3,600 fs x RM 70.00 x 18 = 4,536,000.00
Corner Lot 6,500 fs x RM 80.00 x 3 = 1,560,000.00
End Lot 3,600 fs x RM 80.00 x 3 = 864,000.00
6,960,000.00
ii. Double Storey Terrace
Intermediate 1,500 fs x RM 75.00 x 63 = 7,087,500.00
Corner 1,500 fs x RM 85.00 x 7 = 892,500.00
End 1,500 fs x RM 85.00 x 7 = 892,500.00
8,872,500.00
iii. Double Storey Low Cost
Intermediate 900 fs x RM 35.00 x 53 = 1,669,500.00
Corner 900 fs x RM 40.00 x 5 = 180,000.00
End 900 fs x RM 40.00 x 5 = 180,000.00
2,029,500.00
Total Building Cost 17,862,000.00
iv. Earthwork
5% of Building Cost RM 17,862,000.00 x 5% = 893,100.00
v. Infrastructure Costs
10% of Building Cost RM 17,862,000.00 x 10% = 1,786,200.00
Total Construction Cost 20,541,300.00
2.0 Financial Appraisal
B.3 Administrative Cost
i. Professional fees
9% of construction costs RM 20,541,300.00 x 9% = 1,848,717.00
ii. Administrative fees
2% of GDV RM 57,942,115.00 x 2% = 1,158,842.30
iii. Plan fees
RM 2,000 per unit RM 2,000.00 x 164 = 328,000.00
iv. Contributions & fees
2% of construction costs RM 20,541,300.00 x 2% = 410,826.00
v. Advertisement & marketing
1% of GDV RM 57,942,115.00 x 1% = 579,421.15
vi. Conversion premium
Commercial @ 20% of land value
54,000.00 fs x RM15 RM 810,000.00 x 20% = 162,000.00
Residential @ 15% of land value
214,725.00 fs x RM15 RM 3,220,875.00 x 15% = 483,131.25
vii. Subdivision
RM 1,500 / unit RM 1,500.00 x 164 = 246,000.00
viii. Legal Fees
RM 2,500 / unit RM 2,500.00 x 164 = 410,000.00
Total Administrative Cost 5,626,937.70
2.0 Financial Appraisal
B.4 Finance Cost
i. Cost of Finance (Assume Full)
5.5% p.a + 6.5% p.a 2 x RM 10,270,650.00 x 12% = 616,239.00
ii. Interest on Loan for Purchase of Land
P[((1+i)^n)-1) RM 6,500,000.00 x [(1+0.09)^5-1] = 3,501,055.71
Total Financing Cost 4,117,294.71
B.5 Contigencies
5% of Construction Cost RM 20,541,300.00 x 5% 1,027,065.00
Gross Development Cost 38,050,784.91
C Gross Profit Excluding Taxation
Gross Development Value (GDV) 57,942,115.00
Development Cost (38,050,784.91)
19,891,330.09
D Rate of Return
% of Gross Profit (Profit/GDV) RM 0.34 x 100% 34%
3.0 Cash Flow based on ‘Sell-then-Build’ concept
3.1 Monthly Cash Inflow
M1 M2 M3 M4 M5 M6 M7 M8 M9 M10 M11 M12
Sales Projection
1 Double Storey Shop/Office 39.03% 22,614,900.00 10.0% 10.0% 10.0% 10.0%
2 Double Storey Terrace 56.18% 32,551,750.00 30.0% 20.0% 20.0% 10.0%
3 Double Storey Low Cost 4.79% 2,775,465.00 50.0%
Monthly Total 100.00% 57,942,115.00 20.76% 0.00% 0.00% 0.00% 0.00% 15.14% 0.00% 0.00% 17.53% 0.00% 0.00% 9.52%
% of Cumulative Sales 20.76% 20.76% 20.76% 20.76% 20.76% 35.90% 35.90% 35.90% 53.43% 53.43% 53.43% 62.95%
Construction Work Programme Months
1 Earthworks + Foundation 3 100.00% 6.92% 6.92% 6.92% 15.14% 17.53% 9.52%
2 R.C. Framework 9 100.00% 2.31% 2.31% 2.31% 4.83% 4.83% 4.83% 10.67% 10.67% 10.67% 9.52%
3 Walls, Doors & Windows Frame 7 100.00% 5.13% 5.13% 8.63% 8.63% 8.63% 13.40%
4 Roofing, Elec Wiring & Plumbing 7 100.00% 7.63% 7.63% 7.63% 10.01%
5 Internal & External Plastering 8 100.00% 6.68% 8.04%
6 Sewerage Works 5 100.00%
7 Drainage Works 6 100.00%
8 Roadworks + Infrastructure Works 8 100.00%
Sales Proceeds
20.76% 15.14% 17.53% 9.52%
1 Signing of S&P Agreement 10.00% 5,794,211.50 1,202,701.50 877,184.00 1,015,957.25 551,666.50
6.92% 6.92% 6.92% 15.14% 17.53%
2 Earthwork + Foundation 10.00% 5,794,211.50 400,900.50 400,900.50 400,900.50 877,184.00 1,015,957.25
2.31% 2.31% 2.31% 4.83% 4.83% 4.83% 10.67% 10.67% 10.67%
3 R.C. Framework 15.00% 8,691,317.25 200,450.25 200,450.25 200,450.25 419,746.25 419,746.25 419,746.25 927,724.88 927,653.26 927,653.26
5.13% 5.13% 8.63% 8.63% 8.63%
4 Walls, Doors & Window Frame 10.00% 5,794,211.50 297,126.50 297,126.50 500,317.95 500,317.95 500,317.95
7.63% 7.63% 7.63%
5 Roofing, Elec Wiring & Plumbing 10.00% 5,794,211.50 442,263.25 442,263.25 442,263.25
6.68%
6 Internal & External Plastering 10.00% 5,794,211.50 386,980.34
7 Sewerage Works 5.00% 2,897,105.75
8 Drainage Works 2.50% 1,448,552.88
9 Roadworks + Infrastructure Works 2.50% 1,448,552.88
10 On the date the Purchaser takes VP of the said 17.50% 10,139,870.13
Property with the water and electricity supply
ready for connection
11 On the date the Purchaser takes VP of the 2.50% 1,448,552.88
said Property in item 10 where the Developer
has delivered to the Purchaser or the Purchaser's
Solicitor the original issue document of title to the
said Building Lot registered in the name of the
Purchaser
12 On the date the Purchaser takes VP of the said 5.00% 2,897,105.75
Property as in item 10 and to be held by the
Developer's solicitor as stakeholder for payment
to the Developer (2.5% at the expiry of the period
8 months; 2.5% at expiry of the period 24 months)
Monthly Total Cash Flow 100.00% 57,942,115.00 1,202,701.50 400,900.50 400,900.50 601,350.75 200,450.25 1,077,634.25 1,296,930.25 716,872.75 1,732,830.00 2,886,263.33 1,870,234.46 2,808,881.30
Monthly Cumulative Cash Inflow 57,942,115.00 1,202,701.50 1,603,602.00 2,004,502.50 2,605,853.25 2,806,303.50 3,883,937.75 5,180,868.00 5,897,740.75 7,630,570.75 10,516,834.08 12,387,068.54 15,195,949.84
Quaterly Total Cash Inflow 57,942,115.00 2,004,502.50 1,879,435.25 3,746,633.00 7,565,379.09
Quaterly Cumulative Cash Inflow 2,004,502.50 3,883,937.75 7,630,570.75 15,195,949.84
Assumptions:
- % of sale proceeds based on S&P agreement (Clause 5) third schedule
- The earthwork and foundation are paid simultaneously.
- The roadworks and infrastructure works are paid simultaneously.
- Item 2 - 9 are paid within 30 days after the receipt by the Purchaser of the Developer's written notice of the completion of such items.
Amount
(RM)
Sales
Precentage
DescriptionItem Q1
2013
Q4Q2 Q3
3.0 Cash Flow based on ‘Sell-then-Build’ concept
3.1 Monthly Cash Inflow
Sales Projection
1 Double Storey Shop/Office 39.03% 22,614,900.00
2 Double Storey Terrace 56.18% 32,551,750.00
3 Double Storey Low Cost 4.79% 2,775,465.00
Monthly Total 100.00% 57,942,115.00
% of Cumulative Sales
Construction Work Programme Months
1 Earthworks + Foundation 3 100.00%
2 R.C. Framework 9 100.00%
3 Walls, Doors & Windows Frame 7 100.00%
4 Roofing, Elec Wiring & Plumbing 7 100.00%
5 Internal & External Plastering 8 100.00%
6 Sewerage Works 5 100.00%
7 Drainage Works 6 100.00%
8 Roadworks + Infrastructure Works 8 100.00%
Sales Proceeds
1 Signing of S&P Agreement 10.00% 5,794,211.50
2 Earthwork + Foundation 10.00% 5,794,211.50
3 R.C. Framework 15.00% 8,691,317.25
4 Walls, Doors & Window Frame 10.00% 5,794,211.50
5 Roofing, Elec Wiring & Plumbing 10.00% 5,794,211.50
6 Internal & External Plastering 10.00% 5,794,211.50
7 Sewerage Works 5.00% 2,897,105.75
8 Drainage Works 2.50% 1,448,552.88
9 Roadworks + Infrastructure Works 2.50% 1,448,552.88
10 On the date the Purchaser takes VP of the said 17.50% 10,139,870.13
Property with the water and electricity supply
ready for connection
11 On the date the Purchaser takes VP of the 2.50% 1,448,552.88
said Property in item 10 where the Developer
has delivered to the Purchaser or the Purchaser's
Solicitor the original issue document of title to the
said Building Lot registered in the name of the
Purchaser
12 On the date the Purchaser takes VP of the said 5.00% 2,897,105.75
Property as in item 10 and to be held by the
Developer's solicitor as stakeholder for payment
to the Developer (2.5% at the expiry of the period
8 months; 2.5% at expiry of the period 24 months)
Monthly Total Cash Flow 100.00% 57,942,115.00
Monthly Cumulative Cash Inflow 57,942,115.00
Quaterly Total Cash Inflow 57,942,115.00
Quaterly Cumulative Cash Inflow
Assumptions:
- % of sale proceeds based on S&P agreement (Clause 5) third schedule
- The earthwork and foundation are paid simultaneously.
- The roadworks and infrastructure works are paid simultaneously.
- Item 2 - 9 are paid within 30 days after the receipt by the Purchaser of the Developer's written notice of the completion of such items.
Amount
(RM)
Sales
Precentage
DescriptionItem
M13 M14 M15 M16 M17 M18 M19 M20 M21 M22 M23 M24
10.0% 20.0% 30.0%
20.0%
50.0%
0.00% 0.00% 17.53% 0.00% 0.00% 7.81% 0.00% 0.00% 11.71% 0.00% 0.00% 0.00%
62.95% 62.95% 80.48% 80.48% 80.48% 88.29% 88.29% 88.29% 100.00% 100.00% 100.00% 100.00%
17.53% 7.81% 11.71%
17.53% 7.81% 11.71%
13.40% 17.53% 7.81% 11.71%
10.01% 10.01% 27.55% 7.81% 11.71%
8.04% 8.04% 12.42% 12.42% 12.42% 20.23% 11.71%
17.66% 17.66% 21.56% 21.56% 21.56%
13.41% 14.98% 14.98% 14.98% 20.83% 20.83%
10.06% 10.06% 11.36% 11.36% 11.36% 22.90% 11.45% 11.45%
17.53% 7.81% 11.71%
1,015,957.25 452,298.00 678,447.00
9.52% 17.53% 7.81% 11.71%
551,666.50 1,015,957.25 452,298.00 678,447.00
9.52% 17.53% 7.81% 11.71%
827,499.75 1,523,935.88 678,447.00 1,017,670.50
13.40% 13.40% 0.00% 17.53% 7.81% 11.71%
776,151.20 776,151.20 1,015,957.25 452,298.00 678,447.00
10.01% 10.01% 10.01% 27.55% 7.81% 11.71%
580,179.88 580,179.88 580,179.88 1,596,137.13 452,298.00 678,447.00
8.04% 8.04% 8.04% 12.42% 12.42% 12.42% 20.23% 0.00% 0.00% 11.71%
465,789.84 465,789.84 465,789.84 719,779.16 719,779.16 719,779.16 1,172,077.16 678,447.00
17.66% 17.66% 21.56% 21.56% 21.56%
511,576.45 511,576.45 624,650.95 624,650.95 624,650.95
13.41% 14.98% 14.98% 14.98% 20.83% 20.83% 0.00%
194,311.10 216,926.00 216,926.00 216,926.00 301,731.88 301,731.88
10.06% 10.06% 11.36% 11.36% 11.36% 22.90% 11.45%
145,733.33 145,733.33 164,579.08 164,579.08 164,579.08 331,674.49 165,837.25
100.00%
10,139,870.13
100.00%
1,448,552.88
3,201,287.17 1,822,120.92 2,061,926.97 5,871,766.66 719,779.16 1,366,388.26 3,424,344.16 728,502.45 1,406,949.45 4,657,841.33 926,382.83 12,378,911.20
18,397,237.01 20,219,357.93 22,281,284.90 28,153,051.55 28,872,830.71 30,239,218.97 33,663,563.13 34,392,065.58 35,799,015.04 40,456,856.37 41,383,239.20 53,762,150.39
7,085,335.06 7,957,934.07 5,559,796.07 17,963,135.35
22,281,284.90 30,239,218.97 35,799,015.04 53,762,150.39
Q2 Q3Q1
2014
Q4
3.0 Cash Flow based on ‘Sell-then-Build’ concept
3.1 Monthly Cash Inflow
Sales Projection
1 Double Storey Shop/Office 39.03% 22,614,900.00
2 Double Storey Terrace 56.18% 32,551,750.00
3 Double Storey Low Cost 4.79% 2,775,465.00
Monthly Total 100.00% 57,942,115.00
% of Cumulative Sales
Construction Work Programme Months
1 Earthworks + Foundation 3 100.00%
2 R.C. Framework 9 100.00%
3 Walls, Doors & Windows Frame 7 100.00%
4 Roofing, Elec Wiring & Plumbing 7 100.00%
5 Internal & External Plastering 8 100.00%
6 Sewerage Works 5 100.00%
7 Drainage Works 6 100.00%
8 Roadworks + Infrastructure Works 8 100.00%
Sales Proceeds
1 Signing of S&P Agreement 10.00% 5,794,211.50
2 Earthwork + Foundation 10.00% 5,794,211.50
3 R.C. Framework 15.00% 8,691,317.25
4 Walls, Doors & Window Frame 10.00% 5,794,211.50
5 Roofing, Elec Wiring & Plumbing 10.00% 5,794,211.50
6 Internal & External Plastering 10.00% 5,794,211.50
7 Sewerage Works 5.00% 2,897,105.75
8 Drainage Works 2.50% 1,448,552.88
9 Roadworks + Infrastructure Works 2.50% 1,448,552.88
10 On the date the Purchaser takes VP of the said 17.50% 10,139,870.13
Property with the water and electricity supply
ready for connection
11 On the date the Purchaser takes VP of the 2.50% 1,448,552.88
said Property in item 10 where the Developer
has delivered to the Purchaser or the Purchaser's
Solicitor the original issue document of title to the
said Building Lot registered in the name of the
Purchaser
12 On the date the Purchaser takes VP of the said 5.00% 2,897,105.75
Property as in item 10 and to be held by the
Developer's solicitor as stakeholder for payment
to the Developer (2.5% at the expiry of the period
8 months; 2.5% at expiry of the period 24 months)
Monthly Total Cash Flow 100.00% 57,942,115.00
Monthly Cumulative Cash Inflow 57,942,115.00
Quaterly Total Cash Inflow 57,942,115.00
Quaterly Cumulative Cash Inflow
Assumptions:
- % of sale proceeds based on S&P agreement (Clause 5) third schedule
- The earthwork and foundation are paid simultaneously.
- The roadworks and infrastructure works are paid simultaneously.
- Item 2 - 9 are paid within 30 days after the receipt by the Purchaser of the Developer's written notice of the completion of such items.
Amount
(RM)
Sales
Precentage
DescriptionItem
M25 M26 M27 M28 M29 M30 M31 M32 M33 M34 M35 M36
0.00% 0.00% 0.00% 0.00% 0.00% 0.00% 0.00% 0.00% 0.00% 0.00% 0.00% 0.00%
100.00% 100.00% 100.00% 100.00% 100.00% 100.00% 100.00% 100.00% 100.00% 100.00% 100.00% 100.00%
0.00%
0.00% 0.00% 0.00%
11.45%
165,837.25
50.00%
1,448,552.88
165,837.25 - - - - - - 1,448,552.88 - - - -
53,927,987.64 53,927,987.64 53,927,987.64 53,927,987.64 53,927,987.64 53,927,987.64 53,927,987.64 55,376,540.51 55,376,540.51 55,376,540.51 55,376,540.51 55,376,540.51
165,837.25 - 1,448,552.88 -
53,927,987.64 53,927,987.64 55,376,540.51 55,376,540.51
2015
Q1 Q3Q2 Q4
3.0 Cash Flow based on ‘Sell-then-Build’ concept
3.1 Monthly Cash Inflow
Sales Projection
1 Double Storey Shop/Office 39.03% 22,614,900.00
2 Double Storey Terrace 56.18% 32,551,750.00
3 Double Storey Low Cost 4.79% 2,775,465.00
Monthly Total 100.00% 57,942,115.00
% of Cumulative Sales
Construction Work Programme Months
1 Earthworks + Foundation 3 100.00%
2 R.C. Framework 9 100.00%
3 Walls, Doors & Windows Frame 7 100.00%
4 Roofing, Elec Wiring & Plumbing 7 100.00%
5 Internal & External Plastering 8 100.00%
6 Sewerage Works 5 100.00%
7 Drainage Works 6 100.00%
8 Roadworks + Infrastructure Works 8 100.00%
Sales Proceeds
1 Signing of S&P Agreement 10.00% 5,794,211.50
2 Earthwork + Foundation 10.00% 5,794,211.50
3 R.C. Framework 15.00% 8,691,317.25
4 Walls, Doors & Window Frame 10.00% 5,794,211.50
5 Roofing, Elec Wiring & Plumbing 10.00% 5,794,211.50
6 Internal & External Plastering 10.00% 5,794,211.50
7 Sewerage Works 5.00% 2,897,105.75
8 Drainage Works 2.50% 1,448,552.88
9 Roadworks + Infrastructure Works 2.50% 1,448,552.88
10 On the date the Purchaser takes VP of the said 17.50% 10,139,870.13
Property with the water and electricity supply
ready for connection
11 On the date the Purchaser takes VP of the 2.50% 1,448,552.88
said Property in item 10 where the Developer
has delivered to the Purchaser or the Purchaser's
Solicitor the original issue document of title to the
said Building Lot registered in the name of the
Purchaser
12 On the date the Purchaser takes VP of the said 5.00% 2,897,105.75
Property as in item 10 and to be held by the
Developer's solicitor as stakeholder for payment
to the Developer (2.5% at the expiry of the period
8 months; 2.5% at expiry of the period 24 months)
Monthly Total Cash Flow 100.00% 57,942,115.00
Monthly Cumulative Cash Inflow 57,942,115.00
Quaterly Total Cash Inflow 57,942,115.00
Quaterly Cumulative Cash Inflow
Assumptions:
- % of sale proceeds based on S&P agreement (Clause 5) third schedule
- The earthwork and foundation are paid simultaneously.
- The roadworks and infrastructure works are paid simultaneously.
- Item 2 - 9 are paid within 30 days after the receipt by the Purchaser of the Developer's written notice of the completion of such items.
Amount
(RM)
Sales
Precentage
DescriptionItem
M37 M38 M39 M40 M41 M42 M43 M44 M45 M46 M47 M48
0.00% 0.00% 0.00% 0.00% 0.00% 0.00% 0.00% 0.00% 0.00% 0.00% 0.00% 0.00%
100.00% 100.00% 100.00% 100.00% 100.00% 100.00% 100.00% 100.00% 100.00% 100.00% 100.00% 100.00%
50.00%
1,448,552.88
- - - - - - - - - - - 1,448,552.88
55,376,540.51 55,376,540.51 55,376,540.51 55,376,540.51 55,376,540.51 55,376,540.51 55,376,540.51 55,376,540.51 55,376,540.51 55,376,540.51 55,376,540.51 56,825,093.39
- - - 1,448,552.88
55,376,540.51 55,376,540.51 55,376,540.51 56,825,093.39
2016
Q3 Q4Q2Q1
3.0 Cash Flow based on ‘Sell-then-Build’ concept
3.2 Monthly Cash Outflow
M1 M2 M3 M4 M5 M6 M7 M8 M9 M10 M11 M12
Construction Costs
1 Earthwork + Foundation 4 10.00% 2,054,130.00 1,027,065.00 513,532.50 513,532.50
2 R.C. Framework 9 25.00% 5,135,325.00 570,591.67 570,591.67 570,591.67 570,591.67 570,591.67 570,591.67 570,591.67 570,591.67 570,591.67
3 Walls, Doors, & Windows Frame 7 15.00% 3,081,195.00 440,170.71 440,170.71 440,170.71 440,170.71 440,170.71
4 Roofing, Elec. Wiring & Plumbing 7 15.00% 3,081,195.00 440,170.71 440,170.71 440,170.71
5 Internal & External Plastering 8 15.00% 3,081,195.00 385,149.38
6 Sewerage Works 5 5.00% 1,027,065.00
7 Drainage Works 6 5.00% 1,027,065.00
8 Roadworks + Infrastructure Works 8 10.00% 2,054,130.00
Total Construction Cost 100.00% 20,541,300.00
Monthly Total Cash Outflow (Before Retention) 1,027,065.00 513,532.50 1,084,124.17 570,591.67 570,591.67 570,591.67 1,010,762.38 1,010,762.38 1,450,933.10 1,450,933.10 1,836,082.47
Monthly Cumulative Outflow (Before Retention) 1,027,065.00 1,540,597.50 2,624,721.67 3,195,313.33 3,765,905.00 4,336,496.67 5,347,259.05 6,358,021.43 7,808,954.52 9,259,887.62 11,095,970.09
Less Retention (10%, Limit 5%) 1,027,065.00 (102,706.50) (154,059.75) (262,472.17) (319,531.33) (376,590.50) (433,649.67) (534,725.90) (635,802.14) (780,895.45) (925,988.76) (1,027,065.00)
Monthly Cumulative Outflow (After Retention) 924,358.50 1,386,537.75 2,362,249.50 2,875,782.00 3,389,314.50 3,902,847.00 4,812,533.14 5,722,219.29 7,028,059.07 8,333,898.86 10,068,905.09
Monthly Total Cash Outflow (After Retention) 924,358.50 462,179.25 975,711.75 513,532.50 513,532.50 513,532.50 909,686.14 909,686.14 1,305,839.79 1,305,839.79 1,735,006.23
Quarterly Total Cash Outflow 1,386,537.75 2,002,776.75 2,332,904.79 4,346,685.80
Quarterly Cumulative Cash Outflow 1,386,537.75 3,389,314.50 5,722,219.29 10,068,905.09
MonthsItem Description Q4Q2 Q3Q1
2013
Amount (RM)Percentage
3.0 Cash Flow based on ‘Sell-then-Build’ concept
3.2 Monthly Cash Outflow
Construction Costs
1 Earthwork + Foundation 4 10.00% 2,054,130.00
2 R.C. Framework 9 25.00% 5,135,325.00
3 Walls, Doors, & Windows Frame 7 15.00% 3,081,195.00
4 Roofing, Elec. Wiring & Plumbing 7 15.00% 3,081,195.00
5 Internal & External Plastering 8 15.00% 3,081,195.00
6 Sewerage Works 5 5.00% 1,027,065.00
7 Drainage Works 6 5.00% 1,027,065.00
8 Roadworks + Infrastructure Works 8 10.00% 2,054,130.00
Total Construction Cost 100.00% 20,541,300.00
Monthly Total Cash Outflow (Before Retention)
Monthly Cumulative Outflow (Before Retention)
Less Retention (10%, Limit 5%) 1,027,065.00
Monthly Cumulative Outflow (After Retention)
Monthly Total Cash Outflow (After Retention)
Quarterly Total Cash Outflow
Quarterly Cumulative Cash Outflow
MonthsItem Description Amount (RM)Percentage
M13 M14 M15 M16 M17 M18 M19 M20 M21 M22 M23 M24
440,170.71 440,170.71
440,170.71 440,170.71 440,170.71 440,170.71
385,149.38 385,149.38 385,149.38 385,149.38 385,149.38 385,149.38 385,149.38
205,413.00 205,413.00 205,413.00 205,413.00 205,413.00
171,177.50 171,177.50 171,177.50 171,177.50 171,177.50 171,177.50
256,766.25 256,766.25 256,766.25 256,766.25 256,766.25 256,766.25 256,766.25
1,265,490.80 1,265,490.80 825,320.09 825,320.09 641,915.63 813,093.13 813,093.13 633,356.75 633,356.75 633,356.75 376,590.50 462,179.25
12,361,460.89 13,626,951.70 14,452,271.79 15,277,591.88 15,919,507.50 16,732,600.63 17,545,693.75 18,179,050.50 18,812,407.25 19,445,764.00 19,822,354.50 20,284,533.75
(1,027,065.00) (1,027,065.00) (1,027,065.00) (1,027,065.00) (1,027,065.00) (1,027,065.00) (1,027,065.00) (1,027,065.00) (1,027,065.00) (1,027,065.00) (1,027,065.00) (1,027,065.00)
11,334,395.89 12,599,886.70 13,425,206.79 14,250,526.88 14,892,442.50 15,705,535.63 16,518,628.75 17,151,985.50 17,785,342.25 18,418,699.00 18,795,289.50 19,257,468.75
1,265,490.80 1,265,490.80 825,320.09 825,320.09 641,915.63 813,093.13 813,093.13 633,356.75 633,356.75 633,356.75 376,590.50 462,179.25
3,356,301.70 2,280,328.84 2,079,806.63 1,472,126.50
13,425,206.79 15,705,535.63 17,785,342.25 19,257,468.75
Q3 Q4
2014
Q1 Q2
3.0 Cash Flow based on ‘Sell-then-Build’ concept
3.2 Monthly Cash Outflow
Construction Costs
1 Earthwork + Foundation 4 10.00% 2,054,130.00
2 R.C. Framework 9 25.00% 5,135,325.00
3 Walls, Doors, & Windows Frame 7 15.00% 3,081,195.00
4 Roofing, Elec. Wiring & Plumbing 7 15.00% 3,081,195.00
5 Internal & External Plastering 8 15.00% 3,081,195.00
6 Sewerage Works 5 5.00% 1,027,065.00
7 Drainage Works 6 5.00% 1,027,065.00
8 Roadworks + Infrastructure Works 8 10.00% 2,054,130.00
Total Construction Cost 100.00% 20,541,300.00
Monthly Total Cash Outflow (Before Retention)
Monthly Cumulative Outflow (Before Retention)
Less Retention (10%, Limit 5%) 1,027,065.00
Monthly Cumulative Outflow (After Retention)
Monthly Total Cash Outflow (After Retention)
Quarterly Total Cash Outflow
Quarterly Cumulative Cash Outflow
MonthsItem Description Amount (RM)Percentage
M25 M26 M27 M28 M29 M30 M31 M32 M33 M34 M35 M36
First Moeity
256,766.25
256,766.25 0.00 0.00 0.00 0.00 0.00 0.00 0.00 0.00 0.00 0.00 0.00
20,541,300.00 20,541,300.00 20,541,300.00 20,541,300.00 20,541,300.00 20,541,300.00 20,541,300.00 20,541,300.00 20,541,300.00 20,541,300.00 20,541,300.00 20,541,300.00
(513,532.50) (513,532.50) (513,532.50) (513,532.50) (513,532.50) (513,532.50) (513,532.50) (513,532.50) (513,532.50) (513,532.50) (513,532.50) (513,532.50)
20,027,767.50 20,027,767.50 20,027,767.50 20,027,767.50 20,027,767.50 20,027,767.50 20,027,767.50 20,027,767.50 20,027,767.50 20,027,767.50 20,027,767.50 20,027,767.50
770,298.75 0.00 0.00 0.00 0.00 0.00 0.00 0.00 0.00 0.00 0.00 0.00
770,298.75
20,027,767.50
2015
Q2Q1 Q4Q3
3.0 Cash Flow based on ‘Sell-then-Build’ concept
3.2 Monthly Cash Outflow
Construction Costs
1 Earthwork + Foundation 4 10.00% 2,054,130.00
2 R.C. Framework 9 25.00% 5,135,325.00
3 Walls, Doors, & Windows Frame 7 15.00% 3,081,195.00
4 Roofing, Elec. Wiring & Plumbing 7 15.00% 3,081,195.00
5 Internal & External Plastering 8 15.00% 3,081,195.00
6 Sewerage Works 5 5.00% 1,027,065.00
7 Drainage Works 6 5.00% 1,027,065.00
8 Roadworks + Infrastructure Works 8 10.00% 2,054,130.00
Total Construction Cost 100.00% 20,541,300.00
Monthly Total Cash Outflow (Before Retention)
Monthly Cumulative Outflow (Before Retention)
Less Retention (10%, Limit 5%) 1,027,065.00
Monthly Cumulative Outflow (After Retention)
Monthly Total Cash Outflow (After Retention)
Quarterly Total Cash Outflow
Quarterly Cumulative Cash Outflow
MonthsItem Description Amount (RM)Percentage
M37 M38 M39 M40 M41 M42 M43 M44 M45 M46 M47 M48
Second Moeity
0.00 0.00 0.00 0.00 0.00 0.00
20,541,300.00 20,541,300.00 20,541,300.00 20,541,300.00 20,541,300.00 20,541,300.00
(513,532.50) (513,532.50) (513,532.50) (513,532.50) (513,532.50) 0.00
20,027,767.50 20,027,767.50 20,027,767.50 20,027,767.50 20,027,767.50 20,541,300.00
0.00 0.00 0.00 0.00 0.00 513,532.50
513,532.50
20,541,300.00
Q3Q2
2016
Q4Q1
3.0 Cash Flow based on ‘Sell-then-Build’ concept
3.3 Quarter-Yearly Cash Flow
Q1 Q2 Q3 Q4 Q1 Q2 Q3 Q4
A CASH INFLOW
1 Bank Loan of Land Purchase 6,500,000.00 6,500,000.00
2 Sales Projection 56,825,093.39
Total Cash Inflow 63,325,093.39 6,500,000.00 0.00 0.00 0.00 0.00 0.00 0.00 0.00
Cummulative Cash Inflow 6,500,000.00 6,500,000.00 6,500,000.00 6,500,000.00 6,500,000.00 6,500,000.00 6,500,000.00 6,500,000.00
B CASH OUTFLOW
1 Land Cost 6,738,187.50 6,738,187.50
2 Construction Cost 20,541,300.00
3 Repayment of Land Loan 6,500,000.00
Administrative Cost
4 Professional Fees 1,848,717.00
5 Administrative Fees 1,158,842.30
6 Plan Fees 328,000.00
7 Contributions & Fees 410,826.00
8 Advertising & Marketing 579,421.15
9 Conversion Premium :-
i) Commercial 162,000.00
ii) Residential 483,131.25
10 Subdivision 246,000.00
11 Legal Fees 410,000.00
12 Contingencies 1,027,065.00
Finance Cost
13 Bridging Finance 616,239.00
14 Financing Cost for Land 3,501,055.71 141,558.18 144,641.06 147,791.07 151,009.69 154,298.41 157,658.75 161,092.27 164,600.57
Total Cash Outflow 44,550,784.91 6,879,745.68 144,641.06 147,791.07 151,009.69 154,298.41 157,658.75 161,092.27 164,600.57
Cummulative Cash Outflow 6,879,745.68 7,024,386.73 7,172,177.81 7,323,187.50 7,477,485.91 7,635,144.66 7,796,236.93 7,960,837.50
Net Cash Flow 18,774,308.48 (379,745.68) (144,641.06) (147,791.07) (151,009.69) (154,298.41) (157,658.75) (161,092.27) (164,600.57)
Cummulative Cash Flow (144,641.06) (292,432.13) (443,441.82) (597,740.24) (755,398.99) (916,491.26) (1,081,091.82)
DescriptionItem
Amount
(RM)
20112010
3.0 Cash Flow based on ‘Sell-then-Build’ concept
3.3 Quarter-Yearly Cash Flow
A CASH INFLOW
1 Bank Loan of Land Purchase 6,500,000.00
2 Sales Projection 56,825,093.39
Total Cash Inflow 63,325,093.39
Cummulative Cash Inflow
B CASH OUTFLOW
1 Land Cost 6,738,187.50
2 Construction Cost 20,541,300.00
3 Repayment of Land Loan 6,500,000.00
Administrative Cost
4 Professional Fees 1,848,717.00
5 Administrative Fees 1,158,842.30
6 Plan Fees 328,000.00
7 Contributions & Fees 410,826.00
8 Advertising & Marketing 579,421.15
9 Conversion Premium :-
i) Commercial 162,000.00
ii) Residential 483,131.25
10 Subdivision 246,000.00
11 Legal Fees 410,000.00
12 Contingencies 1,027,065.00
Finance Cost
13 Bridging Finance 616,239.00
14 Financing Cost for Land 3,501,055.71
Total Cash Outflow 44,550,784.91
Cummulative Cash Outflow
Net Cash Flow 18,774,308.48
Cummulative Cash Flow
DescriptionItem
Amount
(RM) Q1 Q2 Q3 Q4 Q1 Q2 Q3 Q4
2,004,502.50 1,879,435.25 3,746,633.00 7,565,379.09
0.00 0.00 0.00 0.00 2,004,502.50 1,879,435.25 3,746,633.00 7,565,379.09
6,500,000.00 6,500,000.00 6,500,000.00 6,500,000.00 8,504,502.50 10,383,937.75 14,130,570.75 21,695,949.84
1,386,537.75 2,002,776.75 2,332,904.79 4,346,685.80
1,109,230.20 369,743.40
144,855.29 144,855.29 144,855.29 144,855.29
328,000.00
410,826.00
72,427.64 72,427.64 72,427.64 72,427.64
162,000.00
483,131.25
246,000.00
410,000.00
128,383.13 128,383.13 128,383.13 128,383.13
77,029.88 77,029.88 77,029.88 77,029.88
168,185.27 171,848.04 175,590.58 179,414.62 183,321.94 187,314.36 191,393.73 195,561.93
168,185.27 171,848.04 175,590.58 179,414.62 5,141,743.07 2,612,787.04 2,946,994.44 5,334,687.07
8,129,022.77 8,300,870.81 8,476,461.38 8,655,876.00 13,797,619.07 16,410,406.12 19,357,400.56 24,692,087.63
(168,185.27) (171,848.04) (175,590.58) (179,414.62) (3,137,240.57) (733,351.79) 799,638.56 2,230,692.02
(1,249,277.09) (1,421,125.13) (1,596,715.71) (1,776,130.32) (4,913,370.90) (5,646,722.69) (4,847,084.13) (2,616,392.11)
20132012
3.0 Cash Flow based on ‘Sell-then-Build’ concept
3.3 Quarter-Yearly Cash Flow
A CASH INFLOW
1 Bank Loan of Land Purchase 6,500,000.00
2 Sales Projection 56,825,093.39
Total Cash Inflow 63,325,093.39
Cummulative Cash Inflow
B CASH OUTFLOW
1 Land Cost 6,738,187.50
2 Construction Cost 20,541,300.00
3 Repayment of Land Loan 6,500,000.00
Administrative Cost
4 Professional Fees 1,848,717.00
5 Administrative Fees 1,158,842.30
6 Plan Fees 328,000.00
7 Contributions & Fees 410,826.00
8 Advertising & Marketing 579,421.15
9 Conversion Premium :-
i) Commercial 162,000.00
ii) Residential 483,131.25
10 Subdivision 246,000.00
11 Legal Fees 410,000.00
12 Contingencies 1,027,065.00
Finance Cost
13 Bridging Finance 616,239.00
14 Financing Cost for Land 3,501,055.71
Total Cash Outflow 44,550,784.91
Cummulative Cash Outflow
Net Cash Flow 18,774,308.48
Cummulative Cash Flow
DescriptionItem
Amount
(RM) Q1 Q2 Q3 Q4 Q1 Q2 Q3 Q4
7,085,335.06 7,957,934.07 5,559,796.07 17,963,135.35 165,837.25 0.00 1,448,552.88 0.00
7,085,335.06 7,957,934.07 5,559,796.07 17,963,135.35 165,837.25 0.00 1,448,552.88 0.00
28,781,284.90 36,739,218.97 42,299,015.04 60,262,150.39 60,427,987.64 60,427,987.64 61,876,540.51 61,876,540.51
3,356,301.70 2,280,328.84 2,079,806.63 1,472,126.50 770,298.75
6,500,000.00
369,743.40
144,855.29 144,855.29 144,855.29 144,855.29
72,427.64 72,427.64 72,427.64 72,427.64
128,383.13 128,383.13 128,383.13 128,383.13
77,029.88 77,029.88 77,029.88 77,029.88
199,820.92 204,172.65 208,619.16 213,162.51
3,978,818.55 2,907,197.42 2,711,121.72 8,977,728.34 770,298.75 0.00 0.00 0.00
28,670,906.17 31,578,103.60 34,289,225.32 43,266,953.66 44,037,252.41 44,037,252.41 44,037,252.41 44,037,252.41
3,106,516.51 5,050,736.65 2,848,674.35 8,985,407.01 (604,461.50) 0.00 1,448,552.88 0.00
490,124.40 5,540,861.05 8,389,535.40 17,374,942.41 16,770,480.91 16,770,480.91 18,219,033.78 18,219,033.78
20152014
3.0 Cash Flow based on ‘Sell-then-Build’ concept
3.3 Quarter-Yearly Cash Flow
A CASH INFLOW
1 Bank Loan of Land Purchase 6,500,000.00
2 Sales Projection 56,825,093.39
Total Cash Inflow 63,325,093.39
Cummulative Cash Inflow
B CASH OUTFLOW
1 Land Cost 6,738,187.50
2 Construction Cost 20,541,300.00
3 Repayment of Land Loan 6,500,000.00
Administrative Cost
4 Professional Fees 1,848,717.00
5 Administrative Fees 1,158,842.30
6 Plan Fees 328,000.00
7 Contributions & Fees 410,826.00
8 Advertising & Marketing 579,421.15
9 Conversion Premium :-
i) Commercial 162,000.00
ii) Residential 483,131.25
10 Subdivision 246,000.00
11 Legal Fees 410,000.00
12 Contingencies 1,027,065.00
Finance Cost
13 Bridging Finance 616,239.00
14 Financing Cost for Land 3,501,055.71
Total Cash Outflow 44,550,784.91
Cummulative Cash Outflow
Net Cash Flow 18,774,308.48
Cummulative Cash Flow
DescriptionItem
Amount
(RM) Q1 Q2 Q3 Q4
0.00 0.00 0.00 1,448,552.88
0.00 0.00 0.00 1,448,552.88
61,876,540.51 61,876,540.51 61,876,540.51 63,325,093.39
513,532.50
0.00 513,532.50 0.00 0.00
44,037,252.41 44,550,784.91 44,550,784.91 44,550,784.91
0.00 (513,532.50) 0.00 1,448,552.88
18,219,033.78 17,705,501.28 17,705,501.28 19,154,054.16
2016
4.0 NPV
PV Factor
12% per annum
Q1 6,500,000.00 (6,879,745.68) (379,745.68) 0.9721 (369,150.77)
Q2 0.00 (144,641.06) (144,641.06) 0.9449 (136,671.33)
Q3 0.00 (147,791.07) (147,791.07) 0.9185 (135,746.10)
Q4 0.00 (151,009.69) (151,009.69) 0.8929 (134,836.56)
Q1 0.00 (154,298.41) (154,298.41) 0.8679 (133,915.59)
Q2 0.00 (157,658.75) (157,658.75) 0.8437 (133,016.69)
Q3 0.00 (161,092.27) (161,092.27) 0.8201 (132,111.77)
Q4 0.00 (164,600.57) (164,600.57) 0.7972 (131,219.57)
Q1 0.00 (168,185.27) (168,185.27) 0.7749 (130,326.76)
Q2 0.00 (171,848.04) (171,848.04) 0.7533 (129,453.13)
Q3 0.00 (175,590.58) (175,590.58) 0.7322 (128,567.42)
Q4 0.00 (179,414.62) (179,414.62) 0.7118 (127,707.33)
Q1 2,004,502.50 (5,141,743.07) (3,137,240.57) 0.6919 (2,170,656.75)
Q2 1,879,435.25 (2,612,787.04) (733,351.79) 0.6726 (493,252.42)
Q3 3,746,633.00 (2,946,994.44) 799,638.56 0.6538 522,803.69
Q4 7,565,379.09 (5,334,687.07) 2,230,692.02 0.6355 1,417,604.78
Q1 7,085,335.06 (3,978,818.55) 3,106,516.51 0.6178 1,919,205.90
Q2 7,957,934.07 (2,907,197.42) 5,050,736.65 0.6005 3,032,967.36
Q3 5,559,796.07 (2,711,121.72) 2,848,674.35 0.5837 1,662,771.22
Q4 17,963,135.35 (8,977,728.34) 8,985,407.01 0.5674 5,098,319.94
Q1 165,837.25 (770,298.75) (604,461.50) 0.5516 (333,420.97)
Q2 0.00 0.00 0.00 0.5362 0.00
Q3 1,448,552.88 0.00 1,448,552.88 0.5212 754,985.76
Q4 0.00 0.00 0.00 0.5066 0.00
Q1 0.00 0.00 0.00 0.4925 0.00
Q2 0.00 (513,532.50) (513,532.50) 0.4787 (245,828.01)
Q3 0.00 0.00 0.00 0.4653 0.00
Q4 1,448,552.88 0.00 1,448,552.88 0.4523 655,180.47
63,325,093.39 (44,550,784.91) 18,774,308.48 9,997,957.95
2016
Total Cash Flow
Quarter Cash Outflow (RM) Net Cash Flow (RM)
2013
2012
2015
2014
NPV (RM)Cash In Flow (RM)Year
2011
2010
4.1 Comment on the viability of the project
The NPV of this particular project was calculated as RM 9,997,957.95, which
is a positive value. This shows that there is a better return in the future with the
investor paying less than what the development is worth. Hence, the project is
considered viable.
21
5.0 Cash Flow based on a ‘Build-then-Sell’ Concept
The Build Then Sell (BTS) concept is a new concept introduced by the
Government in the year 2007 where housing developers have to complete a housing
project before selling houses to buyers. This is different from the current
conventional concept of Sell then Build (STB). Although developers are encouraged
to adopt the BTS concept, they have the option to continue with the conventional
STB method. But what are the differences do they have on cash flow between these
2 different concepts?
Only big players in the development industry can afford to use a BTS concept
due to the significant amount of capital required to build the entire project without
any financial aid from the consumers. Therefore, BTS cannot be applied to large
scaled project to lower the risk of abandonment of project in case it does not sell.
It will require huge shareholders’ funds and capital commitment if a housing
developer is unable to secure bank borrowings and banks will be reluctant to finance
a project under a BTS concept due to the nature of the risks involved. Previously
unknown developers will stand little chance of securing any project financing. Due
to the higher initial cost of funding by the employer, the BTS concept will eventually
shoot up the selling price of properties which is a con for house buyers.
The pros of having a BTS concept to a development cash flow is the
reduction of variation works which is a better cash flow system, this is due to all
units are still completely own by the developer and under their specifications.
Unoike STB system, at some point some owners will want to change materials being
used in their unit to their own specifications which will then increase the amount of
variation works and cash outflow to order specific materials for the owner.
22
The BTS concept has very low cash inflow from beginning until the
construction stage as compared to the STB. But the advantage of BTS is the price of
the development will always be higher after completion rather than sold before
construction due to the risk consumers does not have to bare and actually have a
physical approach to the finished product. This gives the BTS concept to have a
higher cash inflow as compared to STB but only can receive its inflow after the
construction stage which is a huge risk the developers have to take.
23
Reference
Online, T. S. (2015, October 18). Build then sell. Retrieved November 16, 2018,
from https://www.thestar.com.my/news/nation/2007/04/14/build-then-sell/
Posted on April 5, 2013 | 3803 views | Topic : Featured, Property News. (n.d.).
Fine-tuning the "build-then-sell" concept. Retrieved November 16, 2018, from
http://www.starproperty.my/index.php/articles/property-news/fine-tuning-buil
d-then-sell-concept/
Property development not ready for build-then-sell concept. (n.d.). Retrieved
November 16, 2018, from
https://www.edgeprop.my/content/property-development-not-ready-build-then
-sell-concept
Tong, D. A. (2015, October 12). Taking a closer look at the build-then-sell
concept. Retrieved November 16, 2018, from
https://www.thestar.com.my/business/business-news/2012/02/11/taking-a-clos
er-look-at-the-buildthensell-concept/
What has happened to 'Build Then Sell' concept, asks HBA. (2016, October 21).
Retrieved November 16, 2018, from
https://www.freemalaysiatoday.com/category/nation/2016/10/21/what-has-hap
pened-to-build-then-sell-concept-asks-hba/
24
Appendix
DEVELOPMENT ECONOMICS
ASSIGNMENT
MEETING 1
DATE : 24 October 2018 (Wednesday)
TIME : 3.00pm – 4.00pm
LOCATION : D8.06
ATTENDEES : 1. PANG KAI YUN
2. EVON WEE YEE JING
3. LEE ZHI XIN
4. LIM KAR YAN
5. SAM WEI YIN
6. SANDRABROOKE GOH
7. TERENCE TAN PENG ONG
8. WONG DE-VIN
DISCUSSION :
1. Pang Kai Yun is selected as the group leader.
2. Job is assigned equally among the group members as shown below:
Task Name Deadline
Question 1 LIM KAR YAN 31 October 2018 (Wednesday)
Question 2 SAM WEI YIN
SANDRABROOKE GOH
PANG KAI YUN
2 November 2018 (Friday)
Question 3 EVON WEE YEE JING
LEE ZHI XIN
TERENCE TAN PENG ONG
WONG DE-VIN
9 November 2018 (Friday)
Question 4 LIM KAR YAN 14 November 2018
(Wednesday)
Question 5 - 16 November 2018 (Friday)
3. Question 4 will start after Question 3 is done.
4. Question 5 will be assigned after Question 2 and 3 is done.
5. Next meeting will be held on 31 October 2018 (Wednesday). Time and location to be
confirmed.
DEVELOPMENT ECONOMICS
ASSIGNMENT
MEETING 2
DATE : 2 November 2018 (Tuesday)
TIME : 10.30am – 11.30am
LOCATION : C7.04
ATTENDEES : 1. PANG KAI YUN
2. EVON WEE YEE JING
3. LEE ZHI XIN
4. LIM KAR YAN
5. SAM WEI YIN
6. SANDRABROOKE GOH
7. TERENCE TAN PENG ONG
8. WONG DE-VIN
DISCUSSION :
1. Question 1 is completed by LIM KAR YAN.
2. Question 2 is completed by SAM WEI YIN and SANDRABROOKE GOH.
3. Question 3 is still on going.
4. Question 4 will start after Question 3 is done. The NPV table is done.
5. Question 5 will be done by PANG KAI YUN.
6. Next meeting will be held on 14 November 2018 (Wednesday). Time and location to
be confirmed.
DEVELOPMENT ECONOMICS
ASSIGNMENT
MEETING 3
DATE : 15 November 2018 (Thursday)
TIME : 11.00am – 11.30am
LOCATION : C7.02
ATTENDEES : 1. PANG KAI YUN
2. EVON WEE YEE JING
3. LEE ZHI XIN
4. LIM KAR YAN
5. SAM WEI YIN
6. SANDRABROOKE GOH
7. TERENCE TAN PENG ONG
8. WONG DE-VIN
DISCUSSION :
1. Question 5 will be done by WONG DE-VIN.
2. Revised on the job assigned as shown below:
Task Name Progress
Question 1 LIM KAR YAN Done
Question 2 SAM WEI YIN
SANDRABROOKE GOH
Done
Question 3:
i) Cash Inflow
ii) Cash Outflow
iii) Quarter-Yearly
LEE ZHI XIN
TERENCE TAN PENG ONG
EVON WEE YEE JING
On-going
Done
On-going
Question 4 LIM KAR YAN Table is done
Question 5 WONG DE-VIN On-going
Minutes of meeting,
checking & formatting
PANG KAI YUN On-going
3. List down all the question that want to clarify with Ms Tay and Pn Nurul.
DEVELOPMENT ECONOMICS
ASSIGNMENT
MEETING 4
DATE : 23 November 2018 (Friday)
TIME : 10.30am – 11.30am
LOCATION : C7.02
ATTENDEES : 1. PANG KAI YUN,
2. EVON WEE YEE JING
3. LEE ZHI XIN
4. LIM KAR YAN
5. SAM WEI YIN
6. SANDRABROOKE GOH
7. TERENCE TAN PENG ONG
8. WONG DE-VIN
DISCUSSION :
1. Check all the answer and format.
2. Progress of the assignment is shown as below:
Task Name Progress
Question 1 LIM KAR YAN Done
Question 2 SAM WEI YIN
SANDRABROOKE GOH
Done
Question 3:
i) Cash Inflow
ii) Cash Outflow
iii) Quarter-Yearly
LEE ZHI XIN
TERENCE TAN PENG ONG
EVON WEE YEE JING
Done
Done
Done
Question 4 LIM KAR YAN Done
Question 5 WONG DE-VIN Done
Minutes of meeting,
checking & formatting
PANG KAI YUN On-going

Mais conteúdo relacionado

Mais procurados

Eca presentation-compile
Eca presentation-compileEca presentation-compile
Eca presentation-compileTimun Loh
 
Lecture 8-determination-of-own-employment-by
Lecture 8-determination-of-own-employment-byLecture 8-determination-of-own-employment-by
Lecture 8-determination-of-own-employment-byseenyeeyong
 
Estimating calculation
Estimating calculationEstimating calculation
Estimating calculationZIyeeTan
 
Eca presentation
Eca presentationEca presentation
Eca presentationKailyn Lee
 
PP2 final account assignment calculations
PP2 final account assignment calculationsPP2 final account assignment calculations
PP2 final account assignment calculationsashleyyeap
 
Development Economics (Group Assignment) - Financial appraisal
Development Economics (Group Assignment) - Financial appraisalDevelopment Economics (Group Assignment) - Financial appraisal
Development Economics (Group Assignment) - Financial appraisalYee Len Wan
 
CL Final Report
CL Final ReportCL Final Report
CL Final ReportMelvin Lim
 
Scale of fees (rev. 2004)
Scale of fees (rev. 2004)Scale of fees (rev. 2004)
Scale of fees (rev. 2004)helmie84
 
The architect as contract administrator a legal perspective - presentation ...
The architect as contract administrator   a legal perspective - presentation ...The architect as contract administrator   a legal perspective - presentation ...
The architect as contract administrator a legal perspective - presentation ...Zainab Zainordin
 
Summer Internship Presentation on "CONSTRUCTION OF PERMANENT CAMPUS FOR INDIA...
Summer Internship Presentation on "CONSTRUCTION OF PERMANENT CAMPUS FOR INDIA...Summer Internship Presentation on "CONSTRUCTION OF PERMANENT CAMPUS FOR INDIA...
Summer Internship Presentation on "CONSTRUCTION OF PERMANENT CAMPUS FOR INDIA...Yogesh Gunasekaran
 
PP1 Project 3 Feasibility study
PP1 Project 3 Feasibility studyPP1 Project 3 Feasibility study
PP1 Project 3 Feasibility studyTeo Kean Hui
 
Apartment building construction project report
Apartment building construction project reportApartment building construction project report
Apartment building construction project reportHiska Chishi
 
Construction practices aphb
Construction practices aphbConstruction practices aphb
Construction practices aphbhlksd
 
Project Management - Recreation District in Taylor's University Subang Jaya
Project Management - Recreation District in Taylor's University Subang JayaProject Management - Recreation District in Taylor's University Subang Jaya
Project Management - Recreation District in Taylor's University Subang JayaJoe Onn Lim
 

Mais procurados (20)

Eca presentation-compile
Eca presentation-compileEca presentation-compile
Eca presentation-compile
 
Lecture 8-determination-of-own-employment-by
Lecture 8-determination-of-own-employment-byLecture 8-determination-of-own-employment-by
Lecture 8-determination-of-own-employment-by
 
Estimating calculation
Estimating calculationEstimating calculation
Estimating calculation
 
Defects liability
Defects liabilityDefects liability
Defects liability
 
Eca presentation
Eca presentationEca presentation
Eca presentation
 
PP2 final account assignment calculations
PP2 final account assignment calculationsPP2 final account assignment calculations
PP2 final account assignment calculations
 
Development Economics (Group Assignment) - Financial appraisal
Development Economics (Group Assignment) - Financial appraisalDevelopment Economics (Group Assignment) - Financial appraisal
Development Economics (Group Assignment) - Financial appraisal
 
RIBA plan of work
RIBA plan of workRIBA plan of work
RIBA plan of work
 
CL Final Report
CL Final ReportCL Final Report
CL Final Report
 
GBI: Role of BS
GBI: Role of BSGBI: Role of BS
GBI: Role of BS
 
pp2 Final account-1
pp2 Final account-1pp2 Final account-1
pp2 Final account-1
 
Scale of fees (rev. 2004)
Scale of fees (rev. 2004)Scale of fees (rev. 2004)
Scale of fees (rev. 2004)
 
The architect as contract administrator a legal perspective - presentation ...
The architect as contract administrator   a legal perspective - presentation ...The architect as contract administrator   a legal perspective - presentation ...
The architect as contract administrator a legal perspective - presentation ...
 
PP1 report
PP1 reportPP1 report
PP1 report
 
Summer Internship Presentation on "CONSTRUCTION OF PERMANENT CAMPUS FOR INDIA...
Summer Internship Presentation on "CONSTRUCTION OF PERMANENT CAMPUS FOR INDIA...Summer Internship Presentation on "CONSTRUCTION OF PERMANENT CAMPUS FOR INDIA...
Summer Internship Presentation on "CONSTRUCTION OF PERMANENT CAMPUS FOR INDIA...
 
PP1 Project 3 Feasibility study
PP1 Project 3 Feasibility studyPP1 Project 3 Feasibility study
PP1 Project 3 Feasibility study
 
Apartment building construction project report
Apartment building construction project reportApartment building construction project report
Apartment building construction project report
 
Construction practices aphb
Construction practices aphbConstruction practices aphb
Construction practices aphb
 
ECA presentation
ECA presentationECA presentation
ECA presentation
 
Project Management - Recreation District in Taylor's University Subang Jaya
Project Management - Recreation District in Taylor's University Subang JayaProject Management - Recreation District in Taylor's University Subang Jaya
Project Management - Recreation District in Taylor's University Subang Jaya
 

Semelhante a Assignment - Financial Appraisal

Project Management and Development Economics Project (DE)
Project Management and Development Economics Project (DE)Project Management and Development Economics Project (DE)
Project Management and Development Economics Project (DE)Pang Khai Shuen
 
The watergate confidential
The watergate confidentialThe watergate confidential
The watergate confidentialHaris Memon
 
Real Estate Development - Financial Model
Real Estate Development - Financial ModelReal Estate Development - Financial Model
Real Estate Development - Financial ModelImran Almaleh
 
KA6564 Assignment 3
KA6564 Assignment 3KA6564 Assignment 3
KA6564 Assignment 3armada7000
 
Final slideshow presentation (1)
Final slideshow presentation (1)Final slideshow presentation (1)
Final slideshow presentation (1)Aura Investments
 
Solutions Financial Accounting - Revenue Recognition
Solutions Financial Accounting - Revenue RecognitionSolutions Financial Accounting - Revenue Recognition
Solutions Financial Accounting - Revenue RecognitionFabiola Kristi
 
Fixed Capital Analysis PowerPoint Presentation Slides
Fixed Capital Analysis PowerPoint Presentation SlidesFixed Capital Analysis PowerPoint Presentation Slides
Fixed Capital Analysis PowerPoint Presentation SlidesSlideTeam
 
Viability Session 2: The role of viability in plan-making and development man...
Viability Session 2: The role of viability in plan-making and development man...Viability Session 2: The role of viability in plan-making and development man...
Viability Session 2: The role of viability in plan-making and development man...PAS_Team
 
Final presentation with excel
Final presentation with excelFinal presentation with excel
Final presentation with excelAura Investments
 
2016 ULI Hines Student Competition Pro Forma_v11
2016 ULI Hines Student Competition  Pro Forma_v112016 ULI Hines Student Competition  Pro Forma_v11
2016 ULI Hines Student Competition Pro Forma_v11Miguel A. Garcia
 
viability-presentation-se-98b.pptx
viability-presentation-se-98b.pptxviability-presentation-se-98b.pptx
viability-presentation-se-98b.pptxSAYKEATTAN
 
Final presentation with excel 2
Final presentation with excel 2Final presentation with excel 2
Final presentation with excel 2Aura Investments
 
Fixed Capital Evaluation PowerPoint Presentation Slides
Fixed Capital Evaluation PowerPoint Presentation SlidesFixed Capital Evaluation PowerPoint Presentation Slides
Fixed Capital Evaluation PowerPoint Presentation SlidesSlideTeam
 
Realisasi dipa mar jun 2011
Realisasi dipa mar jun 2011Realisasi dipa mar jun 2011
Realisasi dipa mar jun 2011pamedan
 
Aminullah assagaf mp2 manajemen proyek
Aminullah assagaf mp2 manajemen proyekAminullah assagaf mp2 manajemen proyek
Aminullah assagaf mp2 manajemen proyekAminullah Assagaf
 
PPT Item # 11 - 4th Quarter Financial & Inv Report
PPT Item # 11 - 4th Quarter Financial & Inv ReportPPT Item # 11 - 4th Quarter Financial & Inv Report
PPT Item # 11 - 4th Quarter Financial & Inv Reportahcitycouncil
 
A158904 tugasan agihan perjalanan
A158904   tugasan agihan perjalananA158904   tugasan agihan perjalanan
A158904 tugasan agihan perjalananumisuci05
 

Semelhante a Assignment - Financial Appraisal (20)

De assignment
De assignmentDe assignment
De assignment
 
Project Management and Development Economics Project (DE)
Project Management and Development Economics Project (DE)Project Management and Development Economics Project (DE)
Project Management and Development Economics Project (DE)
 
The watergate confidential
The watergate confidentialThe watergate confidential
The watergate confidential
 
Real Estate Development - Financial Model
Real Estate Development - Financial ModelReal Estate Development - Financial Model
Real Estate Development - Financial Model
 
KA6564 Assignment 3
KA6564 Assignment 3KA6564 Assignment 3
KA6564 Assignment 3
 
Final slideshow presentation (1)
Final slideshow presentation (1)Final slideshow presentation (1)
Final slideshow presentation (1)
 
Solutions Financial Accounting - Revenue Recognition
Solutions Financial Accounting - Revenue RecognitionSolutions Financial Accounting - Revenue Recognition
Solutions Financial Accounting - Revenue Recognition
 
Fixed Capital Analysis PowerPoint Presentation Slides
Fixed Capital Analysis PowerPoint Presentation SlidesFixed Capital Analysis PowerPoint Presentation Slides
Fixed Capital Analysis PowerPoint Presentation Slides
 
Viability Session 2: The role of viability in plan-making and development man...
Viability Session 2: The role of viability in plan-making and development man...Viability Session 2: The role of viability in plan-making and development man...
Viability Session 2: The role of viability in plan-making and development man...
 
Final presentation with excel
Final presentation with excelFinal presentation with excel
Final presentation with excel
 
2016 ULI Hines Student Competition Pro Forma_v11
2016 ULI Hines Student Competition  Pro Forma_v112016 ULI Hines Student Competition  Pro Forma_v11
2016 ULI Hines Student Competition Pro Forma_v11
 
viability-presentation-se-98b.pptx
viability-presentation-se-98b.pptxviability-presentation-se-98b.pptx
viability-presentation-se-98b.pptx
 
Final presentation with excel 2
Final presentation with excel 2Final presentation with excel 2
Final presentation with excel 2
 
Fixed Capital Evaluation PowerPoint Presentation Slides
Fixed Capital Evaluation PowerPoint Presentation SlidesFixed Capital Evaluation PowerPoint Presentation Slides
Fixed Capital Evaluation PowerPoint Presentation Slides
 
Realisasi dipa mar jun 2011
Realisasi dipa mar jun 2011Realisasi dipa mar jun 2011
Realisasi dipa mar jun 2011
 
Airjet shiva
Airjet shivaAirjet shiva
Airjet shiva
 
Aminullah assagaf mp2 manajemen proyek
Aminullah assagaf mp2 manajemen proyekAminullah assagaf mp2 manajemen proyek
Aminullah assagaf mp2 manajemen proyek
 
PPT Item # 11 - 4th Quarter Financial & Inv Report
PPT Item # 11 - 4th Quarter Financial & Inv ReportPPT Item # 11 - 4th Quarter Financial & Inv Report
PPT Item # 11 - 4th Quarter Financial & Inv Report
 
A158904 tugasan agihan perjalanan
A158904   tugasan agihan perjalananA158904   tugasan agihan perjalanan
A158904 tugasan agihan perjalanan
 
Final Exam 2014 - Financial Model
Final Exam 2014 - Financial ModelFinal Exam 2014 - Financial Model
Final Exam 2014 - Financial Model
 

Mais de Kai Yun Pang

Assignment 2 - Resort Proposal at Pulau Langkawi
Assignment 2 - Resort Proposal at Pulau LangkawiAssignment 2 - Resort Proposal at Pulau Langkawi
Assignment 2 - Resort Proposal at Pulau LangkawiKai Yun Pang
 
Assignment 2 - Report
Assignment 2 - ReportAssignment 2 - Report
Assignment 2 - ReportKai Yun Pang
 
Assignment 1 - Water Pump Station
Assignment 1 - Water Pump StationAssignment 1 - Water Pump Station
Assignment 1 - Water Pump StationKai Yun Pang
 
Assignment 1 - Microsoft Project
Assignment 1 - Microsoft ProjectAssignment 1 - Microsoft Project
Assignment 1 - Microsoft ProjectKai Yun Pang
 
Assignment - Financial Appraisal
Assignment - Financial Appraisal Assignment - Financial Appraisal
Assignment - Financial Appraisal Kai Yun Pang
 
Assignment - FIDIC Contract
Assignment - FIDIC ContractAssignment - FIDIC Contract
Assignment - FIDIC ContractKai Yun Pang
 
Assignment - Report
Assignment - ReportAssignment - Report
Assignment - ReportKai Yun Pang
 
Seminar - CIPAA 2012
Seminar - CIPAA 2012Seminar - CIPAA 2012
Seminar - CIPAA 2012Kai Yun Pang
 
Assignment - S Hotel (Presentation Slide)
Assignment - S Hotel (Presentation Slide)Assignment - S Hotel (Presentation Slide)
Assignment - S Hotel (Presentation Slide)Kai Yun Pang
 
Assignment - S Hotel
Assignment - S HotelAssignment - S Hotel
Assignment - S HotelKai Yun Pang
 
Assignment - Case Study Report
Assignment - Case Study ReportAssignment - Case Study Report
Assignment - Case Study ReportKai Yun Pang
 
Assignment - Journal
Assignment - JournalAssignment - Journal
Assignment - JournalKai Yun Pang
 
Assignment - Community Service
Assignment - Community Service Assignment - Community Service
Assignment - Community Service Kai Yun Pang
 
Assignment - Report
Assignment - ReportAssignment - Report
Assignment - ReportKai Yun Pang
 
Seminar - Partial Possession by Employer
Seminar - Partial Possession by EmployerSeminar - Partial Possession by Employer
Seminar - Partial Possession by EmployerKai Yun Pang
 
Seminar - Question
Seminar - QuestionSeminar - Question
Seminar - QuestionKai Yun Pang
 
Assignment - MK Land
Assignment - MK LandAssignment - MK Land
Assignment - MK LandKai Yun Pang
 
Assignment - Financial Analysis
Assignment - Financial AnalysisAssignment - Financial Analysis
Assignment - Financial AnalysisKai Yun Pang
 
Assignment - Preliminary Cost Appraisal (Presentation Slide)
Assignment - Preliminary Cost Appraisal (Presentation Slide)Assignment - Preliminary Cost Appraisal (Presentation Slide)
Assignment - Preliminary Cost Appraisal (Presentation Slide)Kai Yun Pang
 
Assignment - Preliminary Cost Appraisal
Assignment - Preliminary Cost AppraisalAssignment - Preliminary Cost Appraisal
Assignment - Preliminary Cost AppraisalKai Yun Pang
 

Mais de Kai Yun Pang (20)

Assignment 2 - Resort Proposal at Pulau Langkawi
Assignment 2 - Resort Proposal at Pulau LangkawiAssignment 2 - Resort Proposal at Pulau Langkawi
Assignment 2 - Resort Proposal at Pulau Langkawi
 
Assignment 2 - Report
Assignment 2 - ReportAssignment 2 - Report
Assignment 2 - Report
 
Assignment 1 - Water Pump Station
Assignment 1 - Water Pump StationAssignment 1 - Water Pump Station
Assignment 1 - Water Pump Station
 
Assignment 1 - Microsoft Project
Assignment 1 - Microsoft ProjectAssignment 1 - Microsoft Project
Assignment 1 - Microsoft Project
 
Assignment - Financial Appraisal
Assignment - Financial Appraisal Assignment - Financial Appraisal
Assignment - Financial Appraisal
 
Assignment - FIDIC Contract
Assignment - FIDIC ContractAssignment - FIDIC Contract
Assignment - FIDIC Contract
 
Assignment - Report
Assignment - ReportAssignment - Report
Assignment - Report
 
Seminar - CIPAA 2012
Seminar - CIPAA 2012Seminar - CIPAA 2012
Seminar - CIPAA 2012
 
Assignment - S Hotel (Presentation Slide)
Assignment - S Hotel (Presentation Slide)Assignment - S Hotel (Presentation Slide)
Assignment - S Hotel (Presentation Slide)
 
Assignment - S Hotel
Assignment - S HotelAssignment - S Hotel
Assignment - S Hotel
 
Assignment - Case Study Report
Assignment - Case Study ReportAssignment - Case Study Report
Assignment - Case Study Report
 
Assignment - Journal
Assignment - JournalAssignment - Journal
Assignment - Journal
 
Assignment - Community Service
Assignment - Community Service Assignment - Community Service
Assignment - Community Service
 
Assignment - Report
Assignment - ReportAssignment - Report
Assignment - Report
 
Seminar - Partial Possession by Employer
Seminar - Partial Possession by EmployerSeminar - Partial Possession by Employer
Seminar - Partial Possession by Employer
 
Seminar - Question
Seminar - QuestionSeminar - Question
Seminar - Question
 
Assignment - MK Land
Assignment - MK LandAssignment - MK Land
Assignment - MK Land
 
Assignment - Financial Analysis
Assignment - Financial AnalysisAssignment - Financial Analysis
Assignment - Financial Analysis
 
Assignment - Preliminary Cost Appraisal (Presentation Slide)
Assignment - Preliminary Cost Appraisal (Presentation Slide)Assignment - Preliminary Cost Appraisal (Presentation Slide)
Assignment - Preliminary Cost Appraisal (Presentation Slide)
 
Assignment - Preliminary Cost Appraisal
Assignment - Preliminary Cost AppraisalAssignment - Preliminary Cost Appraisal
Assignment - Preliminary Cost Appraisal
 

Último

4.11.24 Poverty and Inequality in America.pptx
4.11.24 Poverty and Inequality in America.pptx4.11.24 Poverty and Inequality in America.pptx
4.11.24 Poverty and Inequality in America.pptxmary850239
 
Q4-PPT-Music9_Lesson-1-Romantic-Opera.pptx
Q4-PPT-Music9_Lesson-1-Romantic-Opera.pptxQ4-PPT-Music9_Lesson-1-Romantic-Opera.pptx
Q4-PPT-Music9_Lesson-1-Romantic-Opera.pptxlancelewisportillo
 
Expanded definition: technical and operational
Expanded definition: technical and operationalExpanded definition: technical and operational
Expanded definition: technical and operationalssuser3e220a
 
4.11.24 Mass Incarceration and the New Jim Crow.pptx
4.11.24 Mass Incarceration and the New Jim Crow.pptx4.11.24 Mass Incarceration and the New Jim Crow.pptx
4.11.24 Mass Incarceration and the New Jim Crow.pptxmary850239
 
Grade Three -ELLNA-REVIEWER-ENGLISH.pptx
Grade Three -ELLNA-REVIEWER-ENGLISH.pptxGrade Three -ELLNA-REVIEWER-ENGLISH.pptx
Grade Three -ELLNA-REVIEWER-ENGLISH.pptxkarenfajardo43
 
31 ĐỀ THI THỬ VÀO LỚP 10 - TIẾNG ANH - FORM MỚI 2025 - 40 CÂU HỎI - BÙI VĂN V...
31 ĐỀ THI THỬ VÀO LỚP 10 - TIẾNG ANH - FORM MỚI 2025 - 40 CÂU HỎI - BÙI VĂN V...31 ĐỀ THI THỬ VÀO LỚP 10 - TIẾNG ANH - FORM MỚI 2025 - 40 CÂU HỎI - BÙI VĂN V...
31 ĐỀ THI THỬ VÀO LỚP 10 - TIẾNG ANH - FORM MỚI 2025 - 40 CÂU HỎI - BÙI VĂN V...Nguyen Thanh Tu Collection
 
BIOCHEMISTRY-CARBOHYDRATE METABOLISM CHAPTER 2.pptx
BIOCHEMISTRY-CARBOHYDRATE METABOLISM CHAPTER 2.pptxBIOCHEMISTRY-CARBOHYDRATE METABOLISM CHAPTER 2.pptx
BIOCHEMISTRY-CARBOHYDRATE METABOLISM CHAPTER 2.pptxSayali Powar
 
Textual Evidence in Reading and Writing of SHS
Textual Evidence in Reading and Writing of SHSTextual Evidence in Reading and Writing of SHS
Textual Evidence in Reading and Writing of SHSMae Pangan
 
Transaction Management in Database Management System
Transaction Management in Database Management SystemTransaction Management in Database Management System
Transaction Management in Database Management SystemChristalin Nelson
 
Indexing Structures in Database Management system.pdf
Indexing Structures in Database Management system.pdfIndexing Structures in Database Management system.pdf
Indexing Structures in Database Management system.pdfChristalin Nelson
 
Concurrency Control in Database Management system
Concurrency Control in Database Management systemConcurrency Control in Database Management system
Concurrency Control in Database Management systemChristalin Nelson
 
Team Lead Succeed – Helping you and your team achieve high-performance teamwo...
Team Lead Succeed – Helping you and your team achieve high-performance teamwo...Team Lead Succeed – Helping you and your team achieve high-performance teamwo...
Team Lead Succeed – Helping you and your team achieve high-performance teamwo...Association for Project Management
 
Q-Factor General Quiz-7th April 2024, Quiz Club NITW
Q-Factor General Quiz-7th April 2024, Quiz Club NITWQ-Factor General Quiz-7th April 2024, Quiz Club NITW
Q-Factor General Quiz-7th April 2024, Quiz Club NITWQuiz Club NITW
 
Congestive Cardiac Failure..presentation
Congestive Cardiac Failure..presentationCongestive Cardiac Failure..presentation
Congestive Cardiac Failure..presentationdeepaannamalai16
 
Narcotic and Non Narcotic Analgesic..pdf
Narcotic and Non Narcotic Analgesic..pdfNarcotic and Non Narcotic Analgesic..pdf
Narcotic and Non Narcotic Analgesic..pdfPrerana Jadhav
 
ClimART Action | eTwinning Project
ClimART Action    |    eTwinning ProjectClimART Action    |    eTwinning Project
ClimART Action | eTwinning Projectjordimapav
 
Daily Lesson Plan in Mathematics Quarter 4
Daily Lesson Plan in Mathematics Quarter 4Daily Lesson Plan in Mathematics Quarter 4
Daily Lesson Plan in Mathematics Quarter 4JOYLYNSAMANIEGO
 
Oppenheimer Film Discussion for Philosophy and Film
Oppenheimer Film Discussion for Philosophy and FilmOppenheimer Film Discussion for Philosophy and Film
Oppenheimer Film Discussion for Philosophy and FilmStan Meyer
 

Último (20)

Paradigm shift in nursing research by RS MEHTA
Paradigm shift in nursing research by RS MEHTAParadigm shift in nursing research by RS MEHTA
Paradigm shift in nursing research by RS MEHTA
 
4.11.24 Poverty and Inequality in America.pptx
4.11.24 Poverty and Inequality in America.pptx4.11.24 Poverty and Inequality in America.pptx
4.11.24 Poverty and Inequality in America.pptx
 
Q4-PPT-Music9_Lesson-1-Romantic-Opera.pptx
Q4-PPT-Music9_Lesson-1-Romantic-Opera.pptxQ4-PPT-Music9_Lesson-1-Romantic-Opera.pptx
Q4-PPT-Music9_Lesson-1-Romantic-Opera.pptx
 
Expanded definition: technical and operational
Expanded definition: technical and operationalExpanded definition: technical and operational
Expanded definition: technical and operational
 
4.11.24 Mass Incarceration and the New Jim Crow.pptx
4.11.24 Mass Incarceration and the New Jim Crow.pptx4.11.24 Mass Incarceration and the New Jim Crow.pptx
4.11.24 Mass Incarceration and the New Jim Crow.pptx
 
Grade Three -ELLNA-REVIEWER-ENGLISH.pptx
Grade Three -ELLNA-REVIEWER-ENGLISH.pptxGrade Three -ELLNA-REVIEWER-ENGLISH.pptx
Grade Three -ELLNA-REVIEWER-ENGLISH.pptx
 
31 ĐỀ THI THỬ VÀO LỚP 10 - TIẾNG ANH - FORM MỚI 2025 - 40 CÂU HỎI - BÙI VĂN V...
31 ĐỀ THI THỬ VÀO LỚP 10 - TIẾNG ANH - FORM MỚI 2025 - 40 CÂU HỎI - BÙI VĂN V...31 ĐỀ THI THỬ VÀO LỚP 10 - TIẾNG ANH - FORM MỚI 2025 - 40 CÂU HỎI - BÙI VĂN V...
31 ĐỀ THI THỬ VÀO LỚP 10 - TIẾNG ANH - FORM MỚI 2025 - 40 CÂU HỎI - BÙI VĂN V...
 
BIOCHEMISTRY-CARBOHYDRATE METABOLISM CHAPTER 2.pptx
BIOCHEMISTRY-CARBOHYDRATE METABOLISM CHAPTER 2.pptxBIOCHEMISTRY-CARBOHYDRATE METABOLISM CHAPTER 2.pptx
BIOCHEMISTRY-CARBOHYDRATE METABOLISM CHAPTER 2.pptx
 
Textual Evidence in Reading and Writing of SHS
Textual Evidence in Reading and Writing of SHSTextual Evidence in Reading and Writing of SHS
Textual Evidence in Reading and Writing of SHS
 
prashanth updated resume 2024 for Teaching Profession
prashanth updated resume 2024 for Teaching Professionprashanth updated resume 2024 for Teaching Profession
prashanth updated resume 2024 for Teaching Profession
 
Transaction Management in Database Management System
Transaction Management in Database Management SystemTransaction Management in Database Management System
Transaction Management in Database Management System
 
Indexing Structures in Database Management system.pdf
Indexing Structures in Database Management system.pdfIndexing Structures in Database Management system.pdf
Indexing Structures in Database Management system.pdf
 
Concurrency Control in Database Management system
Concurrency Control in Database Management systemConcurrency Control in Database Management system
Concurrency Control in Database Management system
 
Team Lead Succeed – Helping you and your team achieve high-performance teamwo...
Team Lead Succeed – Helping you and your team achieve high-performance teamwo...Team Lead Succeed – Helping you and your team achieve high-performance teamwo...
Team Lead Succeed – Helping you and your team achieve high-performance teamwo...
 
Q-Factor General Quiz-7th April 2024, Quiz Club NITW
Q-Factor General Quiz-7th April 2024, Quiz Club NITWQ-Factor General Quiz-7th April 2024, Quiz Club NITW
Q-Factor General Quiz-7th April 2024, Quiz Club NITW
 
Congestive Cardiac Failure..presentation
Congestive Cardiac Failure..presentationCongestive Cardiac Failure..presentation
Congestive Cardiac Failure..presentation
 
Narcotic and Non Narcotic Analgesic..pdf
Narcotic and Non Narcotic Analgesic..pdfNarcotic and Non Narcotic Analgesic..pdf
Narcotic and Non Narcotic Analgesic..pdf
 
ClimART Action | eTwinning Project
ClimART Action    |    eTwinning ProjectClimART Action    |    eTwinning Project
ClimART Action | eTwinning Project
 
Daily Lesson Plan in Mathematics Quarter 4
Daily Lesson Plan in Mathematics Quarter 4Daily Lesson Plan in Mathematics Quarter 4
Daily Lesson Plan in Mathematics Quarter 4
 
Oppenheimer Film Discussion for Philosophy and Film
Oppenheimer Film Discussion for Philosophy and FilmOppenheimer Film Discussion for Philosophy and Film
Oppenheimer Film Discussion for Philosophy and Film
 

Assignment - Financial Appraisal

  • 1. SCHOOL OF ARCHITECTURE, BUILDING AND DESIGN BACHELOR OF QUANTITY SURVEYING (HONOURS) QSB60303 DEVELOPMENT ECONOMICS AUGUST 2018 SEMESTER GROUP ASSIGNMENT GROUP MEMBERS: NO. NAME STUDENT ID 1. PANG KAI YUN 0319802 2. EVON WEE YEE JING 0325091 3. LEE ZHI XIN 0324563 4. LIM KAR YAN 0325602 5. SAM WEI YIN 0320364 6. SANDRABROOKE GOH 0329884 7. TERENCE TAN PENG ONG 0320275 8. WONG DE-VIN 0319814 LECTURER : ​MS TAY SHIR MEN PUAN NURULHUDA HASHIM SUBMISSION DATE : ​28 NOVEMBER 2018
  • 2. TABLE OF CONTENTS CONTENT PAGE NUMBER 1.0 Number of Unit 2 2.0 Financial Appraisal 4 3.0 Cash Flow based on ‘Sell-then-Build’ concept 3.1 Monthly Cash Inflow 3.2 Monthly Cash Outflow 3.3 Quarter-Yearly Cash Flow 8 8 12 16 4.0 NPV 4.1 Comment on the viability of the project 20 21 5.0 Cash Flow based on a ‘Build-then-Sell’ concept 22 Reference 24 Appendix 25 1
  • 3. 1.0 Number of Unit A Land Size 10 acres 10 x 43,560.00 sq. ft = 435,600.00 sq. ft 1 rood 1 x 10,890.00 sq. ft = 10,890.00 sq. ft 10 pole 10 x 272.25 sq. ft = 2,722.50 sq. ft 449,212.50 sq. ft B Double Storey Shop/Office (26' x 80') 15% of total unit 15% x 164 unit = 24 unit Number of unit Allow an additional 13' x 80' for corner unit; 4' x 80' for end unit Intermediate unit (26' x 80') 2,080 x 18 unit = 37,440 sq. ft Corner unit (39' x 80') 3,120 x 3 unit = 9,360 sq. ft End unit (30' x 80') 2,400 x 3 unit = 7,200 sq. ft 24 unit 54,000 sq. ft Maximum 15 units / block Number of block 24 / 10 unit = 2.4 block or say = 3 block C Double Storey Terrace (22' x 75') Number of unit Allow an additional 11' x 75' for corner unit; 4' x 75' for end unit Intermediate unit (22' x 75') 1,650 x 63 unit = 103,950 sq. ft Corner unit (33' x 75') 2,475 x 7 unit = 17,325 sq. ft End unit (26' x 75') 1,950 x 7 unit = 13,650 sq. ft 77 unit 134,925 sq. ft Maximum 15 units / block Number of block 77 / 12 unit = 6.4 block or say = 7 block D Double Storey Low Cost (20' x 60') 30% of development 30% x 269,527.50 sq. ft = 80,858.25 sq. ft Number of unit Allow an additional 10' x 60' for corner unit; 4' x 60' for end unit Intermediate unit (20' x 60') 1,200 x 53 unit = 63,600 sq. ft Corner unit (30' x 60') 1,800 x 5 unit = 9,000 sq. ft End unit (24' x 60') 1,440 x 5 unit = 7,200 sq. ft 63 unit 79,800 sq. ft Maximum 15 units / block Number of block 63 / 15 unit = 4.2 block or say = 5 block
  • 4. 1.0 Number of Unit E Development area 60% of Land Area 60% x 449,212.50 sq. ft = 269,527.50 sq. ft Double Storey Shop/Office = 54,000.00 sq. ft Double Storey Terrace = 134,925.00 sq. ft Double Storey Low Cost = 79,800.00 sq. ft 268,725.00 sq. ft *Not exceeding 60% of land area
  • 5. 2.0 Financial Appraisal A Gross Development Value (GDV) RM RM Double Storey Shop/Office Intermediate unit RM 850,000.00 x 18 = 15,300,000.00 Corner unit RM 1,600,000.00 x 3 = 4,800,000.00 End unit RM 1,000,000.00 x 3 = 3,000,000.00 23,100,000.00 Double Storey Terrace Intermediate unit RM 400,000.00 x 63 = 25,200,000.00 Corner unit RM 650,000.00 x 7 = 4,550,000.00 End unit RM 500,000.00 x 7 = 3,500,000.00 33,250,000.00 Double Storey Low Cost Intermediate unit RM 45,000.00 x 53 = 2,385,000.00 Corner unit RM 45,000.00 x 5 = 225,000.00 End unit RM 45,000.00 x 5 = 225,000.00 2,835,000.00 59,185,000.00 Less: 7% bumiputra discount from 30% reservation (1,242,885.00) Total Gross Development Value 57,942,115.00
  • 6. 2.0 Financial Appraisal B Cost of Developement B.1 Land Cost Land Purchased @ RM15.00/fs 449,212.50 x 15.00 = 6,738,187.50 B.2 Building Cost i. Double Storey Shop/Office Intermediate Lot 3,600 fs x RM 70.00 x 18 = 4,536,000.00 Corner Lot 6,500 fs x RM 80.00 x 3 = 1,560,000.00 End Lot 3,600 fs x RM 80.00 x 3 = 864,000.00 6,960,000.00 ii. Double Storey Terrace Intermediate 1,500 fs x RM 75.00 x 63 = 7,087,500.00 Corner 1,500 fs x RM 85.00 x 7 = 892,500.00 End 1,500 fs x RM 85.00 x 7 = 892,500.00 8,872,500.00 iii. Double Storey Low Cost Intermediate 900 fs x RM 35.00 x 53 = 1,669,500.00 Corner 900 fs x RM 40.00 x 5 = 180,000.00 End 900 fs x RM 40.00 x 5 = 180,000.00 2,029,500.00 Total Building Cost 17,862,000.00 iv. Earthwork 5% of Building Cost RM 17,862,000.00 x 5% = 893,100.00 v. Infrastructure Costs 10% of Building Cost RM 17,862,000.00 x 10% = 1,786,200.00 Total Construction Cost 20,541,300.00
  • 7. 2.0 Financial Appraisal B.3 Administrative Cost i. Professional fees 9% of construction costs RM 20,541,300.00 x 9% = 1,848,717.00 ii. Administrative fees 2% of GDV RM 57,942,115.00 x 2% = 1,158,842.30 iii. Plan fees RM 2,000 per unit RM 2,000.00 x 164 = 328,000.00 iv. Contributions & fees 2% of construction costs RM 20,541,300.00 x 2% = 410,826.00 v. Advertisement & marketing 1% of GDV RM 57,942,115.00 x 1% = 579,421.15 vi. Conversion premium Commercial @ 20% of land value 54,000.00 fs x RM15 RM 810,000.00 x 20% = 162,000.00 Residential @ 15% of land value 214,725.00 fs x RM15 RM 3,220,875.00 x 15% = 483,131.25 vii. Subdivision RM 1,500 / unit RM 1,500.00 x 164 = 246,000.00 viii. Legal Fees RM 2,500 / unit RM 2,500.00 x 164 = 410,000.00 Total Administrative Cost 5,626,937.70
  • 8. 2.0 Financial Appraisal B.4 Finance Cost i. Cost of Finance (Assume Full) 5.5% p.a + 6.5% p.a 2 x RM 10,270,650.00 x 12% = 616,239.00 ii. Interest on Loan for Purchase of Land P[((1+i)^n)-1) RM 6,500,000.00 x [(1+0.09)^5-1] = 3,501,055.71 Total Financing Cost 4,117,294.71 B.5 Contigencies 5% of Construction Cost RM 20,541,300.00 x 5% 1,027,065.00 Gross Development Cost 38,050,784.91 C Gross Profit Excluding Taxation Gross Development Value (GDV) 57,942,115.00 Development Cost (38,050,784.91) 19,891,330.09 D Rate of Return % of Gross Profit (Profit/GDV) RM 0.34 x 100% 34%
  • 9. 3.0 Cash Flow based on ‘Sell-then-Build’ concept 3.1 Monthly Cash Inflow M1 M2 M3 M4 M5 M6 M7 M8 M9 M10 M11 M12 Sales Projection 1 Double Storey Shop/Office 39.03% 22,614,900.00 10.0% 10.0% 10.0% 10.0% 2 Double Storey Terrace 56.18% 32,551,750.00 30.0% 20.0% 20.0% 10.0% 3 Double Storey Low Cost 4.79% 2,775,465.00 50.0% Monthly Total 100.00% 57,942,115.00 20.76% 0.00% 0.00% 0.00% 0.00% 15.14% 0.00% 0.00% 17.53% 0.00% 0.00% 9.52% % of Cumulative Sales 20.76% 20.76% 20.76% 20.76% 20.76% 35.90% 35.90% 35.90% 53.43% 53.43% 53.43% 62.95% Construction Work Programme Months 1 Earthworks + Foundation 3 100.00% 6.92% 6.92% 6.92% 15.14% 17.53% 9.52% 2 R.C. Framework 9 100.00% 2.31% 2.31% 2.31% 4.83% 4.83% 4.83% 10.67% 10.67% 10.67% 9.52% 3 Walls, Doors & Windows Frame 7 100.00% 5.13% 5.13% 8.63% 8.63% 8.63% 13.40% 4 Roofing, Elec Wiring & Plumbing 7 100.00% 7.63% 7.63% 7.63% 10.01% 5 Internal & External Plastering 8 100.00% 6.68% 8.04% 6 Sewerage Works 5 100.00% 7 Drainage Works 6 100.00% 8 Roadworks + Infrastructure Works 8 100.00% Sales Proceeds 20.76% 15.14% 17.53% 9.52% 1 Signing of S&P Agreement 10.00% 5,794,211.50 1,202,701.50 877,184.00 1,015,957.25 551,666.50 6.92% 6.92% 6.92% 15.14% 17.53% 2 Earthwork + Foundation 10.00% 5,794,211.50 400,900.50 400,900.50 400,900.50 877,184.00 1,015,957.25 2.31% 2.31% 2.31% 4.83% 4.83% 4.83% 10.67% 10.67% 10.67% 3 R.C. Framework 15.00% 8,691,317.25 200,450.25 200,450.25 200,450.25 419,746.25 419,746.25 419,746.25 927,724.88 927,653.26 927,653.26 5.13% 5.13% 8.63% 8.63% 8.63% 4 Walls, Doors & Window Frame 10.00% 5,794,211.50 297,126.50 297,126.50 500,317.95 500,317.95 500,317.95 7.63% 7.63% 7.63% 5 Roofing, Elec Wiring & Plumbing 10.00% 5,794,211.50 442,263.25 442,263.25 442,263.25 6.68% 6 Internal & External Plastering 10.00% 5,794,211.50 386,980.34 7 Sewerage Works 5.00% 2,897,105.75 8 Drainage Works 2.50% 1,448,552.88 9 Roadworks + Infrastructure Works 2.50% 1,448,552.88 10 On the date the Purchaser takes VP of the said 17.50% 10,139,870.13 Property with the water and electricity supply ready for connection 11 On the date the Purchaser takes VP of the 2.50% 1,448,552.88 said Property in item 10 where the Developer has delivered to the Purchaser or the Purchaser's Solicitor the original issue document of title to the said Building Lot registered in the name of the Purchaser 12 On the date the Purchaser takes VP of the said 5.00% 2,897,105.75 Property as in item 10 and to be held by the Developer's solicitor as stakeholder for payment to the Developer (2.5% at the expiry of the period 8 months; 2.5% at expiry of the period 24 months) Monthly Total Cash Flow 100.00% 57,942,115.00 1,202,701.50 400,900.50 400,900.50 601,350.75 200,450.25 1,077,634.25 1,296,930.25 716,872.75 1,732,830.00 2,886,263.33 1,870,234.46 2,808,881.30 Monthly Cumulative Cash Inflow 57,942,115.00 1,202,701.50 1,603,602.00 2,004,502.50 2,605,853.25 2,806,303.50 3,883,937.75 5,180,868.00 5,897,740.75 7,630,570.75 10,516,834.08 12,387,068.54 15,195,949.84 Quaterly Total Cash Inflow 57,942,115.00 2,004,502.50 1,879,435.25 3,746,633.00 7,565,379.09 Quaterly Cumulative Cash Inflow 2,004,502.50 3,883,937.75 7,630,570.75 15,195,949.84 Assumptions: - % of sale proceeds based on S&P agreement (Clause 5) third schedule - The earthwork and foundation are paid simultaneously. - The roadworks and infrastructure works are paid simultaneously. - Item 2 - 9 are paid within 30 days after the receipt by the Purchaser of the Developer's written notice of the completion of such items. Amount (RM) Sales Precentage DescriptionItem Q1 2013 Q4Q2 Q3
  • 10. 3.0 Cash Flow based on ‘Sell-then-Build’ concept 3.1 Monthly Cash Inflow Sales Projection 1 Double Storey Shop/Office 39.03% 22,614,900.00 2 Double Storey Terrace 56.18% 32,551,750.00 3 Double Storey Low Cost 4.79% 2,775,465.00 Monthly Total 100.00% 57,942,115.00 % of Cumulative Sales Construction Work Programme Months 1 Earthworks + Foundation 3 100.00% 2 R.C. Framework 9 100.00% 3 Walls, Doors & Windows Frame 7 100.00% 4 Roofing, Elec Wiring & Plumbing 7 100.00% 5 Internal & External Plastering 8 100.00% 6 Sewerage Works 5 100.00% 7 Drainage Works 6 100.00% 8 Roadworks + Infrastructure Works 8 100.00% Sales Proceeds 1 Signing of S&P Agreement 10.00% 5,794,211.50 2 Earthwork + Foundation 10.00% 5,794,211.50 3 R.C. Framework 15.00% 8,691,317.25 4 Walls, Doors & Window Frame 10.00% 5,794,211.50 5 Roofing, Elec Wiring & Plumbing 10.00% 5,794,211.50 6 Internal & External Plastering 10.00% 5,794,211.50 7 Sewerage Works 5.00% 2,897,105.75 8 Drainage Works 2.50% 1,448,552.88 9 Roadworks + Infrastructure Works 2.50% 1,448,552.88 10 On the date the Purchaser takes VP of the said 17.50% 10,139,870.13 Property with the water and electricity supply ready for connection 11 On the date the Purchaser takes VP of the 2.50% 1,448,552.88 said Property in item 10 where the Developer has delivered to the Purchaser or the Purchaser's Solicitor the original issue document of title to the said Building Lot registered in the name of the Purchaser 12 On the date the Purchaser takes VP of the said 5.00% 2,897,105.75 Property as in item 10 and to be held by the Developer's solicitor as stakeholder for payment to the Developer (2.5% at the expiry of the period 8 months; 2.5% at expiry of the period 24 months) Monthly Total Cash Flow 100.00% 57,942,115.00 Monthly Cumulative Cash Inflow 57,942,115.00 Quaterly Total Cash Inflow 57,942,115.00 Quaterly Cumulative Cash Inflow Assumptions: - % of sale proceeds based on S&P agreement (Clause 5) third schedule - The earthwork and foundation are paid simultaneously. - The roadworks and infrastructure works are paid simultaneously. - Item 2 - 9 are paid within 30 days after the receipt by the Purchaser of the Developer's written notice of the completion of such items. Amount (RM) Sales Precentage DescriptionItem M13 M14 M15 M16 M17 M18 M19 M20 M21 M22 M23 M24 10.0% 20.0% 30.0% 20.0% 50.0% 0.00% 0.00% 17.53% 0.00% 0.00% 7.81% 0.00% 0.00% 11.71% 0.00% 0.00% 0.00% 62.95% 62.95% 80.48% 80.48% 80.48% 88.29% 88.29% 88.29% 100.00% 100.00% 100.00% 100.00% 17.53% 7.81% 11.71% 17.53% 7.81% 11.71% 13.40% 17.53% 7.81% 11.71% 10.01% 10.01% 27.55% 7.81% 11.71% 8.04% 8.04% 12.42% 12.42% 12.42% 20.23% 11.71% 17.66% 17.66% 21.56% 21.56% 21.56% 13.41% 14.98% 14.98% 14.98% 20.83% 20.83% 10.06% 10.06% 11.36% 11.36% 11.36% 22.90% 11.45% 11.45% 17.53% 7.81% 11.71% 1,015,957.25 452,298.00 678,447.00 9.52% 17.53% 7.81% 11.71% 551,666.50 1,015,957.25 452,298.00 678,447.00 9.52% 17.53% 7.81% 11.71% 827,499.75 1,523,935.88 678,447.00 1,017,670.50 13.40% 13.40% 0.00% 17.53% 7.81% 11.71% 776,151.20 776,151.20 1,015,957.25 452,298.00 678,447.00 10.01% 10.01% 10.01% 27.55% 7.81% 11.71% 580,179.88 580,179.88 580,179.88 1,596,137.13 452,298.00 678,447.00 8.04% 8.04% 8.04% 12.42% 12.42% 12.42% 20.23% 0.00% 0.00% 11.71% 465,789.84 465,789.84 465,789.84 719,779.16 719,779.16 719,779.16 1,172,077.16 678,447.00 17.66% 17.66% 21.56% 21.56% 21.56% 511,576.45 511,576.45 624,650.95 624,650.95 624,650.95 13.41% 14.98% 14.98% 14.98% 20.83% 20.83% 0.00% 194,311.10 216,926.00 216,926.00 216,926.00 301,731.88 301,731.88 10.06% 10.06% 11.36% 11.36% 11.36% 22.90% 11.45% 145,733.33 145,733.33 164,579.08 164,579.08 164,579.08 331,674.49 165,837.25 100.00% 10,139,870.13 100.00% 1,448,552.88 3,201,287.17 1,822,120.92 2,061,926.97 5,871,766.66 719,779.16 1,366,388.26 3,424,344.16 728,502.45 1,406,949.45 4,657,841.33 926,382.83 12,378,911.20 18,397,237.01 20,219,357.93 22,281,284.90 28,153,051.55 28,872,830.71 30,239,218.97 33,663,563.13 34,392,065.58 35,799,015.04 40,456,856.37 41,383,239.20 53,762,150.39 7,085,335.06 7,957,934.07 5,559,796.07 17,963,135.35 22,281,284.90 30,239,218.97 35,799,015.04 53,762,150.39 Q2 Q3Q1 2014 Q4
  • 11. 3.0 Cash Flow based on ‘Sell-then-Build’ concept 3.1 Monthly Cash Inflow Sales Projection 1 Double Storey Shop/Office 39.03% 22,614,900.00 2 Double Storey Terrace 56.18% 32,551,750.00 3 Double Storey Low Cost 4.79% 2,775,465.00 Monthly Total 100.00% 57,942,115.00 % of Cumulative Sales Construction Work Programme Months 1 Earthworks + Foundation 3 100.00% 2 R.C. Framework 9 100.00% 3 Walls, Doors & Windows Frame 7 100.00% 4 Roofing, Elec Wiring & Plumbing 7 100.00% 5 Internal & External Plastering 8 100.00% 6 Sewerage Works 5 100.00% 7 Drainage Works 6 100.00% 8 Roadworks + Infrastructure Works 8 100.00% Sales Proceeds 1 Signing of S&P Agreement 10.00% 5,794,211.50 2 Earthwork + Foundation 10.00% 5,794,211.50 3 R.C. Framework 15.00% 8,691,317.25 4 Walls, Doors & Window Frame 10.00% 5,794,211.50 5 Roofing, Elec Wiring & Plumbing 10.00% 5,794,211.50 6 Internal & External Plastering 10.00% 5,794,211.50 7 Sewerage Works 5.00% 2,897,105.75 8 Drainage Works 2.50% 1,448,552.88 9 Roadworks + Infrastructure Works 2.50% 1,448,552.88 10 On the date the Purchaser takes VP of the said 17.50% 10,139,870.13 Property with the water and electricity supply ready for connection 11 On the date the Purchaser takes VP of the 2.50% 1,448,552.88 said Property in item 10 where the Developer has delivered to the Purchaser or the Purchaser's Solicitor the original issue document of title to the said Building Lot registered in the name of the Purchaser 12 On the date the Purchaser takes VP of the said 5.00% 2,897,105.75 Property as in item 10 and to be held by the Developer's solicitor as stakeholder for payment to the Developer (2.5% at the expiry of the period 8 months; 2.5% at expiry of the period 24 months) Monthly Total Cash Flow 100.00% 57,942,115.00 Monthly Cumulative Cash Inflow 57,942,115.00 Quaterly Total Cash Inflow 57,942,115.00 Quaterly Cumulative Cash Inflow Assumptions: - % of sale proceeds based on S&P agreement (Clause 5) third schedule - The earthwork and foundation are paid simultaneously. - The roadworks and infrastructure works are paid simultaneously. - Item 2 - 9 are paid within 30 days after the receipt by the Purchaser of the Developer's written notice of the completion of such items. Amount (RM) Sales Precentage DescriptionItem M25 M26 M27 M28 M29 M30 M31 M32 M33 M34 M35 M36 0.00% 0.00% 0.00% 0.00% 0.00% 0.00% 0.00% 0.00% 0.00% 0.00% 0.00% 0.00% 100.00% 100.00% 100.00% 100.00% 100.00% 100.00% 100.00% 100.00% 100.00% 100.00% 100.00% 100.00% 0.00% 0.00% 0.00% 0.00% 11.45% 165,837.25 50.00% 1,448,552.88 165,837.25 - - - - - - 1,448,552.88 - - - - 53,927,987.64 53,927,987.64 53,927,987.64 53,927,987.64 53,927,987.64 53,927,987.64 53,927,987.64 55,376,540.51 55,376,540.51 55,376,540.51 55,376,540.51 55,376,540.51 165,837.25 - 1,448,552.88 - 53,927,987.64 53,927,987.64 55,376,540.51 55,376,540.51 2015 Q1 Q3Q2 Q4
  • 12. 3.0 Cash Flow based on ‘Sell-then-Build’ concept 3.1 Monthly Cash Inflow Sales Projection 1 Double Storey Shop/Office 39.03% 22,614,900.00 2 Double Storey Terrace 56.18% 32,551,750.00 3 Double Storey Low Cost 4.79% 2,775,465.00 Monthly Total 100.00% 57,942,115.00 % of Cumulative Sales Construction Work Programme Months 1 Earthworks + Foundation 3 100.00% 2 R.C. Framework 9 100.00% 3 Walls, Doors & Windows Frame 7 100.00% 4 Roofing, Elec Wiring & Plumbing 7 100.00% 5 Internal & External Plastering 8 100.00% 6 Sewerage Works 5 100.00% 7 Drainage Works 6 100.00% 8 Roadworks + Infrastructure Works 8 100.00% Sales Proceeds 1 Signing of S&P Agreement 10.00% 5,794,211.50 2 Earthwork + Foundation 10.00% 5,794,211.50 3 R.C. Framework 15.00% 8,691,317.25 4 Walls, Doors & Window Frame 10.00% 5,794,211.50 5 Roofing, Elec Wiring & Plumbing 10.00% 5,794,211.50 6 Internal & External Plastering 10.00% 5,794,211.50 7 Sewerage Works 5.00% 2,897,105.75 8 Drainage Works 2.50% 1,448,552.88 9 Roadworks + Infrastructure Works 2.50% 1,448,552.88 10 On the date the Purchaser takes VP of the said 17.50% 10,139,870.13 Property with the water and electricity supply ready for connection 11 On the date the Purchaser takes VP of the 2.50% 1,448,552.88 said Property in item 10 where the Developer has delivered to the Purchaser or the Purchaser's Solicitor the original issue document of title to the said Building Lot registered in the name of the Purchaser 12 On the date the Purchaser takes VP of the said 5.00% 2,897,105.75 Property as in item 10 and to be held by the Developer's solicitor as stakeholder for payment to the Developer (2.5% at the expiry of the period 8 months; 2.5% at expiry of the period 24 months) Monthly Total Cash Flow 100.00% 57,942,115.00 Monthly Cumulative Cash Inflow 57,942,115.00 Quaterly Total Cash Inflow 57,942,115.00 Quaterly Cumulative Cash Inflow Assumptions: - % of sale proceeds based on S&P agreement (Clause 5) third schedule - The earthwork and foundation are paid simultaneously. - The roadworks and infrastructure works are paid simultaneously. - Item 2 - 9 are paid within 30 days after the receipt by the Purchaser of the Developer's written notice of the completion of such items. Amount (RM) Sales Precentage DescriptionItem M37 M38 M39 M40 M41 M42 M43 M44 M45 M46 M47 M48 0.00% 0.00% 0.00% 0.00% 0.00% 0.00% 0.00% 0.00% 0.00% 0.00% 0.00% 0.00% 100.00% 100.00% 100.00% 100.00% 100.00% 100.00% 100.00% 100.00% 100.00% 100.00% 100.00% 100.00% 50.00% 1,448,552.88 - - - - - - - - - - - 1,448,552.88 55,376,540.51 55,376,540.51 55,376,540.51 55,376,540.51 55,376,540.51 55,376,540.51 55,376,540.51 55,376,540.51 55,376,540.51 55,376,540.51 55,376,540.51 56,825,093.39 - - - 1,448,552.88 55,376,540.51 55,376,540.51 55,376,540.51 56,825,093.39 2016 Q3 Q4Q2Q1
  • 13. 3.0 Cash Flow based on ‘Sell-then-Build’ concept 3.2 Monthly Cash Outflow M1 M2 M3 M4 M5 M6 M7 M8 M9 M10 M11 M12 Construction Costs 1 Earthwork + Foundation 4 10.00% 2,054,130.00 1,027,065.00 513,532.50 513,532.50 2 R.C. Framework 9 25.00% 5,135,325.00 570,591.67 570,591.67 570,591.67 570,591.67 570,591.67 570,591.67 570,591.67 570,591.67 570,591.67 3 Walls, Doors, & Windows Frame 7 15.00% 3,081,195.00 440,170.71 440,170.71 440,170.71 440,170.71 440,170.71 4 Roofing, Elec. Wiring & Plumbing 7 15.00% 3,081,195.00 440,170.71 440,170.71 440,170.71 5 Internal & External Plastering 8 15.00% 3,081,195.00 385,149.38 6 Sewerage Works 5 5.00% 1,027,065.00 7 Drainage Works 6 5.00% 1,027,065.00 8 Roadworks + Infrastructure Works 8 10.00% 2,054,130.00 Total Construction Cost 100.00% 20,541,300.00 Monthly Total Cash Outflow (Before Retention) 1,027,065.00 513,532.50 1,084,124.17 570,591.67 570,591.67 570,591.67 1,010,762.38 1,010,762.38 1,450,933.10 1,450,933.10 1,836,082.47 Monthly Cumulative Outflow (Before Retention) 1,027,065.00 1,540,597.50 2,624,721.67 3,195,313.33 3,765,905.00 4,336,496.67 5,347,259.05 6,358,021.43 7,808,954.52 9,259,887.62 11,095,970.09 Less Retention (10%, Limit 5%) 1,027,065.00 (102,706.50) (154,059.75) (262,472.17) (319,531.33) (376,590.50) (433,649.67) (534,725.90) (635,802.14) (780,895.45) (925,988.76) (1,027,065.00) Monthly Cumulative Outflow (After Retention) 924,358.50 1,386,537.75 2,362,249.50 2,875,782.00 3,389,314.50 3,902,847.00 4,812,533.14 5,722,219.29 7,028,059.07 8,333,898.86 10,068,905.09 Monthly Total Cash Outflow (After Retention) 924,358.50 462,179.25 975,711.75 513,532.50 513,532.50 513,532.50 909,686.14 909,686.14 1,305,839.79 1,305,839.79 1,735,006.23 Quarterly Total Cash Outflow 1,386,537.75 2,002,776.75 2,332,904.79 4,346,685.80 Quarterly Cumulative Cash Outflow 1,386,537.75 3,389,314.50 5,722,219.29 10,068,905.09 MonthsItem Description Q4Q2 Q3Q1 2013 Amount (RM)Percentage
  • 14. 3.0 Cash Flow based on ‘Sell-then-Build’ concept 3.2 Monthly Cash Outflow Construction Costs 1 Earthwork + Foundation 4 10.00% 2,054,130.00 2 R.C. Framework 9 25.00% 5,135,325.00 3 Walls, Doors, & Windows Frame 7 15.00% 3,081,195.00 4 Roofing, Elec. Wiring & Plumbing 7 15.00% 3,081,195.00 5 Internal & External Plastering 8 15.00% 3,081,195.00 6 Sewerage Works 5 5.00% 1,027,065.00 7 Drainage Works 6 5.00% 1,027,065.00 8 Roadworks + Infrastructure Works 8 10.00% 2,054,130.00 Total Construction Cost 100.00% 20,541,300.00 Monthly Total Cash Outflow (Before Retention) Monthly Cumulative Outflow (Before Retention) Less Retention (10%, Limit 5%) 1,027,065.00 Monthly Cumulative Outflow (After Retention) Monthly Total Cash Outflow (After Retention) Quarterly Total Cash Outflow Quarterly Cumulative Cash Outflow MonthsItem Description Amount (RM)Percentage M13 M14 M15 M16 M17 M18 M19 M20 M21 M22 M23 M24 440,170.71 440,170.71 440,170.71 440,170.71 440,170.71 440,170.71 385,149.38 385,149.38 385,149.38 385,149.38 385,149.38 385,149.38 385,149.38 205,413.00 205,413.00 205,413.00 205,413.00 205,413.00 171,177.50 171,177.50 171,177.50 171,177.50 171,177.50 171,177.50 256,766.25 256,766.25 256,766.25 256,766.25 256,766.25 256,766.25 256,766.25 1,265,490.80 1,265,490.80 825,320.09 825,320.09 641,915.63 813,093.13 813,093.13 633,356.75 633,356.75 633,356.75 376,590.50 462,179.25 12,361,460.89 13,626,951.70 14,452,271.79 15,277,591.88 15,919,507.50 16,732,600.63 17,545,693.75 18,179,050.50 18,812,407.25 19,445,764.00 19,822,354.50 20,284,533.75 (1,027,065.00) (1,027,065.00) (1,027,065.00) (1,027,065.00) (1,027,065.00) (1,027,065.00) (1,027,065.00) (1,027,065.00) (1,027,065.00) (1,027,065.00) (1,027,065.00) (1,027,065.00) 11,334,395.89 12,599,886.70 13,425,206.79 14,250,526.88 14,892,442.50 15,705,535.63 16,518,628.75 17,151,985.50 17,785,342.25 18,418,699.00 18,795,289.50 19,257,468.75 1,265,490.80 1,265,490.80 825,320.09 825,320.09 641,915.63 813,093.13 813,093.13 633,356.75 633,356.75 633,356.75 376,590.50 462,179.25 3,356,301.70 2,280,328.84 2,079,806.63 1,472,126.50 13,425,206.79 15,705,535.63 17,785,342.25 19,257,468.75 Q3 Q4 2014 Q1 Q2
  • 15. 3.0 Cash Flow based on ‘Sell-then-Build’ concept 3.2 Monthly Cash Outflow Construction Costs 1 Earthwork + Foundation 4 10.00% 2,054,130.00 2 R.C. Framework 9 25.00% 5,135,325.00 3 Walls, Doors, & Windows Frame 7 15.00% 3,081,195.00 4 Roofing, Elec. Wiring & Plumbing 7 15.00% 3,081,195.00 5 Internal & External Plastering 8 15.00% 3,081,195.00 6 Sewerage Works 5 5.00% 1,027,065.00 7 Drainage Works 6 5.00% 1,027,065.00 8 Roadworks + Infrastructure Works 8 10.00% 2,054,130.00 Total Construction Cost 100.00% 20,541,300.00 Monthly Total Cash Outflow (Before Retention) Monthly Cumulative Outflow (Before Retention) Less Retention (10%, Limit 5%) 1,027,065.00 Monthly Cumulative Outflow (After Retention) Monthly Total Cash Outflow (After Retention) Quarterly Total Cash Outflow Quarterly Cumulative Cash Outflow MonthsItem Description Amount (RM)Percentage M25 M26 M27 M28 M29 M30 M31 M32 M33 M34 M35 M36 First Moeity 256,766.25 256,766.25 0.00 0.00 0.00 0.00 0.00 0.00 0.00 0.00 0.00 0.00 0.00 20,541,300.00 20,541,300.00 20,541,300.00 20,541,300.00 20,541,300.00 20,541,300.00 20,541,300.00 20,541,300.00 20,541,300.00 20,541,300.00 20,541,300.00 20,541,300.00 (513,532.50) (513,532.50) (513,532.50) (513,532.50) (513,532.50) (513,532.50) (513,532.50) (513,532.50) (513,532.50) (513,532.50) (513,532.50) (513,532.50) 20,027,767.50 20,027,767.50 20,027,767.50 20,027,767.50 20,027,767.50 20,027,767.50 20,027,767.50 20,027,767.50 20,027,767.50 20,027,767.50 20,027,767.50 20,027,767.50 770,298.75 0.00 0.00 0.00 0.00 0.00 0.00 0.00 0.00 0.00 0.00 0.00 770,298.75 20,027,767.50 2015 Q2Q1 Q4Q3
  • 16. 3.0 Cash Flow based on ‘Sell-then-Build’ concept 3.2 Monthly Cash Outflow Construction Costs 1 Earthwork + Foundation 4 10.00% 2,054,130.00 2 R.C. Framework 9 25.00% 5,135,325.00 3 Walls, Doors, & Windows Frame 7 15.00% 3,081,195.00 4 Roofing, Elec. Wiring & Plumbing 7 15.00% 3,081,195.00 5 Internal & External Plastering 8 15.00% 3,081,195.00 6 Sewerage Works 5 5.00% 1,027,065.00 7 Drainage Works 6 5.00% 1,027,065.00 8 Roadworks + Infrastructure Works 8 10.00% 2,054,130.00 Total Construction Cost 100.00% 20,541,300.00 Monthly Total Cash Outflow (Before Retention) Monthly Cumulative Outflow (Before Retention) Less Retention (10%, Limit 5%) 1,027,065.00 Monthly Cumulative Outflow (After Retention) Monthly Total Cash Outflow (After Retention) Quarterly Total Cash Outflow Quarterly Cumulative Cash Outflow MonthsItem Description Amount (RM)Percentage M37 M38 M39 M40 M41 M42 M43 M44 M45 M46 M47 M48 Second Moeity 0.00 0.00 0.00 0.00 0.00 0.00 20,541,300.00 20,541,300.00 20,541,300.00 20,541,300.00 20,541,300.00 20,541,300.00 (513,532.50) (513,532.50) (513,532.50) (513,532.50) (513,532.50) 0.00 20,027,767.50 20,027,767.50 20,027,767.50 20,027,767.50 20,027,767.50 20,541,300.00 0.00 0.00 0.00 0.00 0.00 513,532.50 513,532.50 20,541,300.00 Q3Q2 2016 Q4Q1
  • 17. 3.0 Cash Flow based on ‘Sell-then-Build’ concept 3.3 Quarter-Yearly Cash Flow Q1 Q2 Q3 Q4 Q1 Q2 Q3 Q4 A CASH INFLOW 1 Bank Loan of Land Purchase 6,500,000.00 6,500,000.00 2 Sales Projection 56,825,093.39 Total Cash Inflow 63,325,093.39 6,500,000.00 0.00 0.00 0.00 0.00 0.00 0.00 0.00 Cummulative Cash Inflow 6,500,000.00 6,500,000.00 6,500,000.00 6,500,000.00 6,500,000.00 6,500,000.00 6,500,000.00 6,500,000.00 B CASH OUTFLOW 1 Land Cost 6,738,187.50 6,738,187.50 2 Construction Cost 20,541,300.00 3 Repayment of Land Loan 6,500,000.00 Administrative Cost 4 Professional Fees 1,848,717.00 5 Administrative Fees 1,158,842.30 6 Plan Fees 328,000.00 7 Contributions & Fees 410,826.00 8 Advertising & Marketing 579,421.15 9 Conversion Premium :- i) Commercial 162,000.00 ii) Residential 483,131.25 10 Subdivision 246,000.00 11 Legal Fees 410,000.00 12 Contingencies 1,027,065.00 Finance Cost 13 Bridging Finance 616,239.00 14 Financing Cost for Land 3,501,055.71 141,558.18 144,641.06 147,791.07 151,009.69 154,298.41 157,658.75 161,092.27 164,600.57 Total Cash Outflow 44,550,784.91 6,879,745.68 144,641.06 147,791.07 151,009.69 154,298.41 157,658.75 161,092.27 164,600.57 Cummulative Cash Outflow 6,879,745.68 7,024,386.73 7,172,177.81 7,323,187.50 7,477,485.91 7,635,144.66 7,796,236.93 7,960,837.50 Net Cash Flow 18,774,308.48 (379,745.68) (144,641.06) (147,791.07) (151,009.69) (154,298.41) (157,658.75) (161,092.27) (164,600.57) Cummulative Cash Flow (144,641.06) (292,432.13) (443,441.82) (597,740.24) (755,398.99) (916,491.26) (1,081,091.82) DescriptionItem Amount (RM) 20112010
  • 18. 3.0 Cash Flow based on ‘Sell-then-Build’ concept 3.3 Quarter-Yearly Cash Flow A CASH INFLOW 1 Bank Loan of Land Purchase 6,500,000.00 2 Sales Projection 56,825,093.39 Total Cash Inflow 63,325,093.39 Cummulative Cash Inflow B CASH OUTFLOW 1 Land Cost 6,738,187.50 2 Construction Cost 20,541,300.00 3 Repayment of Land Loan 6,500,000.00 Administrative Cost 4 Professional Fees 1,848,717.00 5 Administrative Fees 1,158,842.30 6 Plan Fees 328,000.00 7 Contributions & Fees 410,826.00 8 Advertising & Marketing 579,421.15 9 Conversion Premium :- i) Commercial 162,000.00 ii) Residential 483,131.25 10 Subdivision 246,000.00 11 Legal Fees 410,000.00 12 Contingencies 1,027,065.00 Finance Cost 13 Bridging Finance 616,239.00 14 Financing Cost for Land 3,501,055.71 Total Cash Outflow 44,550,784.91 Cummulative Cash Outflow Net Cash Flow 18,774,308.48 Cummulative Cash Flow DescriptionItem Amount (RM) Q1 Q2 Q3 Q4 Q1 Q2 Q3 Q4 2,004,502.50 1,879,435.25 3,746,633.00 7,565,379.09 0.00 0.00 0.00 0.00 2,004,502.50 1,879,435.25 3,746,633.00 7,565,379.09 6,500,000.00 6,500,000.00 6,500,000.00 6,500,000.00 8,504,502.50 10,383,937.75 14,130,570.75 21,695,949.84 1,386,537.75 2,002,776.75 2,332,904.79 4,346,685.80 1,109,230.20 369,743.40 144,855.29 144,855.29 144,855.29 144,855.29 328,000.00 410,826.00 72,427.64 72,427.64 72,427.64 72,427.64 162,000.00 483,131.25 246,000.00 410,000.00 128,383.13 128,383.13 128,383.13 128,383.13 77,029.88 77,029.88 77,029.88 77,029.88 168,185.27 171,848.04 175,590.58 179,414.62 183,321.94 187,314.36 191,393.73 195,561.93 168,185.27 171,848.04 175,590.58 179,414.62 5,141,743.07 2,612,787.04 2,946,994.44 5,334,687.07 8,129,022.77 8,300,870.81 8,476,461.38 8,655,876.00 13,797,619.07 16,410,406.12 19,357,400.56 24,692,087.63 (168,185.27) (171,848.04) (175,590.58) (179,414.62) (3,137,240.57) (733,351.79) 799,638.56 2,230,692.02 (1,249,277.09) (1,421,125.13) (1,596,715.71) (1,776,130.32) (4,913,370.90) (5,646,722.69) (4,847,084.13) (2,616,392.11) 20132012
  • 19. 3.0 Cash Flow based on ‘Sell-then-Build’ concept 3.3 Quarter-Yearly Cash Flow A CASH INFLOW 1 Bank Loan of Land Purchase 6,500,000.00 2 Sales Projection 56,825,093.39 Total Cash Inflow 63,325,093.39 Cummulative Cash Inflow B CASH OUTFLOW 1 Land Cost 6,738,187.50 2 Construction Cost 20,541,300.00 3 Repayment of Land Loan 6,500,000.00 Administrative Cost 4 Professional Fees 1,848,717.00 5 Administrative Fees 1,158,842.30 6 Plan Fees 328,000.00 7 Contributions & Fees 410,826.00 8 Advertising & Marketing 579,421.15 9 Conversion Premium :- i) Commercial 162,000.00 ii) Residential 483,131.25 10 Subdivision 246,000.00 11 Legal Fees 410,000.00 12 Contingencies 1,027,065.00 Finance Cost 13 Bridging Finance 616,239.00 14 Financing Cost for Land 3,501,055.71 Total Cash Outflow 44,550,784.91 Cummulative Cash Outflow Net Cash Flow 18,774,308.48 Cummulative Cash Flow DescriptionItem Amount (RM) Q1 Q2 Q3 Q4 Q1 Q2 Q3 Q4 7,085,335.06 7,957,934.07 5,559,796.07 17,963,135.35 165,837.25 0.00 1,448,552.88 0.00 7,085,335.06 7,957,934.07 5,559,796.07 17,963,135.35 165,837.25 0.00 1,448,552.88 0.00 28,781,284.90 36,739,218.97 42,299,015.04 60,262,150.39 60,427,987.64 60,427,987.64 61,876,540.51 61,876,540.51 3,356,301.70 2,280,328.84 2,079,806.63 1,472,126.50 770,298.75 6,500,000.00 369,743.40 144,855.29 144,855.29 144,855.29 144,855.29 72,427.64 72,427.64 72,427.64 72,427.64 128,383.13 128,383.13 128,383.13 128,383.13 77,029.88 77,029.88 77,029.88 77,029.88 199,820.92 204,172.65 208,619.16 213,162.51 3,978,818.55 2,907,197.42 2,711,121.72 8,977,728.34 770,298.75 0.00 0.00 0.00 28,670,906.17 31,578,103.60 34,289,225.32 43,266,953.66 44,037,252.41 44,037,252.41 44,037,252.41 44,037,252.41 3,106,516.51 5,050,736.65 2,848,674.35 8,985,407.01 (604,461.50) 0.00 1,448,552.88 0.00 490,124.40 5,540,861.05 8,389,535.40 17,374,942.41 16,770,480.91 16,770,480.91 18,219,033.78 18,219,033.78 20152014
  • 20. 3.0 Cash Flow based on ‘Sell-then-Build’ concept 3.3 Quarter-Yearly Cash Flow A CASH INFLOW 1 Bank Loan of Land Purchase 6,500,000.00 2 Sales Projection 56,825,093.39 Total Cash Inflow 63,325,093.39 Cummulative Cash Inflow B CASH OUTFLOW 1 Land Cost 6,738,187.50 2 Construction Cost 20,541,300.00 3 Repayment of Land Loan 6,500,000.00 Administrative Cost 4 Professional Fees 1,848,717.00 5 Administrative Fees 1,158,842.30 6 Plan Fees 328,000.00 7 Contributions & Fees 410,826.00 8 Advertising & Marketing 579,421.15 9 Conversion Premium :- i) Commercial 162,000.00 ii) Residential 483,131.25 10 Subdivision 246,000.00 11 Legal Fees 410,000.00 12 Contingencies 1,027,065.00 Finance Cost 13 Bridging Finance 616,239.00 14 Financing Cost for Land 3,501,055.71 Total Cash Outflow 44,550,784.91 Cummulative Cash Outflow Net Cash Flow 18,774,308.48 Cummulative Cash Flow DescriptionItem Amount (RM) Q1 Q2 Q3 Q4 0.00 0.00 0.00 1,448,552.88 0.00 0.00 0.00 1,448,552.88 61,876,540.51 61,876,540.51 61,876,540.51 63,325,093.39 513,532.50 0.00 513,532.50 0.00 0.00 44,037,252.41 44,550,784.91 44,550,784.91 44,550,784.91 0.00 (513,532.50) 0.00 1,448,552.88 18,219,033.78 17,705,501.28 17,705,501.28 19,154,054.16 2016
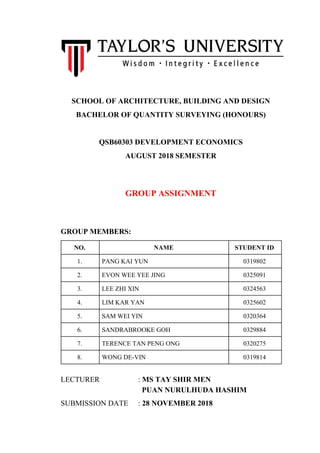
  • 21. 4.0 NPV PV Factor 12% per annum Q1 6,500,000.00 (6,879,745.68) (379,745.68) 0.9721 (369,150.77) Q2 0.00 (144,641.06) (144,641.06) 0.9449 (136,671.33) Q3 0.00 (147,791.07) (147,791.07) 0.9185 (135,746.10) Q4 0.00 (151,009.69) (151,009.69) 0.8929 (134,836.56) Q1 0.00 (154,298.41) (154,298.41) 0.8679 (133,915.59) Q2 0.00 (157,658.75) (157,658.75) 0.8437 (133,016.69) Q3 0.00 (161,092.27) (161,092.27) 0.8201 (132,111.77) Q4 0.00 (164,600.57) (164,600.57) 0.7972 (131,219.57) Q1 0.00 (168,185.27) (168,185.27) 0.7749 (130,326.76) Q2 0.00 (171,848.04) (171,848.04) 0.7533 (129,453.13) Q3 0.00 (175,590.58) (175,590.58) 0.7322 (128,567.42) Q4 0.00 (179,414.62) (179,414.62) 0.7118 (127,707.33) Q1 2,004,502.50 (5,141,743.07) (3,137,240.57) 0.6919 (2,170,656.75) Q2 1,879,435.25 (2,612,787.04) (733,351.79) 0.6726 (493,252.42) Q3 3,746,633.00 (2,946,994.44) 799,638.56 0.6538 522,803.69 Q4 7,565,379.09 (5,334,687.07) 2,230,692.02 0.6355 1,417,604.78 Q1 7,085,335.06 (3,978,818.55) 3,106,516.51 0.6178 1,919,205.90 Q2 7,957,934.07 (2,907,197.42) 5,050,736.65 0.6005 3,032,967.36 Q3 5,559,796.07 (2,711,121.72) 2,848,674.35 0.5837 1,662,771.22 Q4 17,963,135.35 (8,977,728.34) 8,985,407.01 0.5674 5,098,319.94 Q1 165,837.25 (770,298.75) (604,461.50) 0.5516 (333,420.97) Q2 0.00 0.00 0.00 0.5362 0.00 Q3 1,448,552.88 0.00 1,448,552.88 0.5212 754,985.76 Q4 0.00 0.00 0.00 0.5066 0.00 Q1 0.00 0.00 0.00 0.4925 0.00 Q2 0.00 (513,532.50) (513,532.50) 0.4787 (245,828.01) Q3 0.00 0.00 0.00 0.4653 0.00 Q4 1,448,552.88 0.00 1,448,552.88 0.4523 655,180.47 63,325,093.39 (44,550,784.91) 18,774,308.48 9,997,957.95 2016 Total Cash Flow Quarter Cash Outflow (RM) Net Cash Flow (RM) 2013 2012 2015 2014 NPV (RM)Cash In Flow (RM)Year 2011 2010
  • 22. 4.1 Comment on the viability of the project The NPV of this particular project was calculated as RM 9,997,957.95, which is a positive value. This shows that there is a better return in the future with the investor paying less than what the development is worth. Hence, the project is considered viable. 21
  • 23. 5.0 Cash Flow based on a ‘Build-then-Sell’ Concept The Build Then Sell (BTS) concept is a new concept introduced by the Government in the year 2007 where housing developers have to complete a housing project before selling houses to buyers. This is different from the current conventional concept of Sell then Build (STB). Although developers are encouraged to adopt the BTS concept, they have the option to continue with the conventional STB method. But what are the differences do they have on cash flow between these 2 different concepts? Only big players in the development industry can afford to use a BTS concept due to the significant amount of capital required to build the entire project without any financial aid from the consumers. Therefore, BTS cannot be applied to large scaled project to lower the risk of abandonment of project in case it does not sell. It will require huge shareholders’ funds and capital commitment if a housing developer is unable to secure bank borrowings and banks will be reluctant to finance a project under a BTS concept due to the nature of the risks involved. Previously unknown developers will stand little chance of securing any project financing. Due to the higher initial cost of funding by the employer, the BTS concept will eventually shoot up the selling price of properties which is a con for house buyers. The pros of having a BTS concept to a development cash flow is the reduction of variation works which is a better cash flow system, this is due to all units are still completely own by the developer and under their specifications. Unoike STB system, at some point some owners will want to change materials being used in their unit to their own specifications which will then increase the amount of variation works and cash outflow to order specific materials for the owner. 22
  • 24. The BTS concept has very low cash inflow from beginning until the construction stage as compared to the STB. But the advantage of BTS is the price of the development will always be higher after completion rather than sold before construction due to the risk consumers does not have to bare and actually have a physical approach to the finished product. This gives the BTS concept to have a higher cash inflow as compared to STB but only can receive its inflow after the construction stage which is a huge risk the developers have to take. 23
  • 25. Reference Online, T. S. (2015, October 18). Build then sell. Retrieved November 16, 2018, from https://www.thestar.com.my/news/nation/2007/04/14/build-then-sell/ Posted on April 5, 2013 | 3803 views | Topic : Featured, Property News. (n.d.). Fine-tuning the "build-then-sell" concept. Retrieved November 16, 2018, from http://www.starproperty.my/index.php/articles/property-news/fine-tuning-buil d-then-sell-concept/ Property development not ready for build-then-sell concept. (n.d.). Retrieved November 16, 2018, from https://www.edgeprop.my/content/property-development-not-ready-build-then -sell-concept Tong, D. A. (2015, October 12). Taking a closer look at the build-then-sell concept. Retrieved November 16, 2018, from https://www.thestar.com.my/business/business-news/2012/02/11/taking-a-clos er-look-at-the-buildthensell-concept/ What has happened to 'Build Then Sell' concept, asks HBA. (2016, October 21). Retrieved November 16, 2018, from https://www.freemalaysiatoday.com/category/nation/2016/10/21/what-has-hap pened-to-build-then-sell-concept-asks-hba/ 24
  • 26. Appendix DEVELOPMENT ECONOMICS ASSIGNMENT MEETING 1 DATE : 24 October 2018 (Wednesday) TIME : 3.00pm – 4.00pm LOCATION : D8.06 ATTENDEES : 1. PANG KAI YUN 2. EVON WEE YEE JING 3. LEE ZHI XIN 4. LIM KAR YAN 5. SAM WEI YIN 6. SANDRABROOKE GOH 7. TERENCE TAN PENG ONG 8. WONG DE-VIN DISCUSSION : 1. Pang Kai Yun is selected as the group leader. 2. Job is assigned equally among the group members as shown below: Task Name Deadline Question 1 LIM KAR YAN 31 October 2018 (Wednesday) Question 2 SAM WEI YIN SANDRABROOKE GOH PANG KAI YUN 2 November 2018 (Friday) Question 3 EVON WEE YEE JING LEE ZHI XIN TERENCE TAN PENG ONG WONG DE-VIN 9 November 2018 (Friday) Question 4 LIM KAR YAN 14 November 2018 (Wednesday) Question 5 - 16 November 2018 (Friday) 3. Question 4 will start after Question 3 is done. 4. Question 5 will be assigned after Question 2 and 3 is done. 5. Next meeting will be held on 31 October 2018 (Wednesday). Time and location to be confirmed.
  • 27. DEVELOPMENT ECONOMICS ASSIGNMENT MEETING 2 DATE : 2 November 2018 (Tuesday) TIME : 10.30am – 11.30am LOCATION : C7.04 ATTENDEES : 1. PANG KAI YUN 2. EVON WEE YEE JING 3. LEE ZHI XIN 4. LIM KAR YAN 5. SAM WEI YIN 6. SANDRABROOKE GOH 7. TERENCE TAN PENG ONG 8. WONG DE-VIN DISCUSSION : 1. Question 1 is completed by LIM KAR YAN. 2. Question 2 is completed by SAM WEI YIN and SANDRABROOKE GOH. 3. Question 3 is still on going. 4. Question 4 will start after Question 3 is done. The NPV table is done. 5. Question 5 will be done by PANG KAI YUN. 6. Next meeting will be held on 14 November 2018 (Wednesday). Time and location to be confirmed.
  • 28. DEVELOPMENT ECONOMICS ASSIGNMENT MEETING 3 DATE : 15 November 2018 (Thursday) TIME : 11.00am – 11.30am LOCATION : C7.02 ATTENDEES : 1. PANG KAI YUN 2. EVON WEE YEE JING 3. LEE ZHI XIN 4. LIM KAR YAN 5. SAM WEI YIN 6. SANDRABROOKE GOH 7. TERENCE TAN PENG ONG 8. WONG DE-VIN DISCUSSION : 1. Question 5 will be done by WONG DE-VIN. 2. Revised on the job assigned as shown below: Task Name Progress Question 1 LIM KAR YAN Done Question 2 SAM WEI YIN SANDRABROOKE GOH Done Question 3: i) Cash Inflow ii) Cash Outflow iii) Quarter-Yearly LEE ZHI XIN TERENCE TAN PENG ONG EVON WEE YEE JING On-going Done On-going Question 4 LIM KAR YAN Table is done Question 5 WONG DE-VIN On-going Minutes of meeting, checking & formatting PANG KAI YUN On-going 3. List down all the question that want to clarify with Ms Tay and Pn Nurul.
  • 29. DEVELOPMENT ECONOMICS ASSIGNMENT MEETING 4 DATE : 23 November 2018 (Friday) TIME : 10.30am – 11.30am LOCATION : C7.02 ATTENDEES : 1. PANG KAI YUN, 2. EVON WEE YEE JING 3. LEE ZHI XIN 4. LIM KAR YAN 5. SAM WEI YIN 6. SANDRABROOKE GOH 7. TERENCE TAN PENG ONG 8. WONG DE-VIN DISCUSSION : 1. Check all the answer and format. 2. Progress of the assignment is shown as below: Task Name Progress Question 1 LIM KAR YAN Done Question 2 SAM WEI YIN SANDRABROOKE GOH Done Question 3: i) Cash Inflow ii) Cash Outflow iii) Quarter-Yearly LEE ZHI XIN TERENCE TAN PENG ONG EVON WEE YEE JING Done Done Done Question 4 LIM KAR YAN Done Question 5 WONG DE-VIN Done Minutes of meeting, checking & formatting PANG KAI YUN On-going