![❖ Plastic Bags
❖ Calipers or Rulers
❖ Portable hanging scale
❖ Rakes: 4 count
❖ Field Guides
❖ Data sheet
Quadrat Method
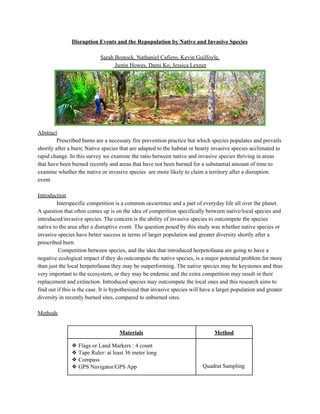
To test the hypothesis that after the disturbance caused by controlled burns areas are more quickly
repopulated by invasive species compared to native species, sample sites chosen were located in the Econ
River Wilderness Area, a nature preserve, located in Oviedo, FL, that contains sections of pine flatwoods
that are occasionally subjected to controlled burns to prevent forest fires. Two types of locations in the
Econ River Wilderness Area were chosen, one that has not been recently subjected to a controlled burn to
obtain a control sample and an area which was recently subjected to a controlled burn to find how many
native vs non-native were present in each [Figure-5]. Three different quadrats were searched exhaustively
in each area type of area.
Once an appropriate area was found, an 8 m by 8 m square quadrat was set up in areas with
different terrain that may house herpetofauna such as leaf litter, trees, fallen trees, and palmettos . When
starting off the quadrat a compass was used to guide the tape ruler to form the sides [Figure-1] . After the
area for a quadrat was chosen the area was then measured and wrapped using measuring tape, corners
were marked with flags, and a 4 person team searched 1 meter along the edge of the square in a clockwise
fashion with rakes to search under leaf litter until the end of the square was reached [Figure-2]. At the end
of each 1 meter section, each person moved inward to the next 1 meter line following the edge of the
quadrat at the same pace until the center was reached [Figure-3] and [Figure-4]. Two people remained
outside the quadrat to collect data and aid in identification when species were located. The materials
required for data collection include measuring tape to measure the quadrat, flags to mark the corners of
the quadrat, a compass to keep the lines straight, a GPS enabled device to mark the location, a key and a
field guide to identify species, and data sheets to collect information.
Once herpetofauna were captured, they were identified to species, recorded, and then released.
Identification took place using Conant, R., and J. T. Collins. 1998. Field Guide to Reptiles and
Amphibians: Eastern and Central North America (Peterson Field Guide), revised edition. Houghton
Mifflin Company, U. S. A and Audubon Reptiles and Amphibians: A Field Guide to North American
Reptiles and Amphibians App. Color, size, shape, number of appendages, and location found all aided in
the identification process.
Once the herpetofauna were captured, identified and released, the species was defined as a native
(N) or a non-native (I) species. The number of native species (N) and the number of non-native species
(I) found in both types of areas were then compared to test the hypothesis.
[Figure- 1]](data:image/gif;base64,R0lGODlhAQABAIAAAAAAAP///yH5BAEAAAAALAAAAAABAAEAAAIBRAA7)
Recomendados
Mais conteúdo relacionado
Destaque
Semelhante a ResearchPaper
Semelhante a ResearchPaper (20)
ResearchPaper
- 1. Disruption Events and the Repopulation by Native and Invasive Species Sarah Bostock, Nathaniel Cafiero, Kevin Guilfoyle, Justin Howes, Dami Ko, Jessica Lexner Abstract Prescribed burns are a necessary fire prevention practice but which species populates and prevails shortly after a burn; Native species that are adapted to the habitat or hearty invasive species acclimated to rapid change. In this survey we examine the ratio between native and invasive species thriving in areas that have been burned recently and areas that have not been burned for a substantial amount of time to examine whether the native or invasive species are more likely to claim a territory after a disruption event. Introduction Interspecific competition is a common occurrence and a part of everyday life all over the planet. A question that often comes up is on the idea of competition specifically between native/local species and introduced/invasive species. The concern is the ability of invasive species to outcompete the species native to the area after a disruptive event. The question posed by this study was whether native species or invasive species have better success in terms of larger population and greater diversity shortly after a prescribed burn. Competition between species, and the idea that introduced herpetofauna are going to have a negative ecological impact if they do outcompete the native species, is a major potential problem for more than just the local herpetofauna they may be outperforming. The native species may be keystones and thus very important to the ecosystem, or they may be endemic and the extra competition may result in their replacement and extinction. Introduced species may outcompete the local ones and this research aims to find out if this is the case. It is hypothesized that invasive species will have a larger population and greater diversity in recently burned sites, compared to unburned sites. Methods Materials Method ❖ Flags or Land Markers : 4 count ❖ Tape Ruler: at least 36 meter long ❖ Compass ❖ GPS Navigator/GPS App Quadrat Sampling
- 2. ❖ Plastic Bags ❖ Calipers or Rulers ❖ Portable hanging scale ❖ Rakes: 4 count ❖ Field Guides ❖ Data sheet Quadrat Method To test the hypothesis that after the disturbance caused by controlled burns areas are more quickly repopulated by invasive species compared to native species, sample sites chosen were located in the Econ River Wilderness Area, a nature preserve, located in Oviedo, FL, that contains sections of pine flatwoods that are occasionally subjected to controlled burns to prevent forest fires. Two types of locations in the Econ River Wilderness Area were chosen, one that has not been recently subjected to a controlled burn to obtain a control sample and an area which was recently subjected to a controlled burn to find how many native vs non-native were present in each [Figure-5]. Three different quadrats were searched exhaustively in each area type of area. Once an appropriate area was found, an 8 m by 8 m square quadrat was set up in areas with different terrain that may house herpetofauna such as leaf litter, trees, fallen trees, and palmettos . When starting off the quadrat a compass was used to guide the tape ruler to form the sides [Figure-1] . After the area for a quadrat was chosen the area was then measured and wrapped using measuring tape, corners were marked with flags, and a 4 person team searched 1 meter along the edge of the square in a clockwise fashion with rakes to search under leaf litter until the end of the square was reached [Figure-2]. At the end of each 1 meter section, each person moved inward to the next 1 meter line following the edge of the quadrat at the same pace until the center was reached [Figure-3] and [Figure-4]. Two people remained outside the quadrat to collect data and aid in identification when species were located. The materials required for data collection include measuring tape to measure the quadrat, flags to mark the corners of the quadrat, a compass to keep the lines straight, a GPS enabled device to mark the location, a key and a field guide to identify species, and data sheets to collect information. Once herpetofauna were captured, they were identified to species, recorded, and then released. Identification took place using Conant, R., and J. T. Collins. 1998. Field Guide to Reptiles and Amphibians: Eastern and Central North America (Peterson Field Guide), revised edition. Houghton Mifflin Company, U. S. A and Audubon Reptiles and Amphibians: A Field Guide to North American Reptiles and Amphibians App. Color, size, shape, number of appendages, and location found all aided in the identification process. Once the herpetofauna were captured, identified and released, the species was defined as a native (N) or a non-native (I) species. The number of native species (N) and the number of non-native species (I) found in both types of areas were then compared to test the hypothesis. [Figure- 1]
- 3. Fig 1. 8 meter by 8 meter square quadrat diagram. When starting the edges of the quadrat one member holding one end of the tape ruler and a compass (lying flat as possible) guided another member holding the other end of the tape ruler North. Once the north wall was established the compass holding member moved to the end of the tape ruler, turned east and guided the individual with the tape ruler east. The process was repeated till all four walls were built. A flag was placed at each corner.
- 4. [Figure-2] [Fig 2.a] [Fig 2.b] [Fig 2.c] Fig 2.a. A four person team was setup with one person at each corner. Each number represents an individual. Fig 2.b. Once setup each member worked along the edge of the quadrat in a clockwise manner. The width of the path remained 1 meter wide (shown by the red shaded region). Fig 2.c. The path was raked until the end of the square was reached. The participants (represented by numbers 1,2,3 and 4) have at this point reached the corner across from where they had started. [Figure-3] [Fig 3.a.] [Fig 3.b.] [Fig 3.c.] Fig 3.a. At the end of each 1 meter section each person moved inward to the inner corner of the next 1 meter line. Fig 3.b. A new sampling path is formed (shown by the blue shaded region) .Fig 3.c. Once again conforming to the quadrat’s edge, each member worked along the edge of the quadrat in a clockwise manner. The width of the path once again remained 1 meter wide.
- 5. [Figure-4] Fig 4.a. Previous steps were repeated within the new section (indicated by the green shaded region). Once again in a clockwise manner. Fig 4.b. In the final step of the quadrat sampling the four participants step in towards the center (as in previous steps) The center of the quadrat is then sampled
- 6. [Figure-5] Fig 5.a [Date: 3-2-2016] Control Sample Sites. One of the two types of locations in the Econ River Wilderness Area that was chosen, this one had not been recently subjected to a controlled burn. Our Control Sample. Random sampling was done throughout the non-burned area. Sites were chosen at 28.614192, -81.1598 (green square), 28.614561, -81.1599 (white square), and 28.614561, -81.1599 (blue square). (Google earth, 2014 )
- 7. Fig 5.b. [Date: 3-30-2016 a GPS map of selected burn sites that were recently burned at 28.617262, -81.165577 (red), 28.616737, -81.165528 (grey), 28616737, -81.165548 (yellow).(Google Maps, 2014) Results Within the 6 quadrats (3 burned and 3 unburned), 10 specimens were collected representing 5 species. In the first quadrat in th non-burned area, one organism was found, Coluber constrictor, anative species, in the second quadrat in the non-burned area one organism was found, Anolis sagrei, an invasive species, and in the third quadrat in the non-burn site, two orgasims were found, Anolis sagrei and Plestiodon inexpectatus, invasive and native respectively. In the burn site in the first quadrat three orgasisms were discorved, Osteopilus septentrionalis (invasive), Anolis sagrei (invasive) and Anolis carolinensis (native). No herpetofauna were found in the second quadrat in the burn site. In the third quadrat of the burn ste, three orgasism were found, two invasive Anolis sagrei and one native Anolis carolinensis. Due to the small sample size, legitimate statistics could not be performed. 50% of the individuals captured within unburned quadrats were native with the other 50% being non-native. Within the burned quadrats 33.3333% of the individuals captured were native whereas 66.6666% were non-native. Overall 40% of all the individuals captured were from unburned quadrats with the remaining 60% captured from burned quadrats. A chi-squared test was performed on the acquired data (figure 7). With a chi square value of 0.0000 and a p-value of 1.0000 it was determined that the deviation in the observed values from the expected were non-significant and due to randomness or chance.
- 8. Species (Total Number) Native or Non-Native Burned (Number Found) Unburned (Number Found) Coluber constrictor (1) Native 0 1 Anolis sagrei (5) Non-Native 3 2 Anolis caroliniensis (2) Native 1 1 Plestiodon inexpectatus (1) Native 0 1 Osteopilus septentrionalis (1) Non-Native 1 0 Figure 6. Data from sampling sites categorized by area (burned and unburned), Genus species, and native or non native. [Figure-7]
- 9. Figure 7. JMP was used to obtain a chi square value for the species found at burn sites and non burned sites. With a chi square value of 0.0000 and a p-value of 1.0000. This P-value anticipates that the deviation in the observed values from the expected were non-significant and due to randomness or chance. Discussion
- 10. The data appears to indicate that there is no correlation between either native or invasive species being more likely to quickly return to an area that had been recently subjected to a prescribed burn. The native species are already equipped to deal with regular burning in these types of environments, and this may have helped them to return quickly and to help compete with the invasive species which may not be used to periodic burns. This could be countered by the invasive species being more prone to quickly disseminate and assimilate to new conditions leading to a roughly equal numbers. The one way analysis of percentage of invasives by classification, which leads us to reject the hypothesis, coupled with the unusually high p-value, in which we would accept the hypothesis leads us to believe in the presence of experimental error and(or) insufficient amount of sampling. Experimental error may stem from weather differences; the sampling of the burned and unburned areas happened almost three weeks apart and the weather on the day that the burned site was sampled was much more conducive to the appearance of herpetofauna. Also since the quadrats were picked based on random sampling, quadrat two in the burn site had a large (3meter by 3 meter) fire ant mound. It is believed with fire ant mound this large, herpetofauna would stay clear of this area. Ts could explain why none were found in this quadrat. It was also a challenge to find the burn site. The small sample size made collected made it almost impossible for significant statistics and inferences to be drawn. From the data collected it would suggest there is no difference of invasive or native herpetofauna in burn areas versus non-burn areas, however, not enough data was collected to fully support or not support our hypothesis. In order to obtain more significant results much more sampling should occur in more areas. The VES method also may be more conducive than the quadrat method, given the size of the burned areas, for this study if it were to yield significant results Conclusion In conclusion, the data collected did not support our hypothesis, that recently burned areas would have a higher population and diversity of invasive species, however, based on our data we can infer that both native and invasive species re-populate a burned area at around the same rate. Based on the small amount of data collected and large area, this study should be further investigated with more sites and more quadrats to get stronger results.
- 11. Appendix - data Non-Burn Sites Date: 3-2-2016 Time Start: 1:59 pm Time End: 2:20 pm Observers: HERP MASTERS Weather: Cloud Coverage: Quadrat: # 1 ● Non-Burn Site ● 28.614192, -81.1598 ● Green square ● 80℉ ● wind: ~15mph, West ● Humidity: 47% Partly cloudy [Family] Genus species SVL (cm) Tail (cm) Mass (g) I or N [Colubridae] Coluber constrictor n/a n/a n/a N *I: Invasive; N: Native Date: 3-2-2016 Time Start: 2:37 pm Time End: 3:02 pm Observers: HERP MASTERS Weather: Cloud Coverage: Quadrat: # 2 ● Non-Burn Site ● 28.614561, -81.1599 ● White square ● 82℉ ● wind: ~16mph, West ● Humidity: 49% Mostly cloudy [Family] Genus species SVL (cm) Tail (cm) Mass (g) I or N [Dactyloidae] Anolis sagrei n/a n/a n/a I *I: Invasive; N: Native Date: 3-2-2016 Time Start: 3:15 pm Time End: 3:44 pm Observers: HERP MASTERS Weather: Cloud Coverage: Quadrat: # 3 ● Non-Burn Site ● 28.614561, -81.1599 ● Blue square ● 80℉ ● wind: ~17mph, West ● Humidity: 47% Mostly cloudy [Family] Genus species SVL (cm) Tail (cm) Mass (g) I or N [Dactyloidae] Anolis sagrei n/a n/a n/a I [Scincidae]Plestiodon inexpectatus n/a n/a n/a N *I: Invasive; N: Native
- 12. Burn Sites Date: 3-30-2016 Time Start: 1:49 pm Time End: 2:00 pm Observers: HERP MASTERS Weather: Cloud Coverage: Quadrat: # 1 ● Burn Site ● 28.616097, -81.165348 ● 79℉ ● wind: ~ 18.4 mph NE ● Humidity: 63% Partly cloudy [Family] Genus species SVL (cm) Tail (cm) Mass (g) I or N [Hylidae] Osteopilus septentrionalis n/a n/a n/a I [Dactyloidae] Anolis carolinensis n/a n/a n/a N [Dactyloidae] Anolis sagrei n/a n/a n/a I *I: Invasive; N: Native Date: 3-30-2016 Time Start: 2:06 pm Time End: 2:14 pm Observers: HERP MASTERS Weather: Cloud Coverage: Quadrat: # 2 ● Burn Site ● 28.617262, -81.165577 ● 80℉ ● wind: ~ 18.4 mph NE ● Humidity: 54% Scattered clouds [Family] Genus species SVL (cm) Tail (cm) Mass (g) I or N None Date: 3-30-2016 Time Start: 2:28 pm Time End: 2:37 pm Observers: HERP MASTERS Weather: Cloud Coverage: Quadrat: # 3 ● Burn Site ● 28.616737, -81.165528 ● 80℉ ● wind: ~15mph, West ● Humidity: 48% Partly cloudy [Family] Genus species SVL (cm) Tail (cm) Mass (g) I or N [Dactyloidae] Anolis carolinensis n/a n/a n/a N [Dactyloidae] Anolis sagrei n/a n/a n/a I [Dactyloidae] Anolis sagrei n/a n/a n/a I
- 13. References Google earth. (2014). Fig.5.a, [Non burned sites sampled at the Econ River Wilderness Area], [map], 28.614192, -81.1598; 28.614561, -81.1599; 28.614942, -81.1598. Retrieved from https://www.google.com/earth/ Google earth. (2014). Fig.5.b, [Burned sites sampled at the Econ River Wilderness Area], [map], 28.617262, -81.165577; 28.616737, -81.165528; 28.616097, -81.165548. Retrieved from https://www.google.com/earth/