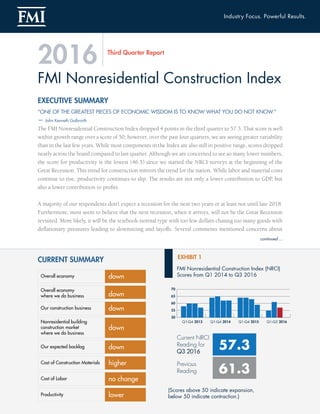
The FMI Nonresidential Construction Index dropped 4 points in the third quarter to 57.3. That score is well within growth range over a score of 50; however, over the past four quarters, we are seeing greater variability than in the last few years.
Call Girls In Nangloi Rly Metro ꧂…….95996 … 13876 Enjoy ꧂Escort
Nonresidential Construction Index Report Q3 2016
1. EXECUTIVE SUMMARY
“ONE OF THE GREATEST PIECES OF ECONOMIC WISDOM IS TO KNOW WHAT YOU DO NOT KNOW.”
— John Kenneth Galbraith
The FMI Nonresidential Construction Index dropped 4 points in the third quarter to 57.3. That score is well
within growth range over a score of 50; however, over the past four quarters, we are seeing greater variability
than in the last few years. While most components in the Index are also still in positive range, scores dropped
nearly across the board compared to last quarter. Although we are concerned to see so many lower numbers,
the score for productivity is the lowest (46.5) since we started the NRCI surveys at the beginning of the
Great Recession. This trend for construction mirrors the trend for the nation. While labor and material costs
continue to rise, productivity continues to slip. The results are not only a lower contribution to GDP, but
also a lower contribution to profits.
A majority of our respondents don’t expect a recession for the next two years or at least not until late 2018.
Furthermore, most seem to believe that the next recession, when it arrives, will not be the Great Recession
revisited. More likely, it will be the textbook-normal type with too few dollars chasing too many goods with
deflationary pressures leading to downsizing and layoffs. Several comments mentioned concerns about
FMI Nonresidential Construction Index
Third Quarter Report
2016
CURRENT SUMMARY
(Scores above 50 indicate expansion,
below 50 indicate contraction.)
continued ...
downOverall economy
Overall economy
where we do business
Our construction business
Nonresidential building
construction market
where we do business
Our expected backlog
Cost of Construction Materials higher
Cost of Labor no change
Productivity lower
down
down
down
down
EXHIBIT 1
2. FMI Nonresidential Construction Index
2
Executive Summary
markets that are beginning to be overbuilt in this latest expansion. However, as one respondent describes,
there are still many things we do not know:
Uncertainty is a word that a lot of people are using to describe our world today. Uncertainty
of: the current election and politics in general, Brexit, monetary policy, the longest bull-market
in history, the length of the current economic expansion, the total debt and deficit spending,
etc. The one thing that is certain is that we will eventually have a recession, and I hope this
time it is shallow to the point that we are out of it before the economists even measure and
announce the two down quarters!
See more detailed responses in this report to discover what we do and do not know. There will be another
recession. That is one thing we can say with great confidence.
A special thank you to all of the
panelists who help make the NRCI
a useful gauge of nonresidential
construction activity. We value your
opinions and appreciate your taking
the time to share your experience.
3. FMI Nonresidential Construction Index
3
Overall Economy:
NRCI respondents’ view of the overall economy
dropped 7.3 points in the third quarter. While
this is a sharp drop from the second quarter
results, the second quarter spiked 8.9 points from
the first quarter..
Overall Economy Where Panelists
Do Business:
As with the overall economy, respondents’
optimism in the second quarter seems to have
pulled back to what we have seen in previous
quarters. Now at 60.4, this NRCI component
continues in a positive range.
Respondents’ Construction Business:
Respondents reported that their outlook for their
own business slowed somewhat this quarter,
dropping 5.1 points to 70.9. A few actually
welcome the change, since some markets have
been “overheated.”
Nonresidential Building Construction
Market Where Panelists Do Business:
At 67.3, the nonresidential market that
respondents work in is still registering high on
the component scale, but 7.0 points lower than
last quarter.
NRCI Third Quarter 2016 Highlights
Expected Change in Backlog:
The Index component for expected change in
backlog dropped 7.2 points in the third quarter
to a still positive 58.9. The median backlog for all
respondents was 10 months for the third quarter,
which is a drop from the last three quarters but
on par with the past two years, where backlog
hovered between nine and 10 months.
Cost of Construction Materials and Labor:
The Index for cost of materials dropped 2.9 points,
indicating materials prices are still rising. Likewise,
the labor cost component, although unchanged
from last quarter, continues to indicate higher costs
for labor that is still scarce in many areas.
Productivity:
Productivity continues to be a big concern as
the component Index slipped to 46.5, or 5.9
points lower than last quarter. This is the lowest
score for productivity since we began publishing
the NRCI report in 2008. Likely, the drop is
mostly indicative of the continuing difficulty
of finding skilled employees in a tight market;
however, there are many other reasons for loss of
productivity.
4. FMI Nonresidential Construction Index
4
EXHIBIT 2
(Scores higher than 50 indicate expansion, below 50 indicate contraction.)
Predicting the recession:
We asked respondents to give their estimated opinion about when they think the next recession will begin,
particularly as concerns the construction industry. Overall, 78% didn’t expect a recession until at least the
first half of 2018, and 38% of those respondents don’t expect a recession for at least two years.
Predicting continued growth during the current expansion:
Most people expect a recession sometime, given the cyclical nature of construction and the economy in
general, so we asked what kind of growth in construction to expect until the “inevitable” recession occurs.
Thirty-five percent of respondents expect 1 to 2% growth (CAGR) during the remaining expansionary period,
while 32% expect 3 to 4% growth.
Current Issues
NRCIScore
0
10
20
30
40
50
60
70
Q1-Q4
2011
Q1-Q4
2012
Q1-Q4
2013
Q1-Q4
2014
Q1-Q4
2015
Q1-Q3
2016
57.3
Current NRCI
Reading for
Q3 2016
57.3
Previous
Reading 61.3
FMI Nonresidential Construction Index (NRCI)
Scores | Q1 2011 to Q3 2016
5. FMI Nonresidential Construction Index
5
Predicting the Recession:
Predicting the next economic recession has long been
a cottage industry in economic reporting. These days
it seems to be a growing concern with many online
pundits sending out dire warnings, hoping that you will
buy something they are selling or gain fame and credit
for being the one lone wolf who successfully predicted
economic demise. The noise in the media tends to crowd
out the level-headed economists genuinely attempting to
calculate the ongoing chances for growth or recession.
For the purpose of our questions on predicting the next
recession, we used the standard applied by the National
Bureau of Economic Research (NBER):
A recession is a period between a peak and a trough, and an expansion is a period between
a trough and a peak. During a recession, a significant decline in economic activity spreads
across the economy and can last from a few months to more than a year. Similarly, during an
expansion, economic activity rises substantially, spreads across the economy and usually lasts
for several years.
In addition to the formal definition of a recession, we asked respondents to focus their responses on the
potential for the recession to affect the construction industry. Seventy-eight percent do not expect a recession
until at least the first half of 2018, and 38% of those responding do not expect a recession for at least two years
(Exhibit 2). Since the responses to this question are based on reasoned opinions and experience, we further
handicapped the results by asking respondents to estimate the certainty of their responses. Although most
responses clustered around the 50/50 level, the longer-term predictions were also the stronger predictions
according to respondents’ degree of certainty—where 10 equals the highest degree of certainty. (There were
no 10s.)
For the first quarter NRCI report, we asked respondents to estimate construction put in place for 2016. To
provide a counterpoint to the recession predictions above, we asked respondents what growth level they
expected for the design and construction industry during the current expansion. Although the questions
are not directly compatible, the answers were similar. Thirty-five percent of respondents expect 1% to
2% growth during the remaining expansionary period, while 32% expect 3% to 4% growth until the next
recession occurs. (In the first quarter, 31% expected construction for 2016 to grow between 0.5% and 5%.
Thirty-nine percent expected growth from 2.6% to 5.0%.)
Current Issues
6. FMI Nonresidential Construction Index
6
We also asked executives responding to our survey this quarter what they thought might be the top-three
reasons or causes. We have depicted those responses in a “word cloud” graphic format to indicate the number
of mentions of key words. Although not a highly scientific representation of the data, the graphic shows the
larger concerns are not only economic, but also political and global. The economy is, of course, the focus
here, and the large print for the economy includes several comments concerning the business cycle and the
feeling that “we are due” or overdue for a recession. The presidential race, uncertainty and even low confidence
levels in the government’s ability to help prevent a severe recession are also big concerns. Falling demand
in the face of overbuilding in some markets is a concern also reflected in the open-ended responses below
(Exhibit 5). In the open-ended responses, we can get the sense that this isn’t the first time NRCI industry
executives thought about these issues and when the recession might hit. There is uncertainty behind many
responses, but most seem to agree (or hope) that the next recession might be more of the “normal” type
with no major bubble bursting like the securities markets or residential markets as in the beginning of the
Great Recession. There are some who not only feel we are due for a correction, but also think it might be a
necessary change from some of the overheated markets faced today.
Word Cloud: Key word responses for reasons and causes of the next
recession. (Font size represents number of mentions.)
EXHIBIT 3
7. FMI Nonresidential Construction Index
7
What is your best estimate of when a recession will next affect the
economy, specifically the design and construction industry?
EXHIBIT 4
How do you expect the design and construction industry to perform
during the expansion period from now up to the next recession?
(CAGR, Compound Annual Growth Rate)
EXHIBIT 5
8. FMI Nonresidential Construction Index
8
Selected comments on the chance and causes of potential recession or
expansion for the construction economy:
EXHIBIT 6
ƒƒ 75% overbuilding and rising labor and
material costs.
ƒƒ Costs increases are spotty, so overall, not sure
what heavy increases there might be. There
are many needs such as infrastructure, flat
office building market, education reform,
bigger than normal cultural changes that
increase the obsolescence of old buildings,
thus new buildings are required. Our
dominant market, Memphis, is growing with
an energy like never before, and that creates
construction potential.
ƒƒ Election results could cripple the U.S.
economy for further growth. Too many
entitlement promises would further
shift spending to programs that do not
improve infrastructure or entice business
development. States will not be able to
support themselves, thus no incentives for
business.
ƒƒ Everything always comes to an end. The
economy is on an eight-year uptick since
the start of the Great Recession and typically
runs max out at eight years. This one will
probably run a little longer because of
interest rates being kept so low for so long.
Everything is cyclical.
ƒƒ Expansion because indicators still show
increased need and demand. People
resources are hindering growth.
ƒƒ Flight to safety in the U.S.A., which should
lead to increased investment in buildings and
infrastructure.
ƒƒ I think we will continue to see steady growth
in our industry. There may be some bumps
in the road, but I do not believe there will be
anything like what happened in 2008.
ƒƒ If the rising cost of construction continues,
owners are going to begin shelving projects
until the cost comes back down. We are
already seeing this happen in the Miami
(South Florida) market with condos. We
will also face a slowdown with the general
election this year. If another democratic
president gets elected, the construction
industry will suffer.
ƒƒ In our markets, the engineering and
architectural firms are reporting to be very
busy. We will be very busy for at least two
years after they slow down.
ƒƒ Industry is currently building too much to
sustain the level of activity. We are over-
building some segments of the market due to
low cost of money. And with the rising cost
of construction due to the amount of work
in the pipeline and scarcity of labor, some
projects no longer pencil.
ƒƒ Instability overseas. Either a crash in the
Japanese yen or the failure of a major bank in
Europe.
ƒƒ It will not be another financial meltdown.
It will be something geopolitical if there is
a big recession. The next recession will be
a market correction where developers have
overbuilt an area of the market, and the
market does not sustain the demand. It will
be a more typical recession.
ƒƒ Locally, we see many apartments, hospitals
and breweries springing up and expanding.
Housing sales just exceeded pre-recession
levels. There are state and local bonds for
schools. We are in a boom for another year
or two (it took almost two years for the
recession to hit us locally, and then it hit
hard). It looks like a very similar boom/bust
9. FMI Nonresidential Construction Index
9
cycle, and I have no confidence that either
presidential candidate will be good for the
economy long term.
ƒƒ No recession in sight. There always is a
slowdown but for different reasons. The
world climate is unsettling, but we have not
been able to identify a specific cause for the
next downturn,
ƒƒ Overbuilding of multifamily and health care.
Stress of the coal, oil and gas industry.
ƒƒ Overbuilding is a significant risk, particularly
in multifamily.
ƒƒ Prodigious talent loss at the bottom of the
last trough has not and will not be replaced
in a stagnant (less than 2%) growth economy.
This is a problem for the design, construction
and civil authorities’ fields and will persist
until the replacement employees gain
experience. Further, the people who enter
the industry at this time are not same caliber
as we saw in earlier expansions, which will
exacerbate the talent drain. Technology
leaps are being implemented in an industry
that has traditionally skimped on training,
utilizing on-the-job experience as a substitute
for instruction. Increasing labor costs will be
combined with diminished productivity.
ƒƒ Slight expansion because of pent-up demand
and low interest rates.
ƒƒ Some geopolitical event that cannot be
predicted.
ƒƒ The Bay Area office market is strong but
declining to the zero side (net leases) with
20% sublease space vacancy competing with
normal office turnover and another 3 million
to 4 million feet of new site space coming
on market within 12-18 months. Classic
oversupply dynamics forming, coupled
with overvalued, pre-IPO tech firms that
are having their funding cut or reduced will
lead to headcount layoffs. In addition, lack
of sales growth for large firms, along with
the dollar costing them money outside the
U.S., leads to M&As to grow and layoffs to
show profits. We have seen RFP requests
downtrend for six months to what would
appear to be normalized levels, but, in fact,
they continue to downtrend monthly and
quarterly. For now, it all looks like a normal
10. FMI Nonresidential Construction Index
10
cycle downturn recession of 10-30%, but
if credit markets begin to show pain in the
form of defaults on corporate bond debt
or commercial real estate defaults due to
valuation adjustments, look out; 2018-
2020 could be really bad. For now, we see
a mid-2017 normal recession call lasting
two to three years as supply versus demand
normalizes.
ƒƒ The November presidential election results
will impact the overall national economy. If
a Republican wins the election, I expect that
the economy will expand. If a Democrat wins
the election, I expect that the economy will
grow at a slower pace and may turn toward
recession.
ƒƒ Uncertainty is a word that a lot of people
are using to describe our world today.
Uncertainty of: the current election and
politics in general, Brexit, monetary policy,
the longest bull market in history, the length
of the current economic expansion, the total
debt and deficit spending, etc. The one thing
that is certain is that we will eventually have
a recession, and I hope this time it is shallow
to the point that we are out of it before the
economists even measure and announce the
two down quarters!
ƒƒ We are anticipating a mild to moderate
recession within the design and construction
industry in late 2019. Expecting to see signs
at the consumer retail level of the economy
to appear in late 2018, which will be an
early indicator of recession of nonresidential
construction approximately 12 months
following a slowdown in early indicator
industries, such as retail, housing and
automobiles. The next recession will likely
be induced by government policy. As the
economy improves globally in 2017, interest
rates (should) rise. As interest rates rise,
governments will be forced to face looming
deficits and aging population demographics.
Europe, Japan and North America are
included in this situation. Belt tightening in
the form of reduced government spending
stimulus or increased taxation will cause
headwinds for global GDP, pushing us into
our next recession, which we are expecting
should be mild to moderate, as we find our
way forward.
ƒƒ We believe there is no long-term confidence
in the industrial market clients. They will
plan or budget a project but don’t have
a definite schedule. When they choose
to do a project, it starts immediately, and
they compress the schedule. They are in a
reactionary mode.
ƒƒ We don’t have the capacity to expand as an
industry. A recession would help us catch our
breath and function more normally than we
are now. We are keeping an unsustainable
pace now. Let’s slow it down for all our sakes.
ƒƒ We need a change in Washington to get our
economy to grow. Not sure Republicans in
the House can get organized and work with
the Senate to get something done. Just not
optimistic about our federal government.
ƒƒ We need to get back to a normal economy
with slightly higher interest rates so banks
can become more profitable and not
so conservative when lending to small
businesses.
ƒƒ What goes up must come down. By the time
we have the next significant recession, it might
be about 10 years from the beginning of the
Great Recession. The Bay Area is white-hot
and has been for the past year, will be for
the next year (I hope), so I expect a drop off
sometime in 2018 due to all the above.
ƒƒ Who controls the federal government?
11. FMI Nonresidential Construction Index
11
* A note on the use of the diffusion index: Do not interpret diffusion index values in the same manner as averages,
because a simple increase or decrease in a diffusion index does not necessarily imply an improving or declining result. For
example, if a diffusion index moves from 31 last quarter to 35 this quarter, it does not imply the market has improved.
A reading above 50 indicates improving or expansion, 50 indicates remaining the same, and below 50 indicates worse or
contracting. Therefore, if a reading goes from 31 to 35, then the result still implies a decline from the previous quarter
because 35 is below 50; but the decline is not as great as the previous decline because 35 is above 31. As another
example, if the diffusion index changes from 31 to 65, it implies improvement over the previous quarter, not because
65 is above 31, but because 65 is above 50.
NRCI Scores
> 50 indicates growth (better)
< 50 indicates slowing (worse)
FMI Nonresidential Construction Index Detailed Results by Market Sector
EXHIBIT 7
NRCI Component
Results Q2 2016
NRCI Component
Results Q3 2016
Improving
over last
quarter
Remains the
same as last
quarter
Worse
compared with
last quarter
Improving over
last quarter
Remains the
same as last
quarter
Worse compared
with last quarter
Commercial 45.3% 53.8% 0.9% 72.2 44.9% 51.7% 3.4% 70.8
Education 40.0% 53.0% 7.0% 66.5 35.4% 53.5% 11.1% 62.1
Health care 41.9% 52.1% 6.0% 67.9 37.1% 53.3% 9.5% 63.8
Lodging 44.9% 53.1% 2.0% 71.4 44.6% 47.3% 8.1% 68.2
Manufacturing 24.1% 69.0% 6.9% 58.6 36.5% 52.7% 10.8% 62.8
Office 33.1% 64.5% 2.4% 65.3 25.0% 69.6% 5.4% 59.8
Other 41.7% 58.3% 0.0% 70.8 52.4% 33.3% 14.3% 69.0
Commercial 37.1% 56.2% 6.7% 65.2 44.9% 48.3% 6.7% 69.1
Education 39.5% 50.0% 10.5% 64.5 33.3% 54.5% 12.1% 60.6
Health care 52.6% 38.8% 8.6% 72.0 43.8% 46.7% 9.5% 67.1
Lodging 34.4% 54.2% 11.5% 61.5 29.3% 57.3% 13.3% 58.0
Manufacturing 29.5% 62.5% 8.0% 60.8 37.0% 50.7% 12.3% 62.3
Office 33.3% 58.5% 8.1% 62.6 25.9% 58.0% 16.1% 54.9
Other 50.0% 47.2% 2.8% 73.6 54.5% 40.9% 4.5% 75.0
Commercial 19.6% 52.0% 28.4% 45.6 29.1% 34.9% 36.0% 46.5
Education 35.1% 38.7% 26.1% 54.5 27.6% 51.0% 21.4% 53.1
Health care 41.7% 45.2% 13.0% 64.3 41.7% 41.7% 16.5% 62.6
Lodging 21.1% 45.3% 33.7% 43.7 17.3% 36.0% 46.7% 35.3
Manufacturing 28.7% 48.3% 23.0% 52.9 33.3% 36.1% 30.6% 51.4
Office 17.6% 53.8% 28.6% 44.5 16.1% 48.2% 35.7% 40.2
Other 32.4% 50.0% 17.6% 57.4 31.8% 54.5% 13.6% 59.1
Business Outlook - One Year
Business Outlook - Three Years
Business Outlook
Three Months
Business Outlook
Three Months
Business Outlook - One Year
Business Outlook - Three Years
Overall Second Quarter 2016 Overall Third Quarter 2016
12. FMI Nonresidential Construction Index
12
Note: NRCI scores and component scores are based on a diffusion index where scores above 50 represent improving or expanding, a score of 50 represents remaining the
same, and a score below 50 represents worse than last quarter or contraction.
EXHIBIT 9
Size of the
Organization in
Annual Revenue
NRCI Component Indexes — Comparisons of Results: Q4 2015 to Q3 2016
EXHIBIT 8
NRCI components
Q4 2015
NRCI components
Q1 2016
NRCI components
Q2 2016
NRCI components
Q3 2016
The overall economy 58.3 56.5 65.4 58.1
The overall economy where panelists do business 64.8 57.3 69.9 60.4
Panelists' construction businesses 69.9 64.1 76.0 70.9
Nonresidential building construction market where panelists do business 65.3 60.6 74.3 67.3
Cost of construction materials 30.6 38.1 25.2 22.3
Cost of labor 18.9 18.8 12.0 12.0
Productivity 47.9 49.1 52.4 46.5
Expected change in backlog 62.2 59.7 66.1 58.9
Median Median Median Median
Approximate current signed backlog in months 12.0 11.0 11.0 10.0
$201M to $1B
27%
Greater than $1B
8%
$50M or Less
23%
$51M to $200M
42%
13. FMI Nonresidential Construction Index
13
Commercial
General Building
Contractor
43%
Roofing
0%
Painting
1%
Masonry
2% Concrete
2%
Electrical
2%
Other
11%
Mechanical/HVAC
12%
Construction Manager
16%
EXHIBIT 10
Type of
Contracting
Business
EXHIBIT 11
Primary Region in
Which Panelists
Work
South
34%
National
Contractors
9%
West
26%
Midwest
20%
Northeast
11%
14. FMI Nonresidential Construction Index
14
* A note on the use of the diffusion index: Do not interpret diffusion index values in the same manner as averages, because a simple
increase or decrease in a diffusion index does not necessarily imply an improving or declining result. For example, if a diffusion index
moves from 31 last quarter to 35 this quarter, it does not imply the market has improved. A reading above 50 indicates improving or
expansion, 50 indicates remaining the same, and below 50 indicates worse or contracting. Therefore, if a reading goes from 31 to 35,
then the result still implies a decline from the previous quarter because 35 is below 50; but the decline is not as great as the previous
decline because 35 is above 31. As another example, if the diffusion index changes from 31 to 65, it implies improvement over the
previous quarter, not because 65 is above 31, but because 65 is above 50.
FMI Nonresidential Construction Index (NRCI) Component Results Q2 2016 to Q3 2016
EXHIBIT 12
NRCI Scores
> 50 indicates growth (better)
< 50 indicates slowing (worse)
Improving over
last quarter
Staying the
same as last
quarter
Worse
compared with
last quarter
NRCI
components
Q2 2016
Improving over
last quarter
Staying the
same as last
quarter
Worse
compared with
last quarter
NRCI
components
Q3 2016
Overall Economy 31.5% 67.8% 0.7% 65.4 23.8% 68.5% 7.7% 58.1
Overall Economy Where Panelists Do
Business
40.4% 58.9% 0.7% 69.9 28.5% 63.8% 7.7% 60.4
Panelists' Construction Business 56.2% 39.7% 4.1% 76.0 49.6% 42.6% 7.8% 70.9
Nonresidential Building Construction
Market Where Panelists Do Business
50.0% 48.6% 1.4% 74.3 43.8% 46.9% 9.2% 67.3
Backlog in Months High Median Low High Median Low
Approximate Current Signed Backlog 34.0 11.0 3.0 40.0 10.0 3.0
Grow faster
than last
quarter
Stay about
the same as
last quarter
Shrink
compared to
last quarter
Grow faster
than last
quarter
Stay about
the same as
last quarter
Shrink
compared to
last quarter
Expected Change in Backlog 37.7% 56.8% 5.5% 66.1 31.0% 55.8% 13.2% 58.9
Higher than
last quarter
Same as last
quarter
Lower than
last quarter
Higher than
last quarter
Same as last
quarter
Lower than
last quarter
Cost of Construction Materials 51.0% 47.6% 1.4% 25.2 56.9% 41.5% 1.5% 22.3
Cost of Labor 76.0% 24.0% 0.0% 12.0 76.0% 24.0% 0.0% 12.0
Improving
over last
quarter
Same as last
quarter
Declining
compared to
last quarter
Improving
over last
quarter
Same as last
quarter
Declining
compared to
last quarter
Productivity 11.6% 81.5% 6.8% 52.4 6.2% 80.6% 13.2% 46.5
NRCI Component Results Q2 2016 NRCI Component Results Q3 2016
15. All individual responses to this survey will be confidential
and shared outside of FMI only in the aggregate.
All names of individuals responding to this survey will
remain confidential to FMI.
H O W T O B E C O M E A N N R C I P A N E L I S T
If you are an executive for a construction firm in nonresidential building markets and would
like to become a panelist for the “FMI Nonresidential Construction Index,” please send your
information or questions about this survey to Phil Warner at pwarner@fminet.com. The survey
is sent to panelists quarterly and should take approximately 10 minutes to complete. Panelists
will receive the full quarterly report free of charge.
CONFIDENTIALITY
ABOUT THIS REPORT
The data in this report is presented as a sampling of
construction industry executives voluntarily serving
as panelists for this survey. The responses are based
on their experience and opinions, and the analysis is
based on FMI’s interpretation of the aggregate results.
All trends are based on a limited series of data that
may or may not represent the larger population. We
must caution that major decisions should not be
made without additional investigation and research of
specific geographic and construction market segments.