More Related Content
Similar to Indianapolis JLL Employment Update December 2015 (20)
More from JLLindianapolisresearch (8)
Indianapolis JLL Employment Update December 2015
- 1. -1,800
-100
100
1,000
1,600
2,100
2,500
5,300
5,900
11,700
-4,000 -2,000 0 2,000 4,000 6,000 8,000 10,00012,00014,000
Financial Activities
Information
Mining and Logging
Other Services
Manufacturing
Government
Professional & Business Services
Educational & Health Services
Leisure & Hospitality
Trade, Transportation & Utilities
0.0%
2.0%
4.0%
6.0%
8.0%
10.0%
12.0%
0
200,000
400,000
600,000
800,000
1,000,000
1,200,000
2000 2001 2002 2003 2004 2005 2006 2007 2008 2009 2010 2011 2012 2013 2014 2015
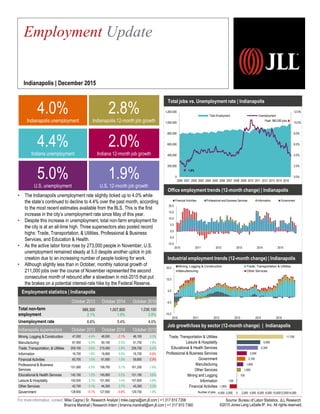
Total Employment Unemployment
Office employment trends (12-month change) | Indianapolis
Source: Bureau of Labor Statistics, JLL Research
Total jobs vs. Unemployment rate | Indianapolis
Number of jobs
• The Indianapolis unemployment rate slightly ticked up to 4.0% while
the state’s continued to decline to 4.4% over the past month, according
to the most recent estimates available from the BLS. This is the first
increase in the city’s unemployment rate since May of this year.
• Despite this increase in unemployment, total non-farm employment for
the city is at an all-time high. Three supersectors also posted record
highs: Trade, Transportation, & Utilities, Professional & Business
Services, and Education & Health.
• As the active labor force rose by 273,000 people in November, U.S.
unemployment remained steady at 5.0 despite another uptick in job
creation due to an increasing number of people looking for work.
• Although slightly less than in October, monthly national growth of
211,000 jobs over the course of November represented the second
consecutive month of rebound after a slowdown in mid-2015 that put
the brakes on a potential interest-rate hike by the Federal Reserve.
Employment Update
Metro Indianapolis | August 2015
October 2013 October 2014 October 2015
Total non-farm
employment
989,300
2.1%
1,007,800
1.9%
1,036,100
2.8%
Unemployment rate 6.6% 5.4% 4.0%
Indianapolis supersectors October 2013 October 2014 October 2015
Mining, Logging & Construction 47,000 4.4% 46,000 -2.1% 46,100 0.2%
Manufacturing 87,900 0.5% 90,100 2.5% 91,700 1.8%
Trade, Transportation, & Utilities 209,100 2.6% 215,000 2.8% 226,700 5.4%
Information 16,700 1.8% 16,800 0.6% 16,700 -0.6%
Financial Activities 60,700 1.0% 61,600 1.5% 59,800 -2.9%
Professional & Business
Services
151,000 5.0% 158,700 5.1% 161,200 1.6%
Educational & Health Services 145,100 1.2% 145,800 0.5% 151,100 3.6%
Leisure & Hospitality 100,500 2.1% 101,900 1.4% 107,800 5.8%
Other Services 42,700 3.1% 44,300 3.7% 45,300 2.3%
Government 128,600 -0.1% 127,600 -0.8% 129,700 1.6%
2.8%
Indianapolis 12-month job growth
4.4%
Indiana unemployment
2.0%
Indiana 12-month job growth
4.0%
Indianapolis unemployment
5.0%
U.S. unemployment
1.9%
U.S. 12-month job growth
Employment Update
Indianapolis | December 2015
For more information, contact: Mike Cagna | Sr. Research Analyst | mike.cagna@am.jll.com | +1 317 810 7358
Brianna Marshall | Research Intern | brianna.marshall@am.jll.com | +1 317 810 7360 ©2015 Jones Lang LaSalle IP, Inc. All rights reserved.
1.8%
Peak: 982,092 jobs
Industrial employment trends (12-month change) | Indianapolis
Job growth/loss by sector (12-month change) | Indianapolis
Employment statistics | Indianapolis
-10.0
-5.0
0.0
5.0
10.0
15.0
20.0
2010 2011 2012 2013 2014 2015
Financial Activities Professional and Business Services Information Government
-15.0
-5.0
5.0
15.0
25.0
2010 2011 2012 2013 2014 2015
Mining, Logging & Construction Trade, Transportation & Utilities
Manufacturing Other Services