Masters Dissertation Posters 2014
•
10 likes•22,663 views

Posters summarizing dissertation research projects to date, presented by MA and MSc students at the Institute for Transport Studies (ITS), University of Leeds, May 2014. on.fb.me/1oSvcMT www.its.leeds.ac.uk/courses/masters/dissertation

Recommended
Recommended
More Related Content
What's hot
What's hot (20)
Viewers also liked
Viewers also liked (19)
Similar to Masters Dissertation Posters 2014
Similar to Masters Dissertation Posters 2014 (20)
More from Institute for Transport Studies (ITS)
More from Institute for Transport Studies (ITS) (20)
Recently uploaded
Recently uploaded (20)
Masters Dissertation Posters 2014
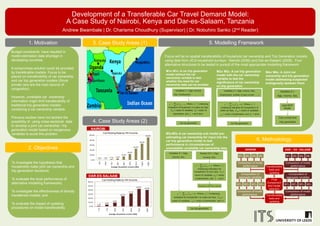
- 1. Development of a Transferable Car Travel Demand Model: A Case Study of Nairobi, Kenya and Dar-es-Salaam, Tanzania Andrew Bwambale | Dr. Charisma Choudhury (Supervisor) | Dr. Nobuhiro Sanko (2nd Reader) 1. Motivation 2. Objectives To investigate the hypothesis that households make joint car ownership and trip generation decisions; To evaluate the local performance of alternative modelling frameworks; To investigate the effectiveness of directly transferred models; and To evaluate the impact of updating procedures on model transferability. 3. Case Study Areas (1) 5. Modelling Framework 6. Methodology Focus will be on spatial transferability of household car ownership and Trip Generation models using data from JICA household surveys - Nairobi (2006) and Dar-es-Salaam (2008). Four alternative structures to be tested in pursuit of the most appropriate modelling framework. M1N/ M1D: A car trip generation model without the car ownership variable to test whether the need for car ownership data can be avoided M2N/ M2D: A car trip generation model with the car ownership variable to test the significance of car ownership on trip generation M3N/M3D A car ownership sub model pre- estimating car ownership for input into the car trip generation model to test performance in circumstances of unavailable/ unreliable car ownership data M4N/ M4D: A Joint car ownership and trip generation model addressing suspected endogeneity between them 4. Case Study Areas (2) NAIROBI DAR-ES-SALAAM 1.1% 3.9% 9.0% 24.7% 31.2% 42.6% 40.0% 0.0% 10.0% 20.0% 30.0% 40.0% 50.0% 60.0% 31.8 74.2 148.5 318.1 530.2 742.3 848.3 Average Household Income (USD) Car Holding Rate by HH Income 1.0% 1.0% 2.7% 5.2% 14.3% 24.0% 45.3% 65.3% 90.6% 0.0% 20.0% 40.0% 60.0% 80.0% 100.0% 34.0 102.0 170.1 238.1 340.1 476.2 612.2 1,020.4 1,360.5 Average Household Income (USD) Car Holding Rate by HH Income Budget constraints have resulted in model estimation data shortage in developing countries. A compromise solution could be provided by transferable models. Focus to be placed on transferability of car ownership and car trip generation models (Since private cars are the main source of congestion). However, unreliable car ownership information might limit transferability of traditional trip generation models containing a car ownership variable. Previous studies have not tackled the possibility of using cross-sectional data to develop a joint car ownership / trip generation model based on exogenous variables to avoid this problem
- 2. Perceptions of transport network flood-risk vulnerability Are we prepared enough? Aims • Identify vulnerabilities of the transport network within selected ‘flood-risk’ areas • Establish perceptions of transport network vulnerabilities in case study areas • Ascertain opportunities for improvements to existing strategies in the event of a flooding emergency Expected Findings • Identification of specific training needs in flood-risk areas, directly related to the identification of vulnerabilities in case study areas • Improvement of emergency strategies for vulnerable groups focusing on accessibility in flood-risk areas • Development of a framework for vulnerable area identification and accessibility improvements for policy perceptions of vulnerability Methodology • Undertake a comprehensive analysis of existing literature and preparation techniques for emergency response and vulnerability identification • Audit emergency response information - including training programs and response strategies to identify perceptions of vulnerability in case study areas • Analyse accessibility issues in relation to network limitations for vulnerable groups (e.g. disabled, homeless, isolated elderly people and children) and methods to improve existing strategies “more people will be at risk of coastal flooding each year” UK CEN (2014) Amy Friel MSc. Transport Planning FT Supervisor: Frances Hodgson Source: Environment Agency (2014) Background Over recent years, the rainfall and disaster situations in the UK as a result of flooding have been steadily increasing. As this risk increases, it is necessary to ensure sufficient transport sector emergency preparation for vulnerable areas and vulnerable groups. In the UK: • 5, 000, 000 people in direct risk of flooding • 1 in 6 ‘flood-risk’ properties • ~86% probability of identified areas flooding again in the next 70 years • >300,000 homes without power (Winter 2014) • Sea-levels rose to just 40cm below the Hull Tidal Surge Barrier limit (December 2013) 0 5 10 15 20 25 0 0.5 1 1.5 NumberofPropertiesLost (approx) Thousands Sea-Level Increase (metres AOD) Sea-Levels in the Humber Estuary: Potential Property Loss Key References Golpalakrishnan, C. 2013. Water and disasters: a review and analysis. International Jourlan of Water Resources Development. 29(2), pp. 250-271 Berdica, K. 2002. An introduction to road vulnerability: what has been done, is done and should be done. Transport Policy. 9. pp. 117-127 Environment Agency. 2010. River Hull Flood Risk Management Strategy Report. Halcrow Group Limited.
- 3. Understanding Choice of Departure Airport and its Rela7on to Surface Access: A Case Study of Manchester and Leeds Bradford Airports • To discover the generally accepted distance at which a passenger is not prepared to travel beyond to access a direct flight and how this varies with different journey and passenger types • To assess the role of surface access in passengers willingness to travel to a regional airport of further distance from their home airport, to access a direct flight • Upon the results of the two above objec=ves, would there be a case for the two airports to work collabora=vely. Research Ques=ons: Background Builds upon the work of Johnson, Hess and MaGhews (2014). Their study assessed whether a passenger would be more inclined to take a direct flight from an alterna=ve airport rather than an in-‐direct flight from their home airport. Concluded that irrespec=ve of improved surface access, there was a strong aversion to in-‐direct flights and the passenger would s=ll choose the alterna=ve regional airport. They would s=ll choose the alterna=ve airport if the airfare were to be increased and the access =me longer than their home airport. This study will aGempt to quan=fy the point at which passengers no longer find the promise of a direct flight enough to warrant increased access =me and cost. It will then seek to assess how improved surface access to the airports region wide, would affect passengers propensity to travel to an alterna=ve airport to access a direct flight. Would try to assess the case for strategic coopera=on of the two airports. Scope of the Study Why Manchester and Leeds? In 2010, 20.2% of Manchester Airports patronage originated from or des=na=ons were in the Yorkshire and Humber area, rising from 19.2% in 2009. Yorkshire and the Humber has not only Leeds Bradford Airport, but Doncaster and Humberside too. This would suggest that the people of Yorkshire and Humber are prepared to travel a significant distance to access the wider range of direct flights that Manchester Airport has to offer. First Trans-‐Pennine express provide services to Manchester Airport from across Yorkshire to the airport. Significant? Key References Civil Avia=on Authority. 2010. Passenger Survey Report 2010. London, Civil Avia=on Authority. Civil Avia=on Authority. 2009. Passenger Survey Report 2009. London, Civil Avia=on Authority. Johnson, D. Hess, S. MaGhews, B. 2014. Understanding Air Travellers’ Trade-‐offs Between Connec=ng Flights and Surface Access. Anna Goldie, MSc Transport Planning FT Supervisor: Bryan MaGhews Methodology Will follow stated preference survey techniques and mul=nomial logit models to assess passengers paGern of trades offs Iden=fica=on of a range of important aGributes in the decision making process such as: Air Service type – Full or Low cost Flight Type – Direct or Indirect Access Time Access Mode/s Reliability of Access Modes Price of Access Modes Approach Airports and Access providers such as Trans-‐Pennine Express (MAN) and Arrow Cars (LBA) Secure access to passengers to survey – failing this explore online surveying techniques What Next?
- 4. CONTROLLING REFLECTIVE CRACKING IN ASPHALT OVERLAYS A Pavement Deterioration Study By: Ahmad Huneidi Supervisor: Mr. David Rockliff 1. Background • Asphalt is a mixture of cement, water and aggregate. It can be used as a surface binder course on the top layer of the pavement. • Pavement layers from bottom to the top layer are sub-grade, capping layer (optional), sub-base, main base, binder course and surface course. • Asphalt cracking is a form of pavement deterioration which is mainly caused by water entering the pavement infrastructure. Other reasons can be due to weathering conditions, traffic loadings and lack of maintenance. 2. Objectives • To control reflective cracking in asphalt and to choose the best cost/effective treatments available. • Treatments to be chosen depending on the deterioration stage. Crack sealing, surface dressing, patching, inlaying and crack injection are suitable solutions. • To identify the causes of the cracking, i.e. water, thermal or traffic related. • Estimating the best time to intervene to maintain the pavement is based on engineering judgment. 3. Comparisons and Limitations • A huge part of the dissertation will focus on comparing asphalt cracking and pavement deterioration between the UK and Kuwait. Specifically to compare deterioration patterns caused by weathering conditions, as in Kuwait the temperature can go up to 50 oC during the day, and may drop 10 degrees and more during nightfall, where in the UK many types of weather can be experienced in a single day. Also, maintenance procedures in terms of asset management comparisons between Kuwait and the UK, where in Kuwait funding and budget is highly available and in the UK highway maintenance budget was cut in the past few years. • The dissertation will also argue the limitations set on highway maintenance, such as budget, as it’s recommended to intervene to fix the pavement, however sometimes it’s better not to intervene to save money. 5. Research Outcomes • Preventing asphalt cracking and on-time intervention. • Introduce a cost/effective pavement maintenance procedures • Heavily deteriorated pavements may lead to car damage and pedestrian/cycling accidents, e.g. potholes. • Identify the conditions of the highway infrastructure in Kuwait and compare it to the UK. 4. Research Methodology • The research will start off defining the asphalt mixture and its’ mechanism. • Functions of a pavement, layers and most common binding courses used. • Detailed definition of the main question. • Designing appropriate thickness with good quality materials to increase pavements’ life-expectancy. • Identify asphalt cracking reasons in Kuwait and in the UK with comparisons. • Identify pavement maintenance procedures in Kuwait and in the UK with comparisons. • Look into highway maintenance and infrastructure budget available and in terms of asset management. 6. References • J.M. Rigo, R. Degeimbre, L. Francken (2010) Reflective Cracking in Pavements: State of the Art and Design Recommendations. Oxford, UK. • L. Francken, E. Beuving, A. Molenaar (2004) Reflective Cracking in Pavements: Design and Performance of Overlay Systems. London, UK. • T. Harvey (1995) Structural Design of Asphalt Concrete Pavements to Prevent Fatigue Cracking. California, USA. • J. Baek (2010) Modelling Reflective Cracking Development in HMA Overlays. Illinois, USA. • Button & Lytton (2006) Guidelines – Synthetics in HMA Overlays. • Online references: Tensar International, Maccaferri, Adept & Institute of Asphalt Technology. • References from Kuwait: Arab Planning Institute, Department of Transport, and Ministry of Public Works.
- 5. Source :http://www.transportumum.com/jakarta and https://www.google.co.uk/maps/place/Jakarta Commuter Line TransJakarta(BRT) *Household Travel Survey (HTS), Commuter Travel Survey (CTS) Source : Nobel, et.al 2013 Jakarta Tangerang city Bekasi Depok City and Bogor City (2002) 262 (2010) 423 ↑1.6 times (2002) 247 (2010) 344 ↑1.4 times (2002) 234 (2010) 338 ↑1.4 times (unit) in 1.000 Graph modified by researcher based on Preliminary figures of JUTPI Commuter Survey In Total (2002) 743 (2010) 1105 ↑1.5 times Congestion Jakarta loss IDR 12,8 Trillion in material aspect such as time per year (finance.detik.com,2013) Stress Relation between congestion and driver stress has found in high congestion (Wickens and Wiesenthal, 2005) Pollution Jakarta’s people loss IDR 35 Trillion per year in health issues caused by pollutions (jurnas.com,2014) Transport Issues in Jakarta Trip from Outside Jakarta Per Day Strength of Car dependency in Jakarta Relationship Between Social Status and Car Use Determine derived issues such as instrumental and emotional issue Recommendation for transport policy in Jakarta Behaviour , Habit and Intention relation Based profile segmentation to see how strong car dependency is. • Gardner, 2009 • Brujin et.al, 2009 Changes of People Behaviour Based on possibilities to attract people to change their behaviour • Stradling et.al, 2000 Intention Attitude (behaviour, intention and habit) Perceive Behaviour Control Subjective Norm Data collection Using online questionnaire (purposive and snowballing sampling) Data Cleansing Validity and Reliability Check Grouping the factors Based on TPB analysis to look at driver motivation Anabel, 2005 Factor analysis Infrastructure Improvement In Public Transport, Traffic Management or supporting facilities Behaviour Approach Using ‘Push’ or ‘Pull’ approach (Stardling et.al 2000) or Smarter Choices system (Cairns et.al,2008) Driver Motivation Statistical Analysis Recommendation for Jakarta’s Transportation Behaviour Methodology Objective Background Jakarta Profile • Area 664,01 Km²* • Population 9,604,329* • Household 2,508,869* • Total road length is 7,650 6.2% of total area of the city • 17.1 million trips/day • (Source : http://www.kemendagri.go.id, BPS, UI and APRU 2010) “Is social status become a reason behind car use in Jakarta? ” Research Question • Steg, 2005, indicate that car use can be a variable to show status symbol in a group. • Hiscock et.al, 2002 identify that prestige is one of factors that influence car use in Scotland. • Shove 1998, Sheller & Urry, 2000 and Dant & Martin, 2001 mention that car gives values added to their owner on social status. Theory Planned Behaviour (TPB) is adapted from Ajzen, 1991 use to finding the sets of behavioural of human being, it will measuring people attitude (behaviour, intention and habit (Gardner, 2009)), normative and control belief. Data collection will using online questionnaire in Indonesian Language. It will distributes to people who is commuting inner and to Jakarta. Grouping the data from questionnaire based on factors analysis refers to Anabel, 2005 research, and do data cleansing by checking validity and reliability with cross tab analysis. Thus, this analysis will use SPSS to look at relationship strength between variables and finding the most affecting factor. ‘Push’ and ‘Pull’ system are psychological approach to change people behaviour by setting the policy adapted from Stradling et.al, 2000. And to strengthen the policy, smarter choice can become other option to reduce cost value. For infrastructure development will address to government budget and regulation as their function to provide better facilities for citizens. Potential Risk • Data validation unfitting with the objective and misunderstanding perception with researcher intent. And its potentially privacy question that might annoys respondent (Frederick, 2008) • Respondent resistant to answer with honest because it interfere their status symbolic (Steg ,2005) • Limitation of this research particularly find the relationship between car users in Jakarta with social status. Jakarta Maps Picture Source : google images for congestion in Jakarta Researcher : Ayu Kharizsa (ml12a28k@leeds.ac.uk), MSc, Transport Planning Supervisor : Dr. Ann Jopson (A.F.Jopson@its.leeds.ac.uk) Second Reader : Frances Hodgson (F.C.Hodgson@its.leeds.ac.uk) Mode shares by Purpose Source : Ajzen, 1991
- 6. Anastasios Leotsarakos – MSc (ENG) Transport Planning and Engineering Supervisor: Dr. Haibo Chen University of Leeds - May 2014 OBJECTIVES The aim of the project is to: Identify the main accident characteristics responsible for the formation of queues. Create a model that quantifies the effect of these characteristics. Predict the potential of a queue to be formatted and its characteristics (maximum length and duration), when an accident occurs. METHODOLOGY CASE STUDY The project investigates the case of Attiki Odos, a motorway in Athens, the capital of Greece, functioning as the Athens Ring Road, providing connection with the Athens International airport, passing through urban and rural areas. The total length of the motorway is 65 km while there are 3 lanes plus an emergency lane in each direction. In the median zone of the motorway runs the suburban railway. DATA Accident and traffic data from Attiki Odos motorway from 2007-2010. Total number of accidents: 3,321. Number of accidents actually used: 1,442. Traffic data from loop detectors in 0.5 km intervals and 5 min frequency. A total of 32 variables. VARIABLES 1 Type of day 17 Speed (km/hr) 2 Accident duration 18 Lane Volume (pcus/hr) 3 Accident type 19 Queue max length (km) 4 Collision type 20 Queue duration (min) 5 Fatalities 21 Rainfall 6 Injuries 22 Alignment 7 Number of Lanes 23 Geometry downstream 8 Left Lane 24 Geometry upstream 9 Middle Lane 25 Tunnel down 10 Right Lane 26 Interchange down 11 Emergency Lane 27 Toll down 12 Lane type 28 More than one down 13 Number of Vehicles 29 Tunnel up 14 PC 30 Interchange up 15 PTW 31 Toll up 16 TRUCK 32 More than one up BACKGROUND 50% of delays in motorways are non-recurrent (incident produced) When an accident occurs the road capacity can be reduced: a shock-wave of slow-downs is created that, propagates downstream and can result in the formation of a ‘platoon’ or queue behind. A very important factor in the development of accident management strategies is to identify and quantify the conditions affecting the nonrecurrent congestion caused by accidents once they have occurred. Identify Shockwaves Identify Queues in Shockwaves (Length and Duration) Create a Model that Calculates Queues: f(Qlength) = ... f(Qduration) = ... Attiki Odos, Airport InterchangeSchematic shockwave caused by traffic accident
- 7. • Hills and activity related issues recognised as key issue by Gatersleben & Appleton:(2007) in their cycle to work study in a hilly area of Surrey. • Figure 2 displays what they found to be key factors leading to a bad cycling experience. 24% 19% 13% 8% 36% Figure 2: Factors relating to bad cycling experiences Bad Weather/Darkness Activity related issues: hills & feeling tired Traffic issues Mechanical Other Source: Gatersleben & Appleton (2007) What are electric bikes? Electric bicycles (also known as Pedelecs and e-bikes) are bicycles which offer the rider electrical assistance when pedalling. This comes from a battery power source. Expected findings: - Technologically e-bikes are now a viable form of transport. - Lack of awareness of the benefits from the public and policymakers which is limiting the uptake of e-bikes amongst most groups. - The increased Cost of an e-bike is a key barrier to uptake, particularly for lower-income groups and those new to cycling. Industry bodies recommend >£1000 for a quality model. - Concerns which prevent people using conventional bikes will still form a barrier. These include road safety and weather (Rose 2013). Background Methodology & Data collection 1. Qualitative interviews with e-bike retailers, manufacturers and industry experts. The findings will feed into and complement the questionnaire survey. 2. Questionnaire survey of existing e-bike users and those who do not currently cycle. This will assess the impact of the technology on travel habits of existing owners and the attitudes of non- owners . 3. Analyse & Triangulate both qualitative and quantitative data to gain significance and depth of understanding. Key references consulted: Gordon, E., Xing, Y., Wang, Y., Handy, S., & Sperling, D. (2012). Can Electric 2-wheelers Play a Substantial Role in Reducing C02 Emissions?. Institute of Transportation Studies, University of California, Davis. Rose, G. (2012). E-bikes and urban transportation: emerging issues and unresolved questions. Transportation, 39(1), 81-96. Dill, J., & Rose, G. (2012). E-bikes and transportation policy: Insights from early adopters. Transportation Research Record: Journal of the Transportation Research Board, (2314), 1-6 Gatersleben, B., & Appleton, K. M. (2007). Contemplating cycling to work: Attitudes and perceptions in different stages of change. Transportation Research Part A: Policy and Practice, 41(4), 302-312. How much of a barrier are hills and intense physical activity? Where is the potential for e-bikes? It has been acknowledged that e-bikes can encourage cycling amongst: • The Elderly • Physically disadvantaged • Cyclists in hot, hilly or windy areas • Those wishing to avoid the need to change clothes (see Rose 2012 & Gorden et. al. 2012). Source: COLIBI 2013 Electric bike sales Sales have been strongest in China with Germany and the Netherlands jointly making up 65% of the European market in 2012. Research questions arising 1. Can e-bikes encourage more cycling trips in hilly areas and amongst those less able in the UK? 2. What are the barriers to e-bike ownership, given the slow take-up in the UK? Are electric bikes a solution to hills? A UK perspective. A hub-mounted electric motor A frame-mounted electric motor Folding electric bicycle Student: Alexander Lister Course: MSc. Transport Planning Dissertation Supervisor: Frances Hodgson 0 50,000 100,000 150,000 200,000 250,000 300,000 350,000 400,000 2010 2011 2012 E-bikesales Year E-bike sales 2010-2012 Great Britain Germany Netherlands 45% 20% 5% 5% 4% 21% Europe 2012 e-bike sales share Germany The Netherlands France Italy Great Britain Other(s)
- 8. Monica Corso - ts10mec@leeds.ac.uk MSc (Eng) Transport Planning and Engineering Supervisor: Daniel Johnson May 2012 Bing Li – MSc Transport Planning and Engineering Supervisor: Dr. James Tate E-mail: ml12b2l@ leeds.ac.uk Institute for Transport Studies University of Leeds 05 - 2014 BACKGROUND OBJECTIVES CASE STUDY ➢ The main aim of this project is to better understand the impacts of traffic congestion on fuel consumption and vehicle emissions performance in the study area – Headingley. ➢ Two key objectives: Actual Tracked Vehicles Data in Headlingley from RETEMM Project (Speed, Acceleration, Gradient) One Vehicle with PEMS Model Validation and Data Obtaining – Real and Predict Emissions & Fuel Consumption VEHICLE EMISSIONS FUEL CONSUMPTION ➢ Road transport is the main source of air pollution in urban areas. ➢ Speed profiles will help to run emission model. ➢ Speed profiles are obtained using a GPS data logger and the data is historic collected. ➢ Road gradient is considered which will be used in PHEM through vehicle specific power (VSP) formula and to make model more accurate. ➢ Analysing the relationship between congestion and vehicle emissions, and how driving behaviours in traffic congestion affect emissions ➢ Fuel consumption is greatly influenced by road gradient because it is related to different engine load. ➢ Fuel consumption usually increases under congestion and the changing of driving behaviours makes contributions to the increasing part. ◎ Using actual tracked data to study how driving behaviours and vehicle movements adapt to congestion and the effect on tail-pipe emissions. ◎ Analysing how driving behaviours and vehicle movements influence fuel consumption under congestion. ➢ Health Effect: Public Health England(PHE) said 5.3 per cent of all deaths in over-25s were linked to air pollution, which is more than road accidents. ➢ Emission Trends: The emissions of petro vehicles (e.g. NOX) decreases from Euro0 to Euro5, however, it is almost unchanged for diesel vehicles and increases from Euro3. *Real-world Traffic Emissions Monitoring and Modelling (RETEMM). EPSRC January 2008, Grant Reference: GR/S31136/01 Five vehicles with GPS data Analysis and Comparison Emission Model – PHEM Real Observations (CO2) 0 200 400 600 800 1000 0.0000.0010.0020.0030.0040.0050.006 Time (seconds) NOx(g/s) 0 200 400 600 800 1000 01020304050 Time (seconds) VehicleSpeed(kmh 1 ) Speed Profile NOX Profile
- 9. •Review of relevant literature • formulation of questions for interviews Methodology Step one •Interview of policy makers and Non Governmental Organizations (NGOs) • Interview analysis. Methodology Step two •An appraisal of the factors that have influenced the focus on CO2 reduction in transport in the UK; •Exposition on the consequences of such focus. Expected Findings Benedictus Dotu Nyan ID: 200819480 Sustainability (Transport) Supervisor Antonio Ferreira (Dr) Caroline Mullen (Dr) Second Reader TRAN5911M Background- emergence of focus on CO2 reduction in the UK • Stern Review (2006) urged transition to a low carbon economy. • UK Climate Change Act (2008) :- transport is a major source of CO2 and other Greenhouse gases (DfT, 2012). • Carbon Plan (2011) :- move toward achieving an 80% reduction in and CO2 other Greenhouse gases (DfT, 2012) • (DECC, 2014) CO2 emissions from the transport sector in the UK in 2013 accounted for ¼ of all domestic CO2 emissions Objectives Identify factors that have influenced the focus on CO2 reduction in the UK. Examine the pros and cons of focusing on CO2 reduction in the UK. Research Questions What are the factors that have influenced the focus on CO2 reduction in the UK? What are the pros and cons of focusing on CO2 reduction in the UK? Problem • Humanity has already transgressed the climate change planetary boundary . • It is based on two critical thresholds- CO2 and radiative forcing. • Exceedence of 350 PPM of CO2 and 1 watt of radiative forcing will result to irreversible climate change.; However, • The biodiversity boundary has been transgressed; • Change in land use has become problematic (Rockstrom et al., 2009). • Ambient air pollution (PM2.5, PM10 NO2, SO2, etc.) was responsible for 3.5 million deaths in 2012 (WHO, 2012); Google Image
- 10. DEVELOPING TRIP GENERATION MODELS: COMBINING SURVEY AND MOBILE PHONE DATA Author: Christopher O. Edeimu Supervisor: Dr. Charisma F. Choudhury A trip is a one way journey and may be classified as home or non-home based. Trip rates are the rates at which trips are generated. Can be considered the rate socio-economic activities are loaded onto the transport network. They indicate the network capacity to plan and provide for. They are influenced by land use and socio-economic attributes of the population. ABSTRACT Their accuracy and reliability depend on the reliably of the data. The cost of data gathering and trip rates estimation make this a major challenge in most developing countries. However, mobile phone data are accurate and reliably generated and, properly harnessed, presents a low cost, alternative source of transport planning data. Trip generation has been studied at the: • Aggregate level employing linear regression and categorical analysis. (Vickerman and Barmby, 1985). • Disaggregate level using discrete choice models. Regression method will be adopted in this study (Washington 2000), because they: • Facilitate identification of variables that are correlated with trip origination. • Are useful for prediction and policy impact assessment Neumann et al, (1983) directly estimated all-purpose trip production rates using traffic ground count to data. Obtained estimates within 96% of true rates. Caceres et al., (2007) inferred OD matrices from mobile phone data. OBJECTIVES Contribute towards developing trip generation models that countries with limited resources to undertake household surveys can use to reliably estimate trip rates. Specifically: • Develop regression-based trip generation models combining mobile phone CDR and socio-economic variables. • Improve reliability of trip rate estimation. • Reduce data requirements for trip rates estimation. • Reduce trip rates modelling cost. To examine the feasibility of combining mobile phone CDR and socio-economic data in trip rates estimation. Two questions to be investigated. 1. Will trip rates derived using mobile phone data be statistically different from those derived using household survey data? 2. If yes, what might the reason(s) be? EXPECTED OUTCOMESLITERATURE REVIEW REFFERENCES 1. Arabani M. and Amani B. 2007. Evaluating the Parameters Affecting Urban Trip-Generation. Iranian Journal of Science & Technology, Vol. 31, No. B5, pp. 547-560. 2. Caceres et al. 2007. Deriving Origin–Destination Data from a Mobile Phone Network. IET Intelligent Transport System Vol. 1, pp. 15–26 3. Neumann E. S. et al. 1983. Estimating Trip Rates from Traffic Counts. Journal of Transportation Engineering, Vol. 109, No. 4, pp. 565-578. 4. Ortúzar, J. D. & Willumsen, L. G. 2001, Modelling Transport, Third Edition, Wiley, New York. 5. Vickerman, R. W., and Barmby T. A. 1985. Household Trip Generation Choice: Alternative Empirical Approaches, Transportation Research B, vol. 19, no. 6, pp. 471-479. 6. Washington, S. 2000, "Iteratively Specified Tree-based Regression: Theory and Trip Generation Example", Journal of Transportation Engineering-Asce, vol. 126, no. 6, pp. 482-491. Traffic Assignment Modal Split Trip Distribution Trip Generation Trip Rates Because they feed into every aspect of the transport planning process they should be properly and reliably estimated. Inaccuracies will be greatly magnified in inefficient and ineffective transport policies and system. Area-wide, all-purpose linear regression estimates of trip generation rate for motorized journeys suitable for systems with limited resources and access to appropriate data. • Area-wide, all-purpose, because they produce equally accurate results. (Coomer and Corradino, 1973). • The implicit assumption by conventional models of mutually independent trips may not properly reflect behavioural reality. (Goulias et al. 1991). Statistical Methodology for model estimation Trip Generation Model 𝑡 𝑘 = 𝛼 + � 𝛽𝑖 𝑋𝑖𝑖 + 𝜀 𝑛 𝑖=1 (𝑁𝑁𝑁𝑁𝑁𝑁𝑁 𝑒𝑒. 𝑎𝑎, 1983) 1. Divide study area into units (TAZ). 2. Map mobile data to TAZ. 3. Infer residual traffic counts. 4. Regress residual traffic counts on socio- economic variables. 5. Results: all-purpose TAZ trip generation rate. • 𝑡 𝑘 = Area−wide all−purpose trip rate for TAZ k (dependent variable) • 𝑋𝑖𝑖 = Matrix of socio−economic variables (explanatory variables) • 𝛽𝑖= Vector of coefficients Error Tests Model Estimation Model Validation Model Calibration Model Specification Tested Trip rates to be relied on for their purposes anywhere in the transport planning phase. Step Equation R2 Parameters 1 𝒗 𝒌 = 𝜶 + 𝜷 𝟏 𝑿 𝟏 + 𝜺 d% 𝑿 𝟏 2 𝒗 𝒌 = 𝜶 + 𝜷 𝟏 𝑿 𝟏 + 𝜷 𝟐 𝑿 𝟐 + 𝜺 e% 𝑿 𝟐 . ... … … … n 𝒗 𝒌 = 𝜶 + 𝜷 𝟏 𝑿 𝟏 + 𝜷 𝟐 𝑿 𝟐+. . +𝜷 𝒏 𝑿 𝒏 + 𝜺 f% 𝑿 𝒏 • All parameter to have the required sign and order of magnitude. • R2 will be significant in determining validity of the results. Statistically large samples sizes are critical to proving the significance of relationships. • The expected sample of CDR data is over 900m.
- 11. • The Mohring Effect is the background for the reimbursement guidance of Concessionary Travel from the UK Department for Transport. • In England, the Concessionary Travel has been introduced in 2006 for elderly people and disabled residents allowing free travel in off peak time. In 2009/2010 concessionary passengers on local bus represented the 30% of local bus trips. •The principle for reimbursement to bus operators was “NBNWO” , “No better no worse off” than without the scheme: costs incurred by carrying extra passengers may be significantly different depending on behaviour of the operator facing the extra –demand. Operators may: • Allow for higher load factor without any additional service • Run larger vehicles • Run additional service to the route, leading to the Mohring Effect. The power relationship between frequency and demand is challenged by real world considerations, such as: • Indivisibilities, desire to maintain “round numbers” for service level • Load factor constraints, passenger constraints • Predatory competition Does the Mohring effect really exist? Student: Dario Nistri Supervisor: Jeremy Toner - Second Supervisor: Antony Whiteing Background What is the Mohring effect? Demand Q= 1 Opt. Number of bus =B* • The Mohring effect is a form of economy of scale by user side in public transport services. For scheduled and urban public transport, an increase in frequency, produces economy of scale for users in term of time savings. •Supposing a Welfare Maximising operator, Mohring (1972) states that whether it occurs an exogenous increase of travel demand, the bus service would increase with the square-root. Mohring Square root Opt. Number of bus =1.40B* • Supplying the service with additional 40% bus units, travellers double Meaning of the rule Task 1 Task 2 Demand and cost estimationMax Load Factor Crowding Threshold Overload Departures Does elasticity is =0.5? How much is different? Square Root Method Mohring Effect Size of Mohring Factor Size of Mohring Factor Policy implications Methodology Objectives Expected results References However a second order demand of commercial travellers is generated beyond concessionary extra traffic. •Investigation of operators behaviour when the increase of the demand occurs, attempting to identify the crowding threshold above that the operators upgrade the service increasing the frequency. •Estimation of the effect of the agreement for full or partial reimbursement of Concessionary Travel on service level . •Estimation of the size of Mohring Factor in the context of unregulated market populated by profit-maximising operators. •At network level, calculation of costs and Load Factor change due to the introduction of Concessionary Fare, in case of full and partial reimbursement . Application of Abrantes and Last methodology to calculate Mohring Effect. •Application of the Square Root at route level to calculate Mohring Factor, taking in account two routes one with the demand double of the other. Hp 2 Hp 1 Abrantes & Last Method Concess. pax Generated Pax Task 1 Task 2 •Abrantes and Last study established two crowding threshold that we consider such as milestones. So it is reasonable to expect that the threshold for the data taken in account would be between 85% and 100% of load factor. •The condition “no better no worse off” , if not fully applied, may prevent the profit maximising operator to increase the service, allowing the load factor to increase. •The size of Mohring Factor in the context of unregulated market populated by profit-maximising operators is expected to vary that estimated for the welfare maximising scenario. •Nelltorph et al. (2010) proposed the value of 0.6 in welfare- maximising framework. Abrantes and Last (2011), studying the commercial decisions by operators in three English Metropolitan areas, calculated the values reported in the following table. •Abrantes, P., & Last, A. (2011). Estimating additional capacity requirements due to free bus travel. •Toner J.P.(2013). Mohring Effect: theory and Existing Evidence. Institute for Transport Studies. B*= optimal n. of bus /hour C= unit cost to produce bus/h Q= passenger / hours V= value of time • If an hexogen change doubles the travel demand, it can be supplied with 40% additional bus units Demand Q= 2
- 12. Introduction Landlocked Developing Countries (LLDCs) face peculiar transport problems, particularly in freight transport, because of their dependency on other countries co–operation for access to international trade routes. Freight costs per km in most LLDCs are more than 50 percent (value of export), higher than in United States of America and Europe. Transport costs can be as high as 75 percent of the value of exports (Faye et al., 2004). A number of studies have been conducted on freight transport problems encountered along the northern corridor; however, very few have used system dynamics thinking to analyse and present these problems. Problems faced Dependence on transit neighbour: neighbours’ infrastructure; administrative practices; peace and stability. Long distance from the sea. High freight transportation cost. Aims and Objectives Identify problems faced by transporters. Identify factors hindering efficiency of cargo clearance along the Northern Corridor. Carry out system analysis of factors that hinder freight transportation along the Northern Corridor and develop causal loop diagrams that describe feedback mechanisms between these factors. SYSTEM ANALYSIS OF BARRIERS TOWARDS FREIGHT TRANSPORTATION IN LANDLOCKED DEVELOPING COUNTRIES: A CASE OF ROAD FREIGHT TRANSPORTATION IN UGAANDA Student: OKELLO Cypriano: (Msc.) Transport Planning Supervisor: Dr. Astrid Guehnemann; Co-supervisor : Prof. Paul Timms University of Leeds Methodology Causal Loop Diagrams (CLDs) The CLDs are important tool for representing the feedback structure of systems (Sterman, 2001). The CLDs are excellent for: Capturing hypothesis about causes of dynamics Eliciting and capturing mental models of individuals/teams Communicating important feedbacks believed to be responsible for problems Data collection Face to face interviews using semi–structured questionnaires Sampling techniques Purposive sampling (Ministries, Departments and Agencies) Missing voices to be included (allows for flexibility) Data analysis Draws out patterns from concepts and insights Data presentation Causal Loop Diagrams will be used to describe feedback mechanisms between freight transport problems identified. Scope Main focus on road transport along the northern corridor, from Mombasa to Kampala Malaba Border Post (Malaba–Uganda and Malaba–Kenya) 50% of Travel Time: waiting at BPs & other stops References FAYE, M. L., MCARTHUR, J. W., SACHS, J. D. & SNOW, T. 2004. The challenges facing landlocked developing countries. Journal of Human Development, 5, 31-68. STERMAN, J. D. 2001. System Dynamics Modelling: TOOLS FOR LEARNING IN A COMPLEX WORLD. California management review, 43.
- 13. Car Dependency in the City of Leeds: The Impact of Infrastructure and Culture Objectives The purpose of this dissertation is to explore some of the key questions in relation to car dependency within the City of Leeds: • What is the extent of car dependency in the city? • What are the main causes for it? o In particular what is the extent of the role of two of the main contributing factors towards car dependency: Attitudes and Infrastructure On gaining a measure of these issues, this dissertation will set out what could be done to reduce it through Policy Changes and/or Capital Investments. Background Campaign for Better Transport 2012 Annual survey that ranks each city by its dependency on cars. Cities are scored on: Of the 26 cities included in the scorecard, Leeds was 20th overall In relation to amount of car use it was joint 24th Why is car use bad? • Roads are Congested • Economic Impacts e.g. disutility of time spent in traffic • Accessibility Impacts e.g. people unable to get to where they want to • Environmental Impacts e.g. pollution, effect on health, carbon • Social e.g. effect of inactivity, leading to obesity issues Why is it particularly bad for Leeds? • Car ownership in Leeds is still growing o 2001-2011 – 2% increase in number of households that have a car (ONS, 2001 and 2011 Census) • Two-way AM peak traffic volumes increased by 10% between 1990-2012 • Population still rapidly growing: o 11.8% larger in 2021 from 2011 with 840,000 people living within the Leeds district area (ONS, Sub-National Population Projections, 2012) and; o 74,000 new homes planned to be built between 2012-2028 (LCC, Core Strategy, 2013) • A net importer for jobs, with more travelling into the city to work than travel out: o Circa 460,000 people employed in Leeds (ONS, Nomis Job Density Data, 2011) o 50,000 more than flow out of Leeds (ONS, Commuter Annual Population Survey, 2011) Methodology 1. Desktop Study • Examine the existing infrastructure in Leeds - including GIS analysis • Determine if there is any validity in claims that Leeds is a car dependent city due to infrastructure compared with cities that scored well on the CfBT scorecard 2. Opinion Survey • Scope - Aimed at car users commuting into Leeds, focusing on attitudes to car use, infrastructure, public transport and active travel provision from an individual perspective • Influence – Survey will be informed by existing literature e.g. Linda Steg’s article, Car Use: Lust and Must (2005) in which surveys were used to examine motives for car use • Concepts from the TPB model will also be used to inform the direction of the survey • Method - Survey to be carried out using an online survey website, circulated through Metro’s business contacts who are signed up with the Travel to Work team • Sample Size – Circa 200. If this cannot be attained through the on line survey, manual surveys will be carried out at key locations in city centre e.g. car parks • Analysis - Designed to allow for ANOVA to explore the variations in people’s responses in respect of their attitudes towards different aspects of transport and car use • T-tests to be used to demonstrate whether there is any significance in the different responses from the different groups • Analysis will enable results to be tied back to the aims and objectives to provide suggestions for possible targeted policy changes or investments to reduce car dependency Key Thoughts – Attitudes Steg (2005) – Car Use: Lust and Must • Car use not just about fulfilling a function i.e. getting people to work. It has a large symbolic status, with pleasure being derived from its use, even just for commuting “the car is much more than a means of transport” • People use cars because of the experience of driving, because of its status • This reinforces people’s choice to drive • Policy needs to target these attitudes - offer a real alternative in public transport? Ajzen (1985) – Theory of Planned Behaviour • People’s choice of mode such as car, is dependent on their attitudes, social norms and perceived behavioural control • In order to change people’s behaviour and choice of car as a mode, you need to target these areas o Offer real alternatives to the car, change the social norm so that public transport / active travel is how you get about in Leeds o Improve the image of public transport / active travel and discourage that of the car Ellaway et al (2003) – In the Driving Seat • Explored the psychological benefits associated with private and public transport to help explain why so many people drive i.e. car has greater psychological benefits than public transport. • Suggests that in order to encourage reduction in private car use policy must take these types of benefits people derive from car use into account Key Thoughts – Infrastructure Leeds’ transport system focuses around its city centre, with a large number of commuting trips coming in from outside the Outer Ring Road (ORR) • 29% of commuting trips to Leeds city centre made within the ORR during AM Peak • 71% from further afield – people commuting in are more likely to use a car • 45% of total trips made by car • 30% by rail and 25% by bus (LCC, Transport for Leeds Project 2008/09) Car • Well established road and motorway network built in ‘spoke and wheel’ layout • Makes travelling by car easy and allows direct access to city centre from suburban areas and other districts • Large amount of car parking in city centre – circa 22,000 spaces (LCC, Annual Parking Report, 2011/12) Rail • Network serves limited radial corridors, with few stations within ORR • High rail demand, circa 16,800 arriving in Leeds City Station during morning peak in 2013, compared to 12,400 in 2004 (LCC, Cordon Count Data) • Figure has tapered off in recent years, suggesting network is reaching capacity • There are plans to expand network capacity – new stations, longer trains and improvements to the lines to cope with more train services Bus • Well established network – Patronage remains at consistent level year on year • Bus mode share for commuting trips higher than car within ORR – 59% • Outside ORR it is 18% and 47% for car (LCC, Transport for Leeds Project 2008/09) • Long dwell times at stops due to boarding – smartcard ticketing is being phased in • Bus punctuality – 88.6% run ‘on time’ (1minute early and 5 minutes late) (Metro, MetroFacts, 2009/10) • This falls short of Traffic Commissioner’s target of 95% • Large journey time variability Rapid Transit • City has none – largest city in Europe to have nothing • Trolleybus networked planned to provide a real alternative to car. • However, only one initial line so limit impact Cycling/Walking • Little infrastructure for cycling, although it is improving e.g. Cycle Superhighway • However, city geography makes it difficult to encourage large numbers of cyclists • Long distances between suburban areas and city centre 2 Way Traffic Cordon Flows For All Vehicles in AM Peak (LCC Monitoring) 1990 2004 2012 1990-‐2004 Growth 2004-‐2012 Growth 1990-‐2012 Growth 145,474 163,098 160,484 12% -‐2% 10% Chris Payne Supervisor: Ann Jopson Accessibility and planning Buses and trains quality and uptake Cycling and walking as alternatives Driving and car use Larger squares = be9er rankings in category Source: Steer Davies Gleave, 2009 Source: Leeds City Council Leeds Transport Geography Congested Routes in Leeds District
- 14. • Complex road network with 245,000 miles worth of road (DfT, 2012) • 35 million vehicles on British roads in 2013 and that is a 1.5% increase from 2012 (DfT, 2014) • Roads don’t last forever, wear and tear, accidents means that there is a need for increased investment to being maintained • The maintenance of local authority managed roads is being reduced: - 2009/10 £3.3 million - 2010/11 £3.1 million - 2011/12 £3.0 million (DfT, 2013) • By 2020/21 £6 billion will have being invested to help repair and sustain local roads (Great Britain & HM Treasury, 2013) • Must use resources more efficiently, how is this decided? How should it be decided • Providing a service for the public, so ask the public what they think • The customer satisfaction surveys involve 46 local authorities • Cross comparison of two models, will be the same except with the addition of customer satisfaction in one of them • What determines the cost? Cost= f(Type of treatment, time constraints, Customer Satisfaction, availability of resources, traffic management, utilities) • Estimate the significance, size and signs of the variables based on the economic background • Problems, which could be encountered: missing variables, errors in variables larger data set needed, the independence of the authorities • To solve these problems appropriate tests will be taken Disadvantages • Only when habits are changed can there be a true value • Instruments for measuring customer satisfaction not readily available • Difficult to apply costs to a 5 point scale (Abou-Zeid 2008) • Personality and taste will affect the results making it biased • Not consistent when surveys are repeated because there will be a different range of income, age, gender, employment 𝐻0 : Customer satisfaction plays a valid role 𝐻𝐴 : Customer satisfaction plays no significance Abou-Zeid, M. Moshe B, and Michel B. 2008. Happiness and travel behavior modification. Proc. of the European Transport Conference. Department for Transport. (2012). Road lengths in Great Britain: 2011. Department for Transport. (2013). Road Conditions in England: 2012 Department for Transport. (2014). Vehicle Licensing Statistics: 2013. Great Britain & HM Treasury. (2013). Investing in Britain’s future. Vol 8669. Stationary Office. Highways Agency. (2014). Listening to our customers. Olsson, L. Friman, M. Pareigis, J. Evardsson, B. (2012). Measuring service experience: Applying the satisfaction with travel scale in public transport. Journal of Retailing and Customers Satisfaftion. 19, pp. 413-418. Charlotte Stead- 200386644 MA Transport Economics Phill Wheat • 𝐻0 : Customer satisfaction plays a valid role - Fail to reject the null hypothesis, - Customer satisfaction should be used - How can it be improved? • 𝐻𝐴 : Customer satisfaction plays no significance - Can reject the null hypothesis - What are the alternatives • The problems encountered in the model • How this model can be improved Advantages • Used to assess the non monetary costs such as time, smoothness of the journey, cleanliness (Olsson 2012) • Surveys are used to assess how well services are meeting expectations • This is needed to influence investment decisions “Understanding the needs of our customers is an integral part of the Agency’s operations. To help us achieve our vision we need help.” (Highways Agency, 2014) All roads needs maintenance Highway Maintenance Strategy
- 15. SOURCE: Public Transport Authority of Western Australia Workplace test group: One40 William PHOTO CREDIT: Hassell One40 William Results Oral presentation Written dissertation Summary report to participating organisations Analysis Data cleansing Cross- tabulation Principal Components Analysis Multiple Discriminant Analysis Data Collection Questionnaire: Test group - One40 William Control group - same/similar organisations, alternate sites Literature Review Car dependency Land use & urban design Mode shift Habit disruption TIPPING THE SCALES Do active and public transport facilities at the workplace reduce commuter car use? Researcher: Catherine Wallace (ts13clw@leeds.ac.uk), MSc Sustainability (Transport) Supervisor: Ann Jopson (A.F.Jopson@its.leeds.ac.uk); Second Reader: Frances Hodgson Institute for Transport Studies FACULTY OF ENVIRONMENT Increased use of active and public transport for commuting? Office building integrated with train station Close to bus stops & central bus station Free Transit Zone End of trip facilities Parking restrictions and high fees Context Objectives Methods Analysis Research QuestionsIntroduction CAR DEPENDENCY § Private car use is reaching unsustainable levels in many industrialised countries (Kenworthy & Laube 1996). § There is a particular interest in reducing the negative effects of congested commuter traffic in cities (O’Fallon et al. 2004). § Many of the negative effects (to the economy, health and the environment) seemingly cannot be mitigated by technological improvements alone (Bamberg 2007). Behavioural change is required. § The psychological motives for car use are not just instrumental (practical) ones, like travel time and convenience. Car use has an affective/symbolic function – it represents power and control; it is a status symbol and extension of self (Steg 2005). LAND USE & URBAN DESIGN § ...have a cumulative effect on travel behaviour (Litman, 2014) § Parking management can reduce car trips between 10-30%; multi-modal site design also thought to contribute (Litman 2014) § When examining commuter mode choices, most studies look at the impact of residential location and access to transport services and infrastructure from home (Vale 2013) § Proximity to public transport and quality of active transport facilities near home affect mode choice (Naess 2009) § People may also self-select their home location to reflect their preferred mode choice (Cao et al. 2009), but self-selection may play a lesser role in workplace location and particularly workplace relocation (Vale 2013) § Research gap: how do workplace (destination) facilities/ access influence commuting choices (Vale 2013; Litman 2014) MODE SHIFT § Commuting accounts for 15-20% of trips, but >50% of congestion (Litman, 2014) § To change behaviour, you change the person or the conditions (Stradling et al. 2000) § City centres, where many workplaces are focused, ”are more amenable to alternative modes” (Litman 2014, p.18) à Is changing the conditions at a city centre workplace enough to change commuter behaviour? HABIT DISRUPTION § Commuting is habituated (de Brujin et al. 2009) § To break a habit, you need an impetus that makes people re- evaluate their choices (Handy et al. 2005; Bamberg 2006) § Research gap: what disrupts commuter habit? (de Brujin et al. 2009) Develop and pilot online questionnaire: § Travel behaviour before and after office relocation § Commuting habits (Self-Reported Habit Index, adapted from de Brujin et al. 2009) § Psychological motives (affective & instrumental factors, adapted from Steg 2005 and Bergstat et al. 2011) § Personal characteristics (age, gender, postcode, household car & bike ownership, private/company vehicle, income, employment type, # children, major life changes, etc) Administer questionnaire: § Test group: One40 William (building opened 2011; majority government tenants, with some private, retail & hospitality) § Control group: same or similar organisations at alternative sites (with less favourable PT & AT access/facilities) § Aim for 100+ respondents per group Analysis will be conducted using SPSS: § Data cleansing: check for errors, outliers; run descriptive stats; t-tests; check sample distribution, transform if necessary § Cross-tabulation: test group travel behaviour before and after relocation (Stradling et al. 2000) § Principal Components Analysis: psychological factors (Steg 2005) § Multiple Discriminant Analysis: analyse difference between test and control groups in current travel behaviour, psychological motives and habits. The key objective of this study is to understand the impact of active and public transport infrastructure and services at the workplace on commuter mode choice. This involves its: § impact on commuter behaviour § ability to disrupt habit and influence psychological motives § implications for future policy Many cities are seeking to shift commuters away from car use in favour of public transport and active transport (walking and cycling). A significant shift offers many advantages, including: § Reduced congestion (and associated costs) § Reduced emissions and better air quality § Improved health outcomes (including a reduction in major preventable diseases, such as obesity) Potential Implications Workplace conditions and employment practices are arguably easier (and more expedient) to influence than residential ones. If workplace (destination) factors: have a significant effect on mode choice; can disrupt commuter habits; and/or influence psychological motives for car use, this could inform policies to reduce commuter car use and its negative effects in cities. Literature Review Data Collection Will the below workplace (commuter trip destination) factors: § Increase the use of active and public transport for commuting? § Reduce commuter car use? § Disrupt the habit of commuter car use? § Affect psychological motives (affective/instrumental) for car use? Infographics created by the researcher based on cited source information.
- 16. ROAD TRANSPORT EMISSIONS AND ITS EFFECT ON PUBLIC HEALTH IN GHANA A CASE STUDY OF THE ACCRA PILOT BRT ROUTE Daniel Essel: Msc Transport Planning & Environment Supervisor: Dr. James Tate Co-supervisor: Jeffrey Turner Background A major problem facing the world today is road transport emissions which have been increasing at a much faster rate than anticipated. There is little evidence to support the fact that the current growth in vehicle ownership especially in developing countries will decline. Vehicle population in Ghana increased from 511,755 in 2000 to 1,591,143 in 2013 and projected to grow by 10% per annum. A roadside study reports high levels of PM10 exceeding the EPA- Ghana 24 hour mean of 70µgm-3 even though WHO limit value for PM10 is 50µgm-3. 79% of the samples collected at 3 roadside sites along the BRT route exceeded the EPA-Ghana 24-hour PM10 air quality guideline of 70 µgm3. Exposure to emissions at roadsides are 7 times higher within 15 metres but decay as distance increases. Epidemiological studies have confirmed short and long-term effect of vehicular emissions on respiratory related illnesses. Objectives Model current levels of vehicular emissions along the BRT route Assess air quality concentrations along the BRT route Assess its health implication on residents, traders and commuters along the BRT route Expected Outcomes Residents living within 150m from the BRT route would have higher exposure to traffic pollutants than those living further away The health implications will vary as traffic levels changes Commuter and traders spending longer hours along the BRT route will have higher exposure to traffic emissions References Driver and Vehicle License Authority, 2013: Unpublished Report of Vehicles Registered in Ghana Ebenezer Fiahagbe, 2012. Air Quality Monitoring in Accra, Ghana Kim, J.J. et al. 2004. Traffic-related air pollution near busy roads: the East Bay Children's Respiratory Health Study. American journal of respiratory and critical care medicine. Wright, L. and Fulton, L. 2005. Climate change mitigation and transport in developing nations. Transport Reviews Proposed Methodology Pilot BRT Route 24-Hour PM10 Concentration along the route Date: 2nd May, 2014 Extract of a section of the BRT route Proposed Methodology Source: Adapted from Google Maps Source: EPA Ghana- Air Quality Monitoring Programme
- 17. Student : David Nunoo Programme : MSc. Transport Planning and Engineering Supervisor : Dr. Samantha Jamson Leeds – Bradford Canal Towpath Improvements: Will it encourage social and commuter cycling along the canal? Institute of Transport Studies Date : May 2014 Research questions: 1. Is perceived risk a serious obstacle to cycling and walking along the canal? 2. Is cycling and walking considerably affected by perceived risk along the canal? 3. Who the predominant users of the towpath are and their trip purpose(s)? Background The Department of Transport (DfT) granted Leeds and Bradford City Councils permission to implement a £29million ‘cycle superhighway’ between the cities. It is foreseen that this will improve the economy, environment, road safety and people’s health (Bradford-Telegraph-Argus, 2013). As part of the grand scheme, 14 miles of the existing Canal Towpath between Shipley and Armely is to be upgraded with high quality resurfacing. Figure 1: Location plan References 1. Bassuk, S.S. and Manson, J.E. 2005. Epidemiological evidence for the role of physical activity in reducing risk of type 2 diabetes and cardiovascular disease. Journal of Applied Physiology. 99(3), pp.1193-1204. 2. Bradford-Telegraph-Argus. 2013. £29 million 'Highway To Health' cycling road scheme announced. Bradford Telegraph and Argus. 3. Caltabiano, M.L. 1994. Measuring the similarity among leisure activities based on a perceived stress-reduction benefit. Leisure Studies. 13(1), pp.17-31. 4. Chapman, L. 2007. Transport and climate change: a review. Journal of transport geography. 15(5), pp.354-367. 5. Organization, W.H. 2009. Global status report on road safety: time for action. World Health Organization. Contact information • David Nunoo | Institute of Transport Studies, University of Leeds • Email: ts12dkn@leeds.ac.uk • www. leeds.ac.uk Proposed Methodology Research aims: 1. To determine if the improvement works along the canal towpath will result in an increase in the number of commuter and leisure cyclists along the route. 2. To determine if the improvement works will improve the safety perception of cyclists and pedestrians along the route. 3. To determine if there is an improvement in the cycling and walking experience along the route following the works. Figure 2: Existing section of the towpath Expected outcome It is anticipated that the improvement works of the Canal Towpath will result in a general increase in cycling and pedestrians activities along the route. Benefits of Cycling: 1. Cycling decreases the occurrence of ischaemic heart disease, cerebrovascular disease, depression, dementia, and diabetes (Bassuk and Manson, 2005). 2. Cycling reduces the occurrence of respiratory problems (Organization, 2009). 3. Cycling could reduce stress in individuals (Caltabiano, 1994) 4. Cycling is energy efficient because air emissions, noise pollution and greenhouse gases are not derived from it (Chapman, 2007).
- 18. BACKGROUND The private finance functions in developing and expanding Manchester Airport Supervisor: Nigel Smith Dayuan Xu MSc (Eng) Transport Planning and Engineering Institute for Transport Studies University of Leeds Email: ts13dx@leeds.ac.uk Analyse the functions of private finance in those successfully extended airports. Analyse the risk of private investment and measures to reduce the risk. Identify the most effective mechanisms for utilising private finance in future Manchester Airport development. How to create a win-win model in PPP. Manchester Airport ranks only second to Heathrow airport in the UK. There are now three passenger terminals and two runways. The forecasts for Manchester suggest that the Airport could be handling some 38 million passengers by 2015 and the number could rise to around 50 million by 2030. Planning to provide an additional terminal to expand capacity and exploit economic benefits. FURTHER WORK OBJECTIVES METHODOLOGY Preliminary activities Design issues Limitations Obtain database of Manchester Airport. Risk analysis of different PFI forms on both ground and air sides. How to reduce risks in the PPP. What could Manchester Airport learn from the completely extended airports. The pros and cons of private investment on airport. Evaluate the private finance in airport development. Prepare Generate dissertation Data collectionAnalyse Manchester Airport Documents Archival records Interviews
- 19. Protest -characterised as being non violent they involve a collection of people who come together to protest a cultural, social, political or economic issue (Oliver, et al. 2012). Riot - Riots are one example of anti-government demonstrations which is a spontaneous outburst of violence from a large group of people (Barkan. 2012) Flashmob - Strangers meet at a predetermined public location, perform an unusual behaviour, and then disperse (Duran. 2006) Mediated Crowd - A new social phenomenon relating to collective action which emerges as a result of the virtual arena of ‘’Web 2.0’’ and new mobile technologies Web 2.0– Characterised as being a interactive social media and user generated content allowing users to exchange content The mobile criminal: Protests, Riots & Flashmobs Emma O’Malley Supervisor: Frances Hodgson Aim Understand how the communication aspect of social media can influence the organisation of Protests, Riots and Flashmobs, specifically those which occur on transport networks or are in response to changes on the network. Objectives • How is transport used as the stage andor reason or action? • Do changes in communication technologies, particularly social media significantly influence social organisation to initiate new forms of protests (e.g., flashmobs, critical mass) on the transport system? • Following acts on transport networks how do transport systems respond and recover? Background The world is made up of networks whether environmental, social or economic; this project looks at the links between communication networks and transport networks, specifically at how communication networks as part of new social media is used to support action which disrupts or is a result of changes to transportation system. Transport Networks • Transportation systems are often the focus of this action as it is intertwined with practically every aspect of human life meaning that: • Large numbers are people are affected by changes or disruption to the system whether on a local or global scale • Transportation networks are easily accessible • Action on the system will be very visible (Blickstein and Hanson. 2001). Communication Networks The creation of the mediated crowd is an example of how public communication practices have changed in the twenty-first century (Baker. 2012). Social Media allows everyone with access to have a voice and removes physical and spatial barriers allowing communication with a vast amount of people who may share the same mindset (Baker. 2012; Moler. 2013). This allows for a new form of social organisation where people can create or connect with social movements outside existing channels far quicker and easier than ever before (Bartlett. 2013). Preparedness It is important to understand how this new form of communication influences the organisation these forms of protest, especially those which occur spontaneously and have large negative impacts, as it can assist in preparedness and recovery from such events. As we move deeper into the ‘internet age’ it is important to understand mobility not just in the form of movement but also related to the ‘new mobilties perspective’ includes the movement of information through the use of the internet and media outlets (Sheller and Urry. 2006). New Mobilties Perspective Method Complete an in depth study on literature surrounding three main areas: • Mobility and communication • Networks (Transport, Communication) and how these networks influence each other • Existing policy to enhance ‘preparedness’ in the face of new forms of protest Conduct questionnaires with people who have been involved with protests and interviews with participants who took a leadership role in organising protests such as Critical Mass or the London Die- In. Major Case Study Critical Mass is an urban sustainability and cycling movement where once a month a large groups of cyclist ride through a city in rush hour in order to increase the visibility of cycling (Carlosson. 2002). The event is decentralised with no one leader, today the internet has allowed participation to increase, continue and transfer to other cities in a cheap and quick way (Blickstein and Hanson. 2001). Other Case Studies will include London Die-In, Plane Stupid, and London 2011 Riots. Glossary of Terms Expected Outcomes Identify to what extend new social media affects the organisation of social protests in the UK Establish what measures can be taken to reduce negative impacts of such protests and whether integrating new social media can help this aim
- 20. TRANSPORT IN DEVELOPING COUNTRIES (The benefit of implementing NMT Master Plan in Tema, Ghana) Emmanuel N. Tetteh: MSc Transport Planning and Engineering Supervisor: Jeff Turner 1. BACKGROUND Transport planning policies in many developing countries have followed the western systems by using of models such as Highway Development Management (HDM-4) which focuses on or mainly dominated by motorists transport. Hence the gap between motorist and NMT especially in Africa. Non motorists transport is the ideal mode of transport travel within cities. This due to the fact that they require less space, less energy as well as zero noise and air pollution . NMT enhance safety and also has direct link with health It is widely established, from current studies that a sustainable transport in terms of impact on areas such as social economy, environment is the choice mode of walking and cycling, the two major means of urban NMT. In developing countries NMT is recommended as most sustainable transport mode. 2. AIM The aim of this dissertation would be to look at some of the benefits that the City of Tema would gain from implementing the master Plan. 3. OBJECTIVES The main objective will focus on the following: Identification of general NMT benefits Congestion benefits Challenges in terms of infrastructure A critical review of why NMT in Accra did not work 4. METHODOLOGY Secondary data available in final submitted report of ministry of road transport and Highways of Ghana 2013 master plan for Tema would be the main source of data to be used for this research. The existing data will be used to access the relative benefits of promoting NMTs such as health. 5. PROPOSED SCOPE This research will be limited to the analysis of congestion and economic benefits after the implementation of NMT Master Plan in the City of Tema in Ghana. The research will also look at some challenges that will need to be addressed during the implementation in terms of infrastructure for Non Motorists Transport (NMT). Cyclist in Tema Congested road in Tema Google Map of Accra and Tema
- 21. Geographical Location of Study Area THE EFFECT OF AXLE LOAD ON THE TRANS WEST AFRICA HIGHWAY – A CASE STUDY ON THE AGONA JUNCTION TO ELUBO ROAD SECTION IN GHANA MSc (Eng) Transport Planning and Engineering OBJECTIVES The study will generally seek to analyse the economic effect of strict enforcement of axle load control limits on transit trade and road investment. And will specifically aim to answer the research questions. METHODOLOGY EFFECT OF AXLE LOAD CONTROL REGIME Purposive Sampling Technique TARGET GROUP 1. Heads of Institutions /Senior Officers (GPHA, GSA & HAULERS) 2. Transit Trucks only GROUP 1 Personal Interviews using Questionnaires GROUP 2 Field Survey to Collect Axle Weights Secondary Data & Design Parameters of Case Study Design Scenarios for Sensitivity Analysis DATA ANALYSIS Exploratory and Confirmatory ECONOMIC VIABILITY HDM‐IV or CBA KEY FINDINGS, RECOMMENDATIONS AND CONCLUSIONS Source: National Overloading Control Technical Committee, South Africa (1997) EFFECT OF OVERLOADING OVERLOADING TREND IN GHANA BACKGROUND The West African Regional trading block, ECOWAS, is aligning its priorities towards economic integration of its member states. The development of the Trans West Africa Highway transiting five (5) member states (Cote D’Ivoire, Ghana, Togo, Benin & Nigeria) has been given the highest priority. 56% of this corridor lies within the boundaries of Ghana of which 20% is the case study area (i.e. Agona Junction to Elubo Road) A major threat to the life span of this road pavement is the axle weights of transit trucks. Transit trade is however a major contributor to Ghana’s Economy (World Bank, 2010). How to determine the balance of implementing an axle control limit that is viable for revenue generation at the port and prevent premature pavement deterioration. What is the current level and extent of axle overloading on the studied road? What is the design traffic loading used for the Agona Junction – Elubo road pavement design? What axle load limit will be economically viable to implement? DESCRIPTION OF STUDY AREA RESEARCH QUESTIONS PROBLEM STATEMENT A 110km road length along the coast of Ghana to the border with Cote D’Ivoire. Lies in the equatorial climatic zone and is the wettest part of Ghana. Nationally, it serves a population of about 1.84million inhabitants and an area of 23,921km2 (World Bank, 2010). Name: ERNEST O. A. TUFUOR (ID‐200661275) 2013/2014 Supervisors: JEFFREY TURNER AND DAVID ROCKLIFF Rutting Not Safe Source: Ghana Highway Authority, 2012 Annual Axle Load Report (2013) 2008 2009 2010 2011 2012 Number of Weighed Trucks 14625 47480 49586 140311 194516 Number Overloaded 3773 7026 9452 34302 34245 Percentage Overloaded 26% 15% 19% 24% 18% 26% 15% 19% 24% 18% 0% 5% 10% 15% 20% 25% 30% 0 50000 100000 150000 200000 250000 A MAP OF WEST AFRICA
- 22. Mode Choice Analysis for Shopping Trips in Great Britain Gandrie R. Apriandito (200737853) Supervised by Jeremy Shires and Daniel Johnson • To examine the relationship between expenditure and transport accessibility • To identify what factors influence people in determining the choice of mode for shopping trips • To design relevant transport policy recommendations in order to get more people using bus instead of cars Objectives • Primary data was collected by ITS for DfT through an online survey across Great Britain • Distance and time travelled are compiled from Transport Direct to calculate journey cost Data Collection Methodology Primary Data Secondary Data Expenditure and Accessibility Mode Choice Analysis Regression Analysis Logit Model Transport Policy Recommendations • The dominant journey purpose for bus trip in Great Britain is shopping with 1.3 millions per annum, surpassing commuting purpose with 1.1 million passengers per annum (National Travel Survey) • Nearly 70% of shopping activities are located in either city or town centres. Bus service is essential in providing efficient accessibility to the potential demand • More than half of shopping trips are undertaken by cars Background Key Issues Logit Model Un,j = Vn,j + εn,j Example for single observation n with j different modes • U: Utility choice function • V: Deterministic function of the attributes • ε: Unobserved part (distributed independently and identically) Expenditure Model • It is the function of individuals characteristics and generalised cost • Relates to income, employment, shopping location, modes, specific purpose • Generalised cost is the function of accessibility and fares (for bus) Structuring a well-defined decision guidelines based on demand and supply characteristics of the traveller and alternatives available
- 23. The railway system in Great Britain is the oldest in the world. The world's first locomotive-hauled public railway opened in 1825. Rail passenger demand has experienced significant growth in the last decade. The study is aimed at undertaking analysis to determine quantitative elasticity variations with key factors that drive passenger rail demand in Great Britain for the period 2002 to 20011. This information is vital in facilitating decision making, planning, management, policy formulation and investments in the transport sector. A measure frequently used to summarize the responsiveness of demand to changes in the factors determining the level of demand is the elasticity. Given as : Where ∆y is the change in the demand y, and ∆xi is the change in the explanatory variable xi. • The study offers valuable insights to the variations in the responsiveness of key drivers to rail travel growth. • There is plenty of empirical evidence on elasticity’s but not so much evidence on examining variations. The main aim of this study is to produce quantitative indications of elasticity’s variation with key factors such as distance; route; ticket type;. i. To find evidence on fare elasticity variations. ii. To find evidence on service quality elasticity variations iii. To determine general journey time elasticity variations iv. To find evidence on elasticity variation with the strength of competition v. To investigate evidence on GDP elasticity variations across routes , distance and overtime. • The study will adapt the conventional modelling approach, the fixed effect model (FEM) expressed as: • 𝒍𝒏𝑽𝒊𝒋𝒕 = 𝝁𝒊𝒋 + 𝜶𝒍𝒏𝑭𝒊𝒋𝒕 + 𝜷𝒍𝒏𝑮𝑱𝑻𝒊𝒋𝒕 + 𝜸𝒍𝒏𝑮𝒊𝒕 + 𝜹𝒍𝒏𝑷𝒊𝒕 + 𝜼𝒍𝒏𝑻𝒊𝒋𝒕 + 𝝀𝒍𝒏𝑪𝒊𝒋𝒕 + 𝝆𝑯𝒊𝒕 +𝜺𝒊𝒕 • The FEM allows the time invariant differences between flows which cannot be included or the time-invariant difference between flows to be expressed as a specific function of included variables as compared to the ratio modal approach. • The beauty of greater generality of FEM makes it preferable for estimation of panel data. • The basic model for the study is the fixed effect model (FEM) as opposed to the previous studies that used the ratio model (RM) and the PDFH. • Quantitative secondary panel data from rail operating companies will be used in this research, consisting of 184 flows ranging from 20 to 300 miles between stations, in 13 periods from 2002 to 2011. • Econometric analysis will be done using Eviews soft ware. Presentation of results in forms of figures, tables, charts • Output will be in two forms: o Within group variation: variation over time for each flow o Between group variation: variations flows AN ANALYSIS OF ELASTICITY VARIATIONS IN RAIL PASSENGER DEMAND IN GREAT BRITAIN 2002 -2011 • Resent developments in the field of elasticity’s have led to renewed interest in extending the analysis to variations in elasticity’s across different key factors. • Fares and quality of service are fundamental to the operation of public transport since they form major sources of income to operators. Evidence on fare elasticity and quality of service elasticity variations are crucial in decision making on pricing policy, service level changes and evaluation of non equal- proportional fare changes for cost effective schemes. • The last decade has seen transformation of the railway therefore, it is important for policy-making to be informed by best available knowledge about the variations in elasticity's • The GDP elasticity represents the positive impacts of economic activity on business trips and income on leisure trips. BACKGROUND WHY IS IT AN IMPORTANT SUBJECT? WHY ARE WE STUDYING IT? WHAT DO WE HOPE TO ACHIEVE? HOW ARE WE GOING TO DO IT? WHY THIS MODEL? WHAT EVIDENCE IS THERE? Gerald Harry Ekinu- MA Transport Economics (ID: 200734159) Supervisor: Professor Mark Wardman area; elapsed time and levels that this variables take • A need to recognize and address the limitations of previous/ current studies in the modelling approaches used.
- 24. The Role of Incomes in Discrete Choice Models: implications in welfare measure in transport investment appraisal 1. Background, Motivation & Objectives 2. Theoretical Framework 3. Overall Methodology 4. Case studies: railways 5. Expected Results 6. References •Small, K.A. and Rosen, H.S (1981) “Applied welfare economics with discrete choice models’. Econometrica, 49 (1) 105-130. •Batley, I. and Ibanez, N. “Applied welfare economics with discrete choice models: Implications of Theory for Empirical Specification”. Working Paper. •Jara-Diaz, S.R. (2007). Transport economic theory. Oxford: Elsevier. •MaFadden, D. (1973)“Conditional Logit Analysis of Qualitative Choice behavior”. UNIVERSITY OF LEEDS Institute for Transport Studies (ITS) • Since the theoretical work of Small and Rosen (1981), applications in discrete choice models to welfare analysis in transportation sector have taken relevance in the academic and policy-makers grounds. • The mis-specifying of incomes in discrete choice models might potentially lead to inaccurate measures of welfare. • The theory in discrete choice models has made an important progress over years, that its recent approaches may cope potentially the mis-specifying of incomes in discrete models. • To examine the role of incomes in discrete choice models from: (1) the theoretical basis in welfare measure; and (2) practical application in investment transport appraisal. Literature Review Theoretical basis: to review the concepts stated in Batley and Ibanez (2010). Practical basis: to examine how incomes have been specified in DCM in literature. Cases study (a) Crossrail and (b) Linea 2: to review the way of incomes have (or not) been specified in the calculation of welfare. to analyse the assumptions regarding incomes in measuring user benefits. Report of findings Implications of mis-specifying incomes in welfare analysis. Outline a practical guidance of income effects in discrete choice models. • Incomes in discrete choice models might have implications for practical purposes in measuring welfare. • The implications in welfare measure of mis-specifying incomes in discrete choice models might be significant and lead to inaccurate calculations of benefits in transport investment appraisal under some circumstances. • Assumptions regarding incomes might be potentially more compatible with techniques in advanced discrete models. Marshallian Demand X=X(P,M) Hicksian Demand X=X(P,U0) P X1 M/P1 P0 P1 Subst. Effect Income Effect a b a + b = CS a = CV 𝑀𝑀𝑀𝑀𝑀𝑀 𝑈𝑈 𝑋𝑋 s.t. ∑ 𝑃𝑃𝑖𝑖 𝑋𝑋𝑖𝑖 ≤ 𝐼𝐼𝑖𝑖 ; 𝑋𝑋𝑖𝑖 ≥ 0 X2 X1 M/P0 A B M/P1 C U1 U0 𝐶𝐶𝐶𝐶 = − � � 𝑋𝑋𝑖𝑖 𝑐𝑐 (𝑃𝑃𝑖𝑖 𝑈𝑈0) 𝑑𝑑𝑃𝑃𝑖𝑖 𝑖𝑖 𝑃𝑃𝑃 𝑃𝑃0 Neo-classical approach of welfare Δ𝑀𝑀𝑀𝑀𝑀𝑀 = − � � 𝑋𝑋𝑖𝑖(𝑃𝑃, 𝐼𝐼) 𝑑𝑑𝑃𝑃𝑖𝑖 𝑖𝑖 𝑃𝑃𝑃 𝑃𝑃0 𝐶𝐶𝐶𝐶 = − ∫ ∑ 𝑋𝑋𝑖𝑖 𝑐𝑐 𝑃𝑃𝑖𝑖 𝑈𝑈0 𝑑𝑑𝑃𝑃𝑖𝑖𝑖𝑖 𝑃𝑃𝑃 𝑃𝑃0 = 𝑒𝑒 𝑃𝑃0 , 𝑈𝑈0 − 𝑒𝑒(𝑃𝑃1 , 𝑈𝑈0) A theoretical approach of income effect in welfare measure Discrete choice models in demand Discreteness in demand can be modelled in at least three forms when goods may be (Small and Rose, 1981): (a) available in continuous quantities; but in only one mutually exclusive varieties, e.g. housing/rent; (b) available in discrete large units that one or two are chosen, e.g. transport modes; and (c) purchased because nonconcavities leads corner solutions, e.g.tv show aired simultaneously. To exemplify illustratively a probabilistic choice, a decision-maker faces the following task: Decision-maker 𝑃𝑃𝑃𝑃𝑘𝑘 = 𝑃𝑃𝑃𝑃(𝑤𝑤𝑘𝑘 + 𝜀𝜀𝑘𝑘 > 𝑤𝑤𝑘𝑘 + 𝜀𝜀𝑘𝑘)∀𝑖𝑖 ≠ 𝑘𝑘 𝑃𝑃𝑃𝑃𝑡𝑡𝑡𝑡𝑡𝑡𝑡𝑡 𝑡𝑡 = 𝑃𝑃𝑃𝑃(𝜀𝜀𝑏𝑏𝑏𝑏𝑏𝑏 − 𝜀𝜀𝑡𝑡𝑡𝑡𝑡𝑡𝑡𝑡 𝑡𝑡 < 𝑤𝑤𝑡𝑡𝑡𝑡𝑡𝑡𝑡𝑡 𝑡𝑡 − 𝑤𝑤𝑏𝑏𝑏𝑏𝑏𝑏) 𝑃𝑃𝑃𝑃𝑏𝑏𝑏𝑏𝑏𝑏 = 𝑃𝑃𝑃𝑃(𝜀𝜀𝑡𝑡𝑡𝑡𝑡𝑡𝑡𝑡 𝑡𝑡 − 𝜀𝜀𝑏𝑏𝑏𝑏𝑏𝑏 < 𝑤𝑤𝑏𝑏𝑏𝑏𝑏𝑏 − 𝑤𝑤𝑡𝑡𝑡𝑡𝑡𝑡𝑡𝑡 𝑡𝑡) Institute for Transport Studies MA Transport Economics FACULTY OF ENVIRONMET Presented by: Gian Carlos Silva Ancco - ml12gcs@leeds.ac.uk - May 2014 Advised by: Dr. Richard Batley Crossrail (London): £10.2 billion investment; 21km twin-bore tunnel, NPV £6.5 billion using DfT VoT or £11.5 billion using TfL VoT; increased capacity of London transport network; time saving DfT £7.4 bn or TfL £10.2 bn; congestion relief DfT £5.9 bn or TfL £8.1 bn; 200,000 passengers morning peak; discount rate 3.5 and 3.0; conventional BCR DfT 1.87 or TfL 2.55. Metro Linea 2 (Lima): USD 6.5 billion investment; PPP contract; 35km twin- bore tunnel; 4 to 6 year of construction; 35 stations; number of trains from 26 to 42; 662,346 estimated passengers daily; NPV USD 759 miles; discount rate 9%, BCR 1.15, VoT USD 2.51; max reduced journey time between two stations: 70 min. The income effect (variation in the purchase power) may be present in a lump-sum or change in price. The formulation of welfare is given by: Δ𝑀𝑀𝑀𝑀𝑀𝑀 = − ∫ ∑ 𝑋𝑋𝑖𝑖(𝑃𝑃, 𝐼𝐼) 𝑑𝑑𝑃𝑃𝑖𝑖𝑖𝑖 = − 𝑃𝑃𝑃 𝑃𝑃0 ∫ ∑ − 𝑑𝑑𝑑𝑑 𝑑𝑑𝑑𝑑𝑑𝑑 𝑑𝑑𝑑𝑑 𝑑𝑑𝑑𝑑 𝑑𝑑𝑃𝑃𝑖𝑖𝑖𝑖 𝑃𝑃𝑃 𝑃𝑃0 If marginal utility of income (denoted by λ) is constant, then ∆MCS equals CV: Δ𝑀𝑀𝑀𝑀𝑀𝑀 = 𝑑𝑑𝑑𝑑 𝑑𝑑𝑑𝑑 𝑣𝑣 𝑃𝑃1, 𝑦𝑦 − 𝑣𝑣 𝑃𝑃0, 𝑦𝑦 = 𝑒𝑒 𝑃𝑃0, 𝑈𝑈0 − 𝑒𝑒(𝑃𝑃1, 𝑈𝑈0) The assumption of constant λ implies path- independency in Marshallian demand, i.e. alike welfare measure in Hickesian and Marshallian approach. Where: 𝜆𝜆 = 𝑑𝑑𝑉𝑉 𝑑𝑑𝑑𝑑 ⟹ 𝜕𝜕𝑥𝑥𝑥𝑥 𝜕𝜕𝑝𝑝𝑝𝑝 = 𝜕𝜕𝜕𝜕𝜕𝜕 𝜕𝜕𝜕𝜕𝜕𝜕 ∀𝑖𝑖, 𝑗𝑗
- 25. f f Site Profile: Merseyside Population: 1,381,200 (9th) 645 km2 (43rd) 5 Boroughs – Knowsley, Liverpool, Sefton, St Helens, Wirral Valued at £21.9 Billion (2.1% of U.K economy) GVA (Gross Value Added) 0 1 2 3 4 50.5 Miles Ward_Boundaries No. of Households With Access To A Vehicles 18 - 94 95 - 171 172 - 247 248 - 323 324 - 400 401 - 476 477 - 552 553 - 628 629 - 705 706 - 781 No Data ¡ No. Of Households with No Access To A Vehicle (Inset of Wirral and Liverpool Boundaries) 0 2.5 5 7.5 101.25 Miles 0 1 2 3 4 50.5 Miles Ward_Boundaries No. Of Households with Dependents 8 - 28 29 - 49 50 - 69 70 - 89 90 - 110 111 - 130 131 - 150 151 - 170 171 - 191 192 - 211 No Data ¡ No. Of Households with Dependents in Merseyside (Inset of Wirral and Liverpool Boundaries) 0 2.5 5 7.5 101.25 Miles The Maps: The Maths: PC = TC TC + TT CIJ = a1.tIV + a2.tWK + a3.tWT + a4.tIN + a5.F + a6 The Method: Ai = Σ [BJf(CIJ)] Accessibility To Destination: This will demonstrate how accessible a location is based on either Thiessen polygons (zone inside polygon is closer to that sample) or isochrones (coloured bars of equal value). Modal Split/Destination Attractiveness: Multi-nomial logit models calculating modal split. (Equation can be used for destinations). These can be portrayed 3D or by colour (large spike, more accessible) Route Allocation/ Trip Chaining: Network Analyses using the cost equation above will show the “cheapest” route for an i n d i v i d u a l t o u s e . A l s o demonstrates trip-chaining (best way to carry out multiple tasks). D e m o n s t r a t e a n d evaluate disaggregate t e c h n i q u e s o f accessibility analysis Potential Issues Establishing parameters. How to measure a preference? How disaggregate is too disaggregate? Issues with deterrence functions. How viable are the methods? Literature Review: 1970 Geographical Space Accessible Space 2011 Hagerstrand developed a time-geographies concept. 3 M a i n C o n s t r a i n t s : “capability constraints”, “coupling constraints” and “authority constraints”. Computing power h a s a l l o w e d f o r disaggregate activity modelling to be c a r r i e d o u t . S t i l l a “ p i o n e e r i n g ” m e t h o d . B u f f e r s a r e predominant technique Not a spatially defined problem. – Large geographical space, small accessible space. Need to consider area mobility, individual m o b i l i t y a n d a r e a a c c e s s i b i l i t y. Economic status, car availability and physical or social preferences and limitations can affect how a person can or wants to travel. A Local Travel Plan (LTP) set up by the Local Authority and Merseytravel seeks to “develop a fully integrated and sustainable transport network... And ensures good access for all in the community” (Merseytravel 2000) The End Result: GIS outputs of varying types with two main aims: 1. Levels of accessibility for individuals demonstrating how their lifestyles affect their travel choices and access. 2. Differences between the disaggregate methods used in the study and aggregate methods carried out as a comparative tool. This will establish if the individual level studies are more accurate than aggregate measures, and if so, to what extent, with what outcomes? What Next…? Need to establish parameters to use within the functions. Carry out the GIS techniques and modelling. Analyse and evaluate the datasets – See what is possible. Large number of citizens in certain areas are not car users and as such find it hard to carry out fundamental tasks, such as taking children to school or going shopping. Thus creating and social exclusion transport poverty. f f Some Important Questions: Can GIS model the movements of individuals based on their preferences, motivations and restrictions, and how these relate to transport? Does a micro-level analysis offer a viable alternative to the current methods of study? One Size Doesn’t Fit All... Many relationships exist between different individuals preferences, capabilities and the levels of their t r a n s p o r t a c c e s s i b i l i t y . Aggregate methods (groups, not individuals) can miss important elements of a persons accessibility. Study Aims: Carry out an accessibility study of Merseyside at a disaggregate level. Highlight inefficiencies in aggregate modelling Show that individuals from the same areas have differing travel patterns.
- 26. Methodology Traffic signals are important in the safe use of road space and efficient control of traffic in congested urban transport networks. Combining a traffic model and an optimisation method, traffic signal control models devise signal timings that meet certain objectives. The current traffic signal control is based on the average traffic condition, and does not account for variability (or say ‘noise’) in traffic. To develop a traffic signal timing model that account for variability in traffic. To consider Cross Entropy Method (CEM) with micro-simulation in the model. • To test the performance of the model in a realistic network. Background 3 Study4 Scenarios Objectives2 1 DRACULA micro-simulation modelling Get detailed information (delay, driving behavior, etc.) to appraise performance of each signal timing. Cross Entropy Method (CEM) Start of stage 1 Start of stage 2 1 2 3 4 56 Distribution function Select the best 5% solutions and update parameters of distribution through minimizing the Kullback–Leibler distance, which is equivalent to the program: 𝑀𝑎𝑥 𝐷 𝜇, 𝜎 = Max ln 𝑝 𝑥𝑖; 𝜇, 𝜎 𝑖 Where 𝑥𝑖 represents the best 5% solutions. Stop the iteration until the new values of parameters are equal (or close enough) to the previous one. Solutions Appraise Solutions Micro-simulation model Rank and select Update Best Solution Convergence ? Develop a Matlab code to implement the CEM model, providing input solutions to and taking results from DRACULA. Test the integrated model on a number of representative and realistic networks, and compare the results with standard signal timings. Test the performance on modelling different options (e.g. different CEM updating methods, number of simulation runs) Compare and contrast the restricts, draw conclusions and write report. Jialiang Guo - ml12j5g@leeds.ac.uk MSc (Eng) Transport Planning and Engineering Supervisor: Ronghui Liu May 2014 µ σ Roundabout Signal timing generation Generate a big sample of signal timings (say 1000) from a given distribution function 𝑝 𝑥; 𝜇, 𝜎
- 27. • Road pricing (tolling) dates back to the 17th century introduced after the turnpike Act – 1663 in UK and to 18th century in the USA; • Was predominantly used to raise funds for construction and maintenance of highways; • In recent times, tolling has been used for numerous reasons; • Implemented in Singapore since 1975 as a traffic management tool; • In London, it has been used since 2003 to reduce congestion and protect the environment; • Norway, Sweden and Malaysia use road tolling to raise funds for road transport budget support. Road Pricing: A Case of Competing Private Road Toll Operators The study intends to: • Study techniques of identifying Nash Equilibrium for multiple toll operators; • Examine toll levels that ensure private operators maximise revenue and meet the Nash Equilibrium conditions; • Establish how revenue maximising tolls compare with social welfare maximising tolls. By Jonah Mumbya | Supervisor – Mr. Andrew Koh | Second Reader – Dr. Chandra Balijepalli Introduction Objectives Motivation Effects of Increasing Congestion Environmental Costs of Traffic Government Budget Constraints • Global costs of congestion are high and projected to increase with increasing traffic delays; • In UK, congestion costs (due to delay) stood at £20bn in 2000 and projected to increase to £30bn by 2020; • NTM projects traffic to grow by 43% as a result of a 66% GDP growth from 2010- 2040 in England alone; • This would lead to congestion increasing by 114% and lost seconds per mile would increase by 36% hence cost as travel speeds would reduce by 8%. • Transport is the third largest contributor to global warming just behind energy (electricity and heating) and industry; • In UK, Road transport contributed over 27% to Green House Gasses with cars having 58% of this in 2009; • With increasing motorisation, this is likely to be the same or worse with time. • Governments are continually getting constrained to finance road infrastructure using traditional budget appropriations; • Hence road users ought to meet part of the road infrastructure investment costs/budgets; • Road pricing supports about 32% of Norway’s national road system budget and 46% of Spain's road budget. Methodology a) Link Selection; Link selection shall be based on the difference between link marginal cost and average cost and the level of congestion of the do-nothing scenario. b) Determine Tolls; Iteratively, tolls will be set until a Nash Equilibrium is achieved for the competing toll operators. c) Traffic Assignment; Using SATURN, traffic shall be assigned to the network based on Wardrop’s first equilibrium principle. d) Calculation of Revenue and Benefits. Based on assigned link flows from SATURN, revenues and social benefits will be calculated. Test Network – Edinburgh 1 2 3 4 5 Select Links [SATURN] Set Tolls Assign Traffic to the Network [SATURN] Is Nash Equilibrium Achieved? Calculate Revenue and Social Benefits No Yes
- 28. INVESTMENT DECISIONS FOR RESILIENT TRANSPORT INFRASTRUCTURE: A CASE STUDY OF THE DAWLISH RAILWAY LINE COLLAPSE Kwame Nimako: MSc Transport Planning and Engineering (2013-2014) Supervisors: Prof. Greg Marsden and Prof. Nigel Wright 1. BACKGROUND • A good transport system promotes the movement of people, goods and services from one point to another under normal conditions (Amdal and Swigart, 2010). A nation’s economic vitality to a large extent depends on its transport network (Amdal and Swigart, 2010). • The occurrences of natural disasters such as flooding, make transport networks such as railway lines vulnerable (Doll et al., 2013), thereby impacting negatively on train services. • For the disruption at Dawlish, the Train Operating Companies will be paid £16 million by Network Rail for lost revenue over the period (BBC, 2014). • As the frequency and magnitude of such disruptive events become more probable in future due to climate change, the cost of providing engineering interventions required for reliable transport services increases significantly. • Since most transport infrastructure are long term assets (Doll et al., 2013), there is the need for adequate investment decisions on cost effective strategies to be employed to enhance their resilience over their life span. 2. AIM The aim of this dissertation is to develop a methodology to be utilised in making cost-effective investment decisions to improve the resilience of railway lines to disruptions. 3. OBJECTIVES To achieve this aim, the following objectives have been set: i. Understanding how demand for transport changes during a major flooding event ii. Estimating the impacts of the resultant disruption on users of the infrastructure iii. Collecting estimates of alternative flood risk mitigation investments iv. Developing a methodology to assess the cost- effectiveness of such investments under different future scenarios of flood risk Great Western Rail line - London-Exeter-Dawlish-Plymouth-Penzance. (Source: First Great Western network map) Location of Dawlish and the Railway line Disruption (Source: Google.com) 4. PROPOSED METHODOLOGY 5. EXPECTED OUTCOME It is anticipated that this study will produce an Investment- Frequency Matrix based on current and future scenarios of disruptions to be utilised to improve the resilience of railway lines. 6. REFERENCES • Amdal, J.R. and Swigart, S.L. 2010. Resilient Transportation Systems in a Post-Disaster Environment: A Case Study of Opportunities Realized and Missed in the Greater New Orleans Region, 2010. • Doll, C. et al. 2013. Adapting rail and road networks to weather extremes: case studies for southern Germany and Austria. Natural Hazards. pp.1-23. • British Broadcasting Corporation. 2014. Storm-hit Dawlish rail line compensation payout revealed. [Online]. [Accessed 28 April 2014]. Available from:http://www.bbc.co.uk/news/uk-england-devon- 27055780.