Equity analysis - urban mobility challenges in developing countries
•
1 like•644 views

Presented by Eduardo A. Vasconcellos of National Public Transport Association (ANTP), Brazil. At www.its.leeds.ac.uk/workshop-transport-equity

Recommended
Recommended
More Related Content
What's hot
What's hot (14)
Viewers also liked
Viewers also liked (20)
Similar to Equity analysis - urban mobility challenges in developing countries
Similar to Equity analysis - urban mobility challenges in developing countries (20)
More from Institute for Transport Studies (ITS)
More from Institute for Transport Studies (ITS) (20)
Recently uploaded
Recently uploaded (20)
Equity analysis - urban mobility challenges in developing countries
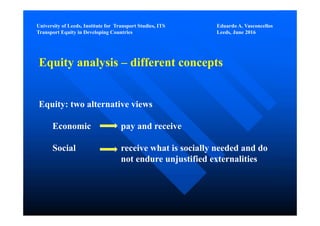
- 1. University of Leeds, Institute for Transport Studies, ITS Eduardo A. Vasconcellos Transport Equity in Developing Countries Leeds, June 2016 Equity analysis – different concepts Equity: two alternative views Economic pay and receive Social receive what is socially needed and do not endure unjustified externalities
- 2. University of Leeds, Institute for Transport Studies, ITS Eduardo A. Vasconcellos Transport Equity in Developing Countries Leeds, June 2016 People Laws/codes Infrastructure Vehicles Mobility Consumptions Space Time Energy Externalities Pollution Safety Congestion Costs, efficiency and equity Methodological concept
- 3. Mobility and democracy: challenges Eduardo A for developing countries VasconcellosUniversity of Leeds, Institute for Transport Studies, ITS Eduardo A. Vasconcellos Transport Equity in Developing Countries Leeds, June 2016 Consumption Impact Measurement Use of the city Trips Mobility Immobility Space Use of Territory km roads/km2 Use of roads m2/person/veh. Space budget Km/day/person Travel time Travel time budget Hours/day Travel time per mode Hours/trip Costs Individual costs $/trip Burden on income Fare costs/income Relative costs Costs per mode Energy Energy by vehicles gep/trip Age Income Gender etc
- 4. Mobility and democracy: challenges Eduardo A for developing countries VasconcellosUniversity of Leeds, Institute for Transport Studies, ITS Eduardo A. Vasconcellos Transport Equity in Developing Countries Leeds, June 2016 Impact Measurement Safety injury-deaths/100,000 inhabitants Pollution air concentration + exposure Congestion “excess” time extra operating costs and emissions impact on public transport vehicles ( 25% $) impact on NMT (delay + complex routes) Barrier effect damage to accessibility (longer trips)
- 5. Mobility and democracy: challenges Eduardo A for developing countries VasconcellosUniversity of Leeds, Institute for Transport Studies, ITS Eduardo A. Vasconcellos Transport Equity in Developing Countries Leeds, June 2016 175 157 210 134 0 50 100 150 200 250 A (low) B C D E (high) Increase in trips (income level A = 100) Family Income level Mobility and income S. Paulo Lima Santiago London
- 6. Mobility and democracy: challenges Eduardo A for developing countries VasconcellosUniversity of Leeds, Institute for Transport Studies, ITS Eduardo A. Vasconcellos Transport Equity in Developing Countries Leeds, June 2016 24 56 0 10 20 30 40 50 60 A (high) B C D E F (very poor) % of immobility Family income Immobility and income, São Paulo, 2007 “GAP” 32%
- 7. University of Leeds, Institute for Transport Studies, ITS Eduardo A. Vasconcellos Transport Equity in Developing Countries Leeds, June 2016 77 91 87 79 88 79 70 85 74 88 23 10 13 21 12 21 30 15 26 12 0 10 20 30 40 50 60 70 80 90 100 % of road space Arterial road space use by main modes, Brazilian cities Automobiles Buses Road space
- 8. University of Leeds, Institute for Transport Studies, ITS Eduardo A. Vasconcellos Transport Equity in Developing Countries Leeds, June 2016 16 8 5,2 3,9 3,1 26 13 9 6 5 0 5 10 15 20 25 30 1 2 3 4 5 sqm per passenger Passengers/vehicle Road space per passenger, auto and bus Auto Bus 110 339 170 113 85 68 0 50 100 150 200 250 300 350 400 1 2 3 4 5 6 Energy/passenger Persons/vehicle Energy per passenger, auto and bus Auto Bus A bus with 2 passengers is more space-efficient than a car with one person A bus with 3 passengers is more energy-efficient than a car with one person
- 9. University of Leeds, Institute for Transport Studies, ITS Eduardo A. Vasconcellos Transport Equity in Developing Countries Leeds, June 2016 30,5 22,2 38,7 48,2 0,0 10,0 20,0 30,0 40,0 50,0 60,0 Automobile Motorcycle Microbus Bus Minutes/trip Average travel time Travel time, motorised modes, large Latin American cities Time Range 5‐40 5‐30 10‐60 20‐90
- 10. University of Leeds, Institute for Transport Studies, ITS Eduardo A. Vasconcellos Transport Equity in Developing Countries Leeds, June 2016 0,0 5,0 10,0 15,0 20,0 25,0 30,0 35,0 % of minimum wage Cost of 50 bus fares x minimum wage Most cities above 10% level
- 11. University of Leeds, Institute for Transport Studies, ITS Eduardo A. Vasconcellos Transport Equity in Developing Countries Leeds, June 2016 Mode Priority(km) % of roads Buses 410 0.14 Pedestrians 71 0.02 Cyclists 426 0.15 Brazil: road priorities on cities, 2008 (460 cities with more than 60,000 inhabitants) Road system: 282,000 km
- 12. University of Leeds, Institute for Transport Studies, ITS Eduardo A. Vasconcellos Transport Equity in Developing Countries Leeds, June 2016 MODE Impact per passenger (bus values = 1) Energy Pollutants Cost Road space Bus 1 1 1 1 Motorcycle 1.8 12.8 0.3 5 Automobile 3.9 5.7 1.5 7.2 Mobility relative impacts, three main modes, Brazil
- 13. University of Leeds, Institute for Transport Studies, ITS Eduardo A. Vasconcellos Transport Equity in Developing Countries Leeds, June 2016 325 921 1075 1516 1464 0 200 400 600 800 1000 1200 1400 1600 0 to 250 251 to 500 501 to 1000 1001 to 1800 1801 to 3600 3601 or more Rates (values for lowest income level = 100) Family income Mobility metabolism, São Paulo, 2007 Travel time Dynamic distance Energy Pollutants Accidents Note: in the case of accidents, the index represents the safety risk imposed on others; it considers that pedestrians are the most vulnerable participants and are protected by the Traffic Code, which means that pedestrian accidents were attributed to the drivers of the vehicles involved.
- 14. Mobility subsidies, Brazil Mode R$ billion/year Share (%) Autos/Motorcycles 20.1 to 25.7 85 Taxis 0.42 2 Public Transport 3.4 to 3.7 13 Total 23.9 to 29.5 100 University of Leeds, Institute for Transport Studies, ITS Eduardo A. Vasconcellos Transport Equity in Developing Countries Leeds, June 2016
- 15. University of Leeds, Institute for Transport Studies, ITS Eduardo A. Vasconcellos Transport Equity in Developing Countries Leeds, June 2016 References ANTP, Sistema de Informação da Mobilidade Urbana, www.antp.org.br (reports in Portuguese) CAF ‐Banco de Desarrollo de América Latina, Observatorio de Movilidad Urbana – OMU www.caf.com (reports in Spanish) Vasconcellos, Eduardo A .(2001) Urban transport, environment and equity – the case for developing countries, Earthscan, UK. ____________________(2015) Transporte urbano y movilidad – reflexiones y propuestas para países en desarrollo,UNSAM, Argentina. ____________________ (2010) Análisis de la movilidad urbana. Espacio, medio ambiente y equidad, CAF.